Richland County, Illinois
| Richland County, Illinois | |
|---|---|
 Richland County Courthouse in Olney | |
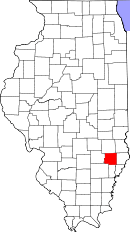 Location in the U.S. state of Illinois | |
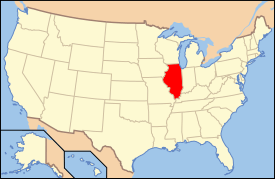 Illinois's location in the U.S. | |
| Founded | February 24, 1841 |
| Seat | Olney |
| Largest city | Olney |
| Area | |
| • Total | 362 sq mi (938 km2) |
| • Land | 3,560 sq mi (9,220 km2) |
| • Water | 1.9 sq mi (5 km2), 0.5% |
| Population | |
| • (2010) | 16,233 |
| • Density | 45/sq mi (17/km²) |
| Congressional district | 15th |
| Time zone | Central: UTC-6/-5 |
Richland County is a county located in the U.S. state of Illinois. According to the 2010 census, it had a population of 16,233.[1] Its county seat is Olney.[2]
History
Richland County was established on February 24, 1824, out of portions of Clay and Lawrence counties.
 Richland County at the time of its creation in 1841
Geography
According to the U.S. Census Bureau, the county has a total area of 362 square miles (940 km2), of which 360 square miles (930 km2) is land and 1.9 square miles (4.9 km2) (0.5%) is water.[3]
Climate and weather
| Olney, Illinois | ||||||||||||||||||||||||||||||||||||||||||||||||||||||||||||
|---|---|---|---|---|---|---|---|---|---|---|---|---|---|---|---|---|---|---|---|---|---|---|---|---|---|---|---|---|---|---|---|---|---|---|---|---|---|---|---|---|---|---|---|---|---|---|---|---|---|---|---|---|---|---|---|---|---|---|---|---|
| Climate chart (explanation) | ||||||||||||||||||||||||||||||||||||||||||||||||||||||||||||
| ||||||||||||||||||||||||||||||||||||||||||||||||||||||||||||
| ||||||||||||||||||||||||||||||||||||||||||||||||||||||||||||
In recent years, average temperatures in the county seat of Olney have ranged from a low of 19 °F (−7 °C) in January to a high of 88 °F (31 °C) in July, although a record low of −25 °F (−32 °C) was recorded in February 1951 and a record high of 112 °F (44 °C) was recorded in July 1936. Average monthly precipitation ranged from 2.73 inches (69 mm) in February to 4.76 inches (121 mm) in May.[4]
Major highways
Adjacent counties
- Jasper County (north)
- Crawford County (northeast)
- Lawrence County (east)
- Wabash County (southeast)
- Edwards County (south)
- Wayne County (southwest)
- Clay County (west)
Demographics
| Historical population | |||
|---|---|---|---|
| Census | Pop. | %± | |
| 1850 | 4,012 | — | |
| 1860 | 9,711 | 142.0% | |
| 1870 | 12,803 | 31.8% | |
| 1880 | 15,545 | 21.4% | |
| 1890 | 15,019 | −3.4% | |
| 1900 | 16,391 | 9.1% | |
| 1910 | 15,970 | −2.6% | |
| 1920 | 14,044 | −12.1% | |
| 1930 | 14,053 | 0.1% | |
| 1940 | 17,137 | 21.9% | |
| 1950 | 16,889 | −1.4% | |
| 1960 | 16,299 | −3.5% | |
| 1970 | 16,829 | 3.3% | |
| 1980 | 17,587 | 4.5% | |
| 1990 | 16,545 | −5.9% | |
| 2000 | 16,149 | −2.4% | |
| 2010 | 16,233 | 0.5% | |
| Est. 2015 | 16,029 | [5] | −1.3% |
| U.S. Decennial Census[6] 1790-1960[7] 1900-1990[8] 1990-2000[9] 2010-2013[1] | |||
As of the 2010 United States Census, there were 16,233 people, 6,726 households, and 4,438 families residing in the county.[10] The population density was 45.1 inhabitants per square mile (17.4/km2). There were 7,513 housing units at an average density of 20.9 per square mile (8.1/km2).[3] The racial makeup of the county was 97.3% white, 0.7% Asian, 0.5% black or African American, 0.2% American Indian, 0.4% from other races, and 0.9% from two or more races. Those of Hispanic or Latino origin made up 1.3% of the population.[10] In terms of ancestry, 29.6% were German, 11.7% were American, 11.4% were English, and 9.2% were Irish.[11]
Of the 6,726 households, 28.9% had children under the age of 18 living with them, 51.7% were married couples living together, 9.6% had a female householder with no husband present, 34.0% were non-families, and 29.3% of all households were made up of individuals. The average household size was 2.36 and the average family size was 2.88. The median age was 42.1 years.[10]
The median income for a household in the county was $41,917 and the median income for a family was $53,853. Males had a median income of $41,058 versus $31,296 for females. The per capita income for the county was $22,874. About 9.5% of families and 13.8% of the population were below the poverty line, including 15.1% of those under age 18 and 11.9% of those age 65 or over.[12]
Communities
City
Villages
Unincorporated communities
Townships
Richland County is divided into nine townships:
Notable people
- Alexander W. Swanitz (1851-1915), civil engineer who participated in the construction of railroads in various parts of the country
- Dial D. Ryder (1938-2011), gun smith
See also
References
- 1 2 "State & County QuickFacts". United States Census Bureau. Retrieved July 8, 2014.
- ↑ "Find a County". National Association of Counties. Archived from the original on May 31, 2011. Retrieved 2011-06-07.
- 1 2 "Population, Housing Units, Area, and Density: 2010 - County". United States Census Bureau. Retrieved 2015-07-12.
- 1 2 "Monthly Averages for Olney, Illinois". The Weather Channel. Retrieved 2011-01-27.
- ↑ "County Totals Dataset: Population, Population Change and Estimated Components of Population Change: April 1, 2010 to July 1, 2015". Retrieved July 2, 2016.
- ↑ "U.S. Decennial Census". United States Census Bureau. Archived from the original on May 11, 2015. Retrieved July 8, 2014.
- ↑ "Historical Census Browser". University of Virginia Library. Retrieved July 8, 2014.
- ↑ "Population of Counties by Decennial Census: 1900 to 1990". United States Census Bureau. Retrieved July 8, 2014.
- ↑ "Census 2000 PHC-T-4. Ranking Tables for Counties: 1990 and 2000" (PDF). United States Census Bureau. Retrieved July 8, 2014.
- 1 2 3 "DP-1 Profile of General Population and Housing Characteristics: 2010 Demographic Profile Data". United States Census Bureau. Retrieved 2015-07-12.
- ↑ "DP02 SELECTED SOCIAL CHARACTERISTICS IN THE UNITED STATES – 2006-2010 American Community Survey 5-Year Estimates". United States Census Bureau. Retrieved 2015-07-12.
- ↑ "DP03 SELECTED ECONOMIC CHARACTERISTICS – 2006-2010 American Community Survey 5-Year Estimates". United States Census Bureau. Retrieved 2015-07-12.
 |
Jasper County | Crawford County | | |
| Clay County | |
Lawrence County | ||
| ||||
| | ||||
| Wayne County | Edwards County | Wabash County |
Municipalities and communities of Richland County, Illinois, United States | ||
|---|---|---|
| City | ||
| Villages | ||
| Townships | ||
| Unincorporated communities | ||
| Footnotes | ‡This populated place also has portions in an adjacent county or counties | |
| Counties | 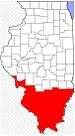 | |
|---|---|---|
| Mid-sized cities (25,000+) | ||
| Small Cities (10,000-25,000) | ||
| Small Cities (5,000-10,000) | ||
| Interstates | ||
| Airports/Military bases |
| |
| Universities | ||
| Colleges | ||
| Sports teams based in the Southern Illinois | ||
Coordinates: 38°43′N 88°05′W / 38.71°N 88.09°W