Results breakdown of the United Kingdom general election, 2010
This is the results breakdown of the United Kingdom general election, 2010.
Swing
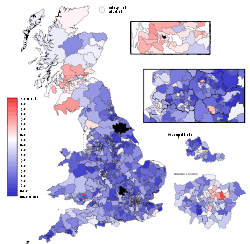
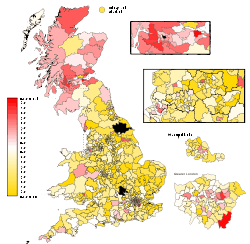
The election was marked by no uniform national swing, with suburban and rural constituencies showing large swings from Labour to the Conservatives, but urban seats showing much smaller swings. Scotland recorded a small swing back to Labour.

Seats changing hands
The following table is a complete list of seats changing hands as a result of the election based on the notional results of the 2005 election, notwithstanding the results of by-elections to the 54th Parliament.[1]
The Conservatives gained more seats than at any other general election since their landslide result in 1931. Labour lost a total of 94 seats, the second most seats it had lost in a single election.
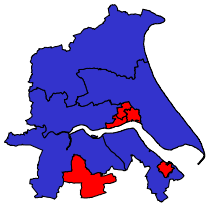
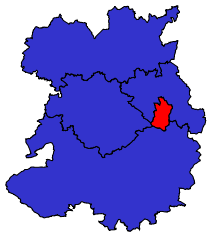
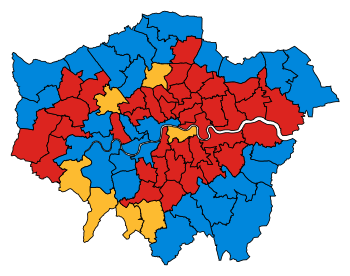
England
Of the 533 seats in England, only 532 were contested on the day of the general election. Polling in Thirsk and Malton was delayed until 27 May due to the death of the UKIP candidate.[2] The Conservatives won an absolute majority of seats in England with 61 seats more than all other parties combined, and securing an average swing of 5.6% from Labour.[3]
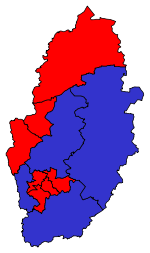
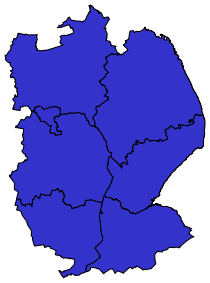
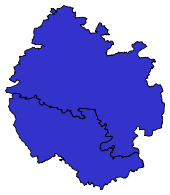
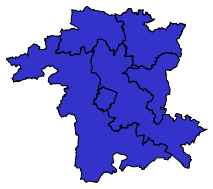
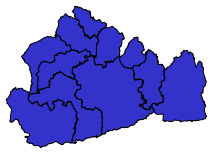
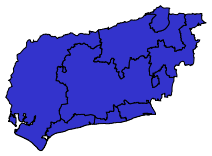
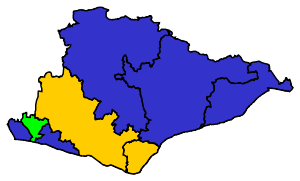
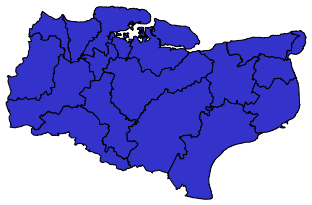
Geographical representations of seats coloured by winning party can be misleading to the eye. Boundaries are drawn by number of electors not geography. This results in rural seats having a large area due to lower population density, while urban seats, with a high density of voters, are geographically quite small. A pure geographical representation of seats coloured by party can make parties with rural seats seem far more popular than urban ones. To counter this bias, the BBC published a map where each seat was an equal size hexagon.[4][5]
| Party | Seats | Seats change |
Votes | % | % change | |
|---|---|---|---|---|---|---|
| Conservative | 297[6] | +92 | 9,908,169 | 39.5 | +3.8 | |
| Labour | 191 | −87 | 7,042,398 | 28.1 | −7.4 | |
| Liberal Democrat | 43 | −4 | 6,076,189 | 24.2 | +1.3 | |
| Green | 1 | +1 | 258,954 | 1.0 | −0.1 | |
| Speaker | 1 | 0 | 22,860 | 0.09 | ||
| Turnout: | 25,047,355 | 65.5 | ||||
Details of results are given below:
-
Durham
-

Cumbria
-
Lancashire
-
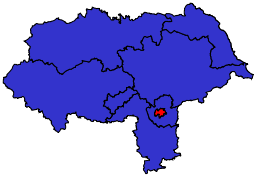
North Yorkshire
-

West Yorkshire
-

South Yorkshire
-

Merseyside
-
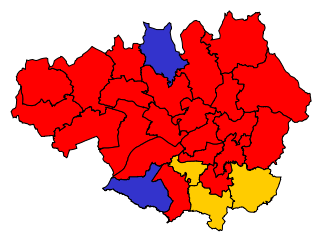
Greater Manchester
-
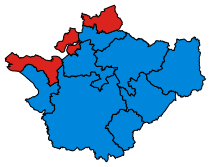
Cheshire
-
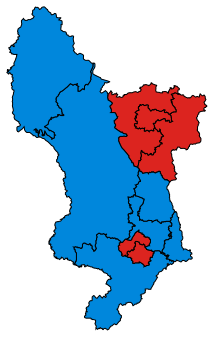
Derbyshire
-
Nottinghamshire
-
Lincolnshire
-

Staffordshire
-

West Midlands
-

Warwickshire
-

Leicestershire and Rutland
-

Northamptonshire
-
Herefordshire
-
Worcestershire
-
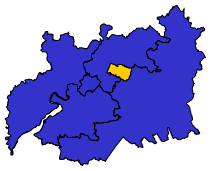
Gloucestershire
-
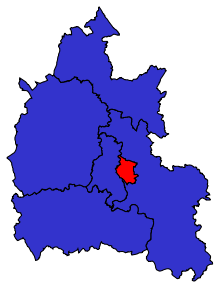
Oxfordshire
-

Buckinghamshire
-
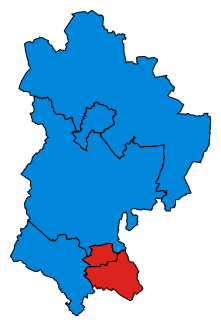
Bedfordshire
-

Cambridgeshire
-

Norfolk
-
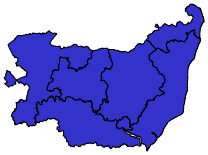
Suffolk
-
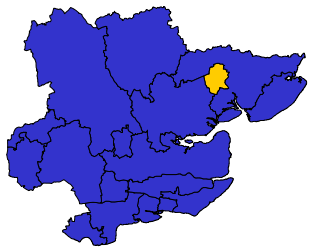
Essex
-

Hertfordshire
-

Berkshire
-
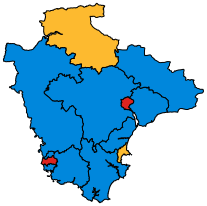
Devon
-
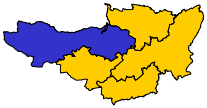
Somerset
-

Dorset
-
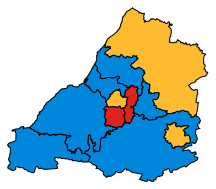
Avon
-

Wiltshire
-

Hampshire
-
Surrey
-
West Sussex
-
East Sussex
-
Kent


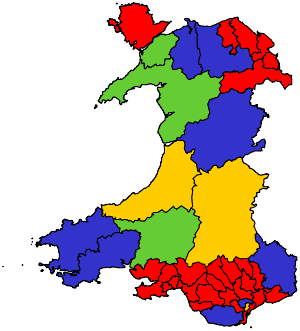
Wales
There were 40 seats contested in Wales. The number of Conservative seats rose from three to eight – the party gained one seat from the Liberal Democrats and four from Labour. Welsh nationalist party Plaid Cymru retained three MPs, including Arfon which the boundary changes had notionally given to Labour. Overall, Labour lost four seats but held on to its remaining 26.
| Party | Seats | Seats change |
Votes | % | % change | |
|---|---|---|---|---|---|---|
| Labour | 26 | −4 | 531,601 | 36.2 | −6.5 | |
| Conservative | 8 | +5 | 382,730 | 26.1 | +4.7 | |
| Liberal Democrat | 3 | −1 | 295,164 | 20.1 | +1.7 | |
| Plaid Cymru | 3 | 0 | 165,394 | 11.3 | −1.3 | |
| Turnout: | 1,446,690 | 64.9 | ||||
Scotland
There were 59 seats contested in Scotland. Every constituency in Scotland was won by the party that had won it at the 2005 election, with Labour regaining the two seats they lost in by-elections since 2005. There was a swing to Labour from the Conservatives of 0.8% (with Labour increasing its share of the vote by 2.5% and the Conservatives increasing by just 0.9%), this left the Conservatives with just a single MP representing a Scottish constituency.
For Scottish results in full, see 2010 United Kingdom general election results in Scotland
| Party | Seats | Seats change |
Votes | % | % change | |
|---|---|---|---|---|---|---|
| Labour | 41 | 0 | 1,035,528 | 42.0 | +2.5 | |
| Liberal Democrat | 11 | 0 | 465,471 | 18.9 | −3.7 | |
| SNP | 6 | 0 | 491,386 | 19.9 | +2.3 | |
| Conservative | 1 | 0 | 412,855 | 16.7 | +0.9 | |
| Turnout: | 2,465,722 | 63.8 | ||||

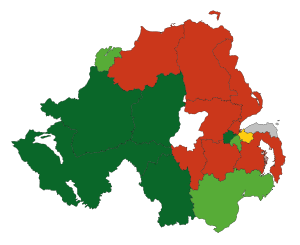
Northern Ireland
There were 18 seats contested in Northern Ireland. Both Irish nationalist parties, Sinn Féin and SDLP, held their seats. The unionist parties, DUP and UUP (the latter contested the election as UCUNF—an electoral pact with the Conservatives), lost one seat each. The DUP lost Belfast East to the Alliance and in North Down the UUP's Sylvia Hermon left the party over the alliance with the Conservatives and retained her seat as an independent. This left the nationalist parties with eight seats, the unionist parties with eight seats (all DUP), the Alliance with one seat and an independent with one seat. It is the first time since the Partition of Ireland that unionist parties failed to secure a majority of Northern Ireland's Westminster seats in a general election. It was also the first time since Partition that a Nationalist party, Sinn Féin, topped the popular vote at a Westminster election, though winning three fewer seats than the DUP.
Sinn Féin, as an Irish republican party, refuse to take their seats at Westminster (see abstentionism). This leaves 645 MPs to take their seats at Westminster (after the Thirsk and Malton poll), reducing the effective threshold for a parliamentary majority from 326 to 323.
| Party | Seats | Seats change |
Votes | % | % change | |
|---|---|---|---|---|---|---|
| DUP | 8 | −1 | 168,216 | 25.0 | −8.7 | |
| Sinn Féin | 5 | 0 | 171,942 | 25.5 | +1.2 | |
| SDLP | 3 | 0 | 110,970 | 16.5 | −1.0 | |
| Alliance | 1 | +1 | 42,762 | 6.3 | +2.4 | |
| Independent - Sylvia Hermon | 1 | +1 | 21,181 | 3.1 | — | |
| UCU-NF | 0 | −1 | 102,361 | 15.2 | −2.6 | |
| Turnout: | 673,871 | 57.6 | −7.8 | |||
References
- ↑ The Times - Election '10 - Gains and losses
- ↑ "Tories triumph in Thirsk and Malton poll". The Times. London. 28 May 2010. Retrieved 4 July 2010.
- ↑ Staff (7 May 2010). "Election 2010: England". BBC NEWS. BBC. Retrieved 10 May 2010.
- ↑ "BBC map with selectable geographic and proportional views". BBC News. Retrieved 2011-06-11.
- ↑ England results BBC News, accessed 9 May 2010
- ↑ Note: this figure excludes John Bercow (Buckingham), who is recorded by the BBC as a "Conservative", despite the fact he is the incumbent Speaker.
| General elections |
|
|---|---|
| Local elections |
|
| European elections | |
| Referendums | |
| |