Ranked lists of Spanish autonomous communities
This article includes several ranked indicators for Spain's autonomous communities, as well as for the autonomous cities of Ceuta and Melilla.
By area
Spanish autonomies by area.[1]
| # | Autonomous community | Area (km2) | % | Comparable area |
|---|---|---|---|---|
| 1 | | 94,223 | 18.6% | |
| 2 | | 87,268 | 17.2% | |
| 3 | | 79,463 | 15.7% | |
| 4 | | 47,719 | 9.4% | |
| 5 | | 41,634 | 8.2% | |
| 6 | | 32,114 | 6.3% | |
| 7 | | 29,574 | 5.8% | |
| 8 | | 23,255 | 4.6% | |
| 9 | | 11,313 | 2.2% | |
| 10 | | 10,604 | 2.1% | |
| 11 | | 10,391 | 2.1% | |
| 12 | | 8,028 | 1.6% | |
| 13 | | 7,447 | 1.5% | |
| 14 | | 7,234 | 1.4% | |
| 15 | | 5,321 | 1.05% | |
| 16 | | 5,045 | 1.0% | |
| 17 | | 4,992 | 0.99% | |
| 18 | | 18.5 | 0.0038% | |
| 19 | | 12.3 | 0.0028% | |
| Total: | 505,992 | 100% | | |
By length of coastline
Spanish autonomies by length of coastline.[2]
| # | Autonomous community | Length (km) | Comparable country |
|---|---|---|---|
| 1 | Canary Islands | 1,583 | |
| 2 | Galicia | 1,498 | |
| 3 | Balearic Islands | 1,428 | |
| 4 | Andalusia | 945 | |
| 5 | Catalonia | 699 | |
| 6 | Valencian Community | 518 | |
| 7 | Asturias | 401 | |
| 8 | Cantabria | 284 | |
| 9 | Region of Murcia | 274 | |
| 10 | Basque Country | 246 | |
| 11 | Ceuta | 26 | |
| 12 | Melilla | 12 | |
| — | Aragon | 0 | — |
| — | Castile and León | 0 | — |
| — | Castile–La Mancha | 0 | — |
| — | Extremadura | 0 | — |
| — | La Rioja | 0 | — |
| — | Community of Madrid | 0 | — |
| — | Navarre | 0 | — |
| Total: | 7,880 | | |
By population
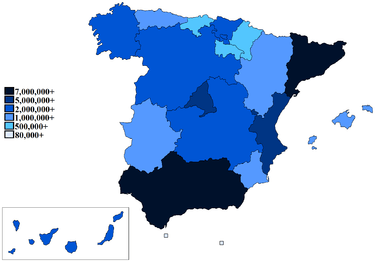
Map of each community's population as of 2011
Spanish autonomies by population (January 1, 2011).[3]
| Rank | Region | Population (2011) | Population (2001) | Comparable country |
|---|---|---|---|---|
| 1 | 8,371,268 | 7,357,558 | ||
| 2 | 7,519,838 | 6,343,110 | ||
| 3 | 6,421,878 | 5,423,384 | ||
| 4 | 5,009,930 | 4,162,776 | ||
| 5 | 2,772,927 | 2,695,880 | ||
| 6 | 2,540,251 | 2,456,474 | ||
| 7 | 2,185,405 | 2,082,587 | ||
| 8 | 2,106,349 | 1,760,516 | ||
| 9 | 2,082,655 | 1,694,477 | ||
| 10 | 1,462,125 | 1,197,646 | ||
| 11 | 1,344,502 | 1,204,215 | ||
| 12 | 1,104,521 | 1,058,503 | ||
| 13 | 1,100,503 | 841,669 | ||
| 14 | 1,075,179 | 1,062,998 | ||
| 15 | 640,125 | 555,829 | ||
| 16 | 592,543 | 535,131 | ||
| 17 | 321,171 | 276,702 | ||
| 18 | 83,517 | 71,505 | ||
| 19 | 81,323 | 66,411 | ||
| Total | 46,704,314 | 44,291,413 |
By population density
Spanish autonomies by population density.[4]
| Rank | Region | Population density (2010) | Comparable country |
|---|---|---|---|
| 1 | 5,466.14 | ||
| 2 | 4,153.56 | ||
| 3 | 805.08 | ||
| 4 | 301.32 | ||
| 5 | 284.3 | ||
| 6 | 233.29 | ||
| 7 | 220.33 | ||
| 8 | 219.74 | ||
| 9 | 129.27 | ||
| 10 | 111.7 | ||
| 11 | 102.19 | ||
| 12 | 95.55 | ||
| 13 | 94.29 | ||
| 14 | 63.95 | ||
| 15 | 61.33 | ||
| 16 | 28.22 | ||
| 17 | 27.16 | ||
| 18 | 26.56 | ||
| 19 | 26.42 | ||
| Total | 92 |
By economy
By GRP
GRP (nominal)
Spanish autonomies by gross regional product (nominal) in 2010 international dollars.[5]
| # | Autonomous community | Int$ (MM, 2010) | Comparable country |
|---|---|---|---|
| 1 | Catalonia | 262,388 | |
| 2 | Community of Madrid | 252,407 | |
| 3 | Andalusia | 189,978 | |
| 4 | Valencian Community | 135,310 | |
| 5 | Basque Country | 88,692 | |
| 6 | Castile and León | 75,937 | |
| 7 | Galicia | 73,752 | |
| 8 | Canary Islands | 54,737 | |
| 9 | Castile–La Mancha | 47,611 | |
| 10 | Aragon | 43,294 | |
| 11 | Region of Murcia | 36,225 | |
| 12 | Balearic Islands | 35,304 | |
| 13 | Asturias | 30,645 | |
| 14 | Navarre | 24,654 | |
| 15 | Extremadura | 24,130 | |
| 16 | Cantabria | 18,000 | |
| 17 | La Rioja | 10,432 | |
| 18 | Ceuta | 2,194 | |
| 19 | Melilla | 2,037 | |
| Total: | 1,408,711 | | |
GRP (PPP) per capita per international dollars
Spanish autonomies by gross regional product per capita at purchasing power parity (PPP) in 2010 international dollars.[6]
| # | Autonomous community | Int$ (2010) |
|---|---|---|
| 1 | Basque Country | 40,457 |
| 2 | Navarre | 38,736 |
| 3 | Community of Madrid | 38,712 |
| 4 | Catalonia | 34,952 |
| 5 | La Rioja | 32,326 |
| 6 | Aragon | 32,152 |
| 7 | Balearic Islands | 31,876 |
| 8 | Cantabria | 30,315 |
| 9 | Castile and León | 29,682 |
| 10 | Ceuta | 28,372 |
| 11 | Asturias | 28,271 |
| 12 | Melilla | 26,915 |
| 13 | Valencian Community | 26,441 |
| 14 | Galicia | 26,283 |
| 15 | Canary Islands | 25,512 |
| 16 | Region of Murcia | 24,101 |
| 17 | Castile–La Mancha | 22,766 |
| 18 | Andalusia | 22,487 |
| 19 | Extremadura | 21,742 |
| Average: | 29,810 | |
GRP (PPP) per capita per euro
| # | Autonomous community | Euro (2012)[7] | Percentage difference from the national average[7] | Comparable country |
|---|---|---|---|---|
| 1 | Basque Country | 30,829 | +35.4 | |
| 2 | Community of Madrid | 29,385 | +29.0 | |
| 3 | Navarre | 29,071 | +27.7 | |
| 4 | Catalonia | 27,248 | +19.7 | |
| 5 | Aragon | 25,540 | +12.2 | |
| 6 | La Rioja | 25,508 | +12.0 | |
| 7 | Balearic Islands | 24,393 | +7.1 | |
| 8 | Cantabria | 22,341 | −1.9 | |
| 9 | Castile and León | 22,289 | −2.1 | |
| 10 | Asturias | 21,035 | −7.6 | |
| 11 | Galicia | 20,723 | −9.0 | |
| 12 | Valencian Community | 19,964 | −12.3 | |
| 13 | Canary Islands | 19,568 | −14.1 | |
| 14 | Ceuta | 19,335 | −15.1 | |
| 15 | Region of Murcia | 18,520 | −18.7 | |
| 16 | Castile–La Mancha | 17,698 | −22.3 | |
| 17 | Melilla | 16,981 | −25.4 | |
| 18 | Andalusia | 16,960 | −25.5 | |
| 19 | Extremadura | 15,394 | −32.4 | |
| Average: | 22,772 | --- | ||
By unemployment rate
Spanish autonomies by unemployment rate, according to the Bank of Spain (1st quarter 2012)[8] and EPA (Encuesta de Población Activa, June 2012)[9][10]
| # | Autonomous community | Un. rate (%) Bank of Spain | Un. rate (%) EPA | Comparable country |
|---|---|---|---|---|
| 1 | Andalusia | 33.2 | 33.92 | |
| 2 | Canary Islands | 32.3 | 33.14 | |
| 3 | Extremadura | 32.1 | 33.38 | |
| 4 | Ceuta | 30.4 | 39.47 | |
| Melilla | 30.27 | |||
| 5 | Balearic Islands | 28.0 | 21.27 | |
| 6 | Valencian Community | 27.3 | 27.10 | |
| 7 | Castile–La Mancha | 27.2 | 28.72 | |
| 8 | Region of Murcia | 27.0 | 26.19 | |
| 9 | Catalonia | 22.2 | 21.95 | |
| 10 | Asturias | 20.4 | 21.03 | |
| 11 | Galicia | 20.2 | 21.07 | |
| 12 | La Rioja | 20.1 | 22.71 | |
| 13 | Castile and León | 19.3 | 19.76 | |
| 14 | Community of Madrid | 18.7 | 18.86 | |
| 15 | Cantabria | 18.6 | 17.38 | |
| 16 | Aragon | 18.4 | 18.64 | |
| 17 | Navarre | 16.3 | 16.41 | |
| 18 | Basque Country | 13.6 | 14.56 | |
| Average: | 24.4 | 24.63 | | |
By economic growth
Spanish autonomies by real GRP growth rate (2010–2011).[11]
| # | Autonomous community | Growth (%) 2010–2011 | Growth (%) 2008–2010 | Growth (%) 2008–2011 | Comparable country (period 2010–2011) |
|---|---|---|---|---|---|
| 1 | Canary Islands | 2.1 | −4.5 | −0.81 | |
| 2 | Balearic Islands | 1.8 | −4.5 | −0.93 | |
| 3 | Navarre | 1.5 | −2.4 | −0.33 | |
| 4 | Basque Country | 1.3 | −3.3 | −0.67 | |
| 5 | Castile and León | 1.3 | −2.0 | −0.24 | |
| 6 | Community of Madrid | 0.9 | −2.6 | −0.60 | |
| 7 | La Rioja | 0.8 | −4.8 | −1.35 | |
| 8 | Catalonia | 0.8 | −3.4 | −0.88 | |
| 9 | Cantabria | 0.7 | −3.9 | −1.07 | |
| 10 | Valencian Community | 0.4 | −6.4 | −2.07 | |
| 11 | Ceuta | 0.4 | −1.3 | −0.33 | |
| 12 | Asturias | 0.3 | −5.0 | −1.57 | |
| 13 | Aragon | 0.3 | −4.4 | −1.38 | |
| 14 | Galicia | 0.3 | −3.3 | −1.02 | |
| 15 | Melilla | 0.2 | −0.6 | −0.13 | |
| 16 | Andalusia | 0.2 | −4.3 | −1.40 | |
| 17 | Castile–La Mancha | 0.0 | −4.8 | −1.61 | |
| 18 | Region of Murcia | 0.0 | −4.9 | −1.68 | |
| 19 | Extremadura | −0.3 | −3.2 | −1.16 | |
| Average: | 0.7 | −3.8 | −1.05 | | |
See also
External links
References
- ↑ Ranking of Spain's autonomous communities by area. classora.com
- ↑ Ranking of Spain's autonomous communities by length of coastline. classora.com
- ↑
- ↑
- ↑ National Statistics Office (Spain's GSP and GDP), National Statistics Office. GDP Figures of Spanish autonomous communities and provinces 2000–2010.
- ↑ National Statistics Office (Spain's GRP and GDP per capita), International Monetary Fund's September 2011 database (Spain's implied PPP conversion rate, GDP (PPP) per capita for world countries).
- 1 2 Producto Interior Bruto regional. Año 2012 - Instituto Nacional de Estadistica, 2013
- ↑ Unemployment rate by autonomous communities. Bank of Spain.
- ↑ Paro en España (Unemployment rate in Spain). El País.
- ↑ Ranking of Spain's autonomous communities by unemployment rate. classora.com
- ↑ Regional accounts report, p. 2–5. National Statistic Institute (Instituto Nacional de Estadística, INE).
This article is issued from Wikipedia - version of the 9/19/2016. The text is available under the Creative Commons Attribution/Share Alike but additional terms may apply for the media files.