Qingyuan Manchu Autonomous County
| Qingyuan County 清原县 ᠴᡳᠩᠶᡠᠸᠠᠨ ᠰᡳᠶᠠᠨ | |
|---|---|
| Autonomous county | |
清原满族自治县 Qingyuan Manchu Autonomous Countyᠴᡳᠩᠶᡠᠸᠠᠨ ᠮᠠᠨᠵᡠ ᠪᡝᠶᡝ ᡩᠠᠰᠠᠩᡤᠠ ᠰᡳᠶᠠᠨ | |
 Location in Fushun City | |
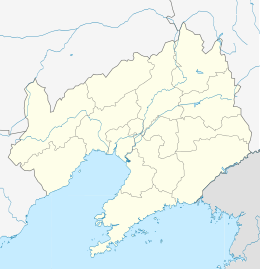 Qingyuan County Location of the seat in Liaoning | |
| Coordinates: 42°06′N 124°55′E / 42.100°N 124.917°ECoordinates: 42°06′N 124°55′E / 42.100°N 124.917°E | |
| Country | People's Republic of China |
| Province | Liaoning |
| Prefecture-level city | Fushun |
| County seat | Qingyuan |
| Area | |
| • Total | 3,921 km2 (1,514 sq mi) |
| Elevation | 238 m (781 ft) |
| Population | |
| • Total | 340,000 |
| • Density | 87/km2 (220/sq mi) |
| Time zone | China Standard (UTC+8) |
| Postal code | 113300 |
| Area code(s) | 0413 |
Qingyuan Manchu Autonomous County (simplified Chinese: 清原满族自治县; traditional Chinese: 清原滿族自治縣; pinyin: Qīngyuán Mǎnzú Zìzhìxiàn), or simply Qingyuan County (清原县) is one of the three counties under the administration of Fushun City, in the east of Liaoning, People's Republic of China, and is also one of the 11 Manchu autonomous counties and one of 117 autonomous counties nationally. It has a population of about 340,000, covering an area of 3,921 square kilometres (1,514 sq mi).
Administrative divisions[1]
There are 18 towns and 7 townships in the county.
Towns:
- Qingyuan, Dagujia (大孤家镇), Hongtoushan (红透山镇), Ying'emen (英额门镇), Nanshancheng (南山城镇), Nankouqian (南口前镇), Caoshi (草市镇), Xiajiabao (夏家堡镇), Wandianzi (湾甸子镇)
Townships:
- Tukouzi Township (土口子乡), Beisanjia Township (北三家乡), Aojiabao Township (敖家堡乡), Dasuhe Township (大苏河乡), Gounai Township (枸乃甸乡)
Geography and climate
Qingyuan is located in the north of Fushun City. It spans 41°48′−42°29′ N latitude and 124°20′−125°29′ E longitude. Bordering county-level divisions are as follows:
In Liaoning:
- Xinbin Manchu Autonomous County – south
- Fushun County – west
- Tieling County – west
- Xifeng County – north
- Kaiyuan – north
In Jilin:
- Dongfeng County – east
- Meihekou – east
- Liuhe County – east
Qingyuan has a monsoon-influenced humid continental climate (Köppen Dwa), characterised by hot, humid summers and long, cold and windy, but dry winters. The four seasons here are distinctive. Over 60% of the annual rainfall of 774 mm (30.5 in) occurs from June to August alone. The monthly 24-hour average temperature ranges from −14.6 °C (5.7 °F) in January to 23.1 °C (73.6 °F) in July, and the annual mean is 5.87 °C (42.6 °F). In winter, due to the elevation and normally dry climate, diurnal temperature variation regularly exceeds 15 °C (27 °F).
| Climate data for Qingyuan Manchu Autonomous County (1971−2000) | |||||||||||||
|---|---|---|---|---|---|---|---|---|---|---|---|---|---|
| Month | Jan | Feb | Mar | Apr | May | Jun | Jul | Aug | Sep | Oct | Nov | Dec | Year |
| Record high °C (°F) | 7.1 (44.8) |
15.5 (59.9) |
20.3 (68.5) |
30.2 (86.4) |
33.5 (92.3) |
36.7 (98.1) |
37.2 (99) |
37.1 (98.8) |
32.0 (89.6) |
29.8 (85.6) |
21.4 (70.5) |
11.5 (52.7) |
37.2 (99) |
| Average high °C (°F) | −5.9 (21.4) |
−1.8 (28.8) |
5.7 (42.3) |
15.8 (60.4) |
22.3 (72.1) |
26.5 (79.7) |
28.7 (83.7) |
27.9 (82.2) |
22.8 (73) |
15.3 (59.5) |
4.9 (40.8) |
−3.2 (26.2) |
13.2 (55.8) |
| Daily mean °C (°F) | −14.6 (5.7) |
−10.2 (13.6) |
−1.1 (30) |
8.1 (46.6) |
14.8 (58.6) |
19.9 (67.8) |
23.1 (73.6) |
21.8 (71.2) |
14.9 (58.8) |
7.0 (44.6) |
−2.4 (27.7) |
−10.9 (12.4) |
5.9 (42.6) |
| Average low °C (°F) | −21.4 (−6.5) |
−17 (1) |
−7.3 (18.9) |
1.1 (34) |
7.7 (45.9) |
14.0 (57.2) |
18.5 (65.3) |
17.1 (62.8) |
8.9 (48) |
0.7 (33.3) |
−7.8 (18) |
−16.9 (1.6) |
−0.2 (31.6) |
| Record low °C (°F) | −34.4 (−29.9) |
−32.6 (−26.7) |
−26.3 (−15.3) |
−13.2 (8.2) |
−4.5 (23.9) |
4.4 (39.9) |
9.2 (48.6) |
3.7 (38.7) |
−3.2 (26.2) |
−12.2 (10) |
−25.4 (−13.7) |
−33.2 (−27.8) |
−34.4 (−29.9) |
| Average precipitation mm (inches) | 7.1 (0.28) |
7.5 (0.295) |
19.3 (0.76) |
45.8 (1.803) |
64.3 (2.531) |
112.3 (4.421) |
197.3 (7.768) |
166.1 (6.539) |
71.2 (2.803) |
47.7 (1.878) |
23.9 (0.941) |
11.2 (0.441) |
773.7 (30.46) |
| Average precipitation days (≥ 0.1 mm) | 5.3 | 5.8 | 6.9 | 9.4 | 11.8 | 15.0 | 16.0 | 14.0 | 9.6 | 8.4 | 8.1 | 6.0 | 116.3 |
| Source: Weather China | |||||||||||||
References
External links
| Counties |
|    | ||||||||||
|---|---|---|---|---|---|---|---|---|---|---|---|---|
Ethnic minority autonomous areas: Dong · Hui · Korean · Manchu · Miao · Mongol · Tibetan · Tujia · Uyghur · Yao · Yi · Zhuang · Other | ||||||||||||