Quantitative structure–activity relationship
Quantitative structure–activity relationship models (QSAR models) are regression or classification models used in the chemical and biological sciences and engineering. Like other regression models, QSAR regression models relate a set of "predictor" variables (X) to the potency of the response variable (Y), while classification QSAR models relate the predictor variables to a categorical value of the response variable.
In QSAR modeling, the predictors consist of physico-chemical properties or theoretical molecular descriptors of chemicals; the QSAR response-variable could be a biological activity of the chemicals. QSAR models first summarize a supposed relationship between chemical structures and biological activity in a data-set of chemicals. Second, QSAR models predict the activities of new chemicals.
Related terms include quantitative structure–property relationships (QSPR) when a chemical property is modeled as the response variable.[1][2] "Different properties or behaviors of chemical molecules have been investigated in the field of QSPR. Some examples are quantitative structure–reactivity relationships (QSRRs), quantitative structure–chromatography relationships (QSCRs) and, quantitative structure–toxicity relationships (QSTRs), quantitative structure–electrochemistry relationships (QSERs), and, and quantitative structure–biodegradability relationships (QSBRs)." [3]
As an example, biological activity can be expressed quantitatively as the concentration of a substance required to give a certain biological response. Additionally, when physicochemical properties or structures are expressed by numbers, one can find a mathematical relationship, or quantitative structure-activity relationship, between the two. The mathematical expression, if carefully validated [4][5][6] can then be used to predict the modeled response of other chemical structures.[7]
A QSAR has the form of a mathematical model:
- Activity = f(physiochemical properties and/or structural properties) + error
The error includes model error (bias) and observational variability, that is, the variability in observations even on a correct model.
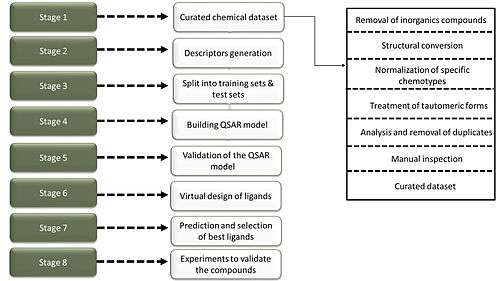
Essential steps in QSAR studies
Principal steps of QSAR/QSPR including (i) Selection of Data set and extraction of structural/empirical descriptors (ii) variable selection, (iii) model construction and (iv) validation evaluation. " [3]
SAR and the SAR paradox
The basic assumption for all molecule based hypotheses is that similar molecules have similar activities. This principle is also called Structure–Activity Relationship (SAR). The underlying problem is therefore how to define a small difference on a molecular level, since each kind of activity, e.g. reaction ability, biotransformation ability, solubility, target activity, and so on, might depend on another difference. Good examples were given in the bioisosterism reviews by Patanie/LaVoie[8] and Brown.[9]
In general, one is more interested in finding strong trends. Created hypotheses usually rely on a finite number of chemical data. Thus, the induction principle should be respected to avoid overfitted hypotheses and deriving overfitted and useless interpretations on structural/molecular data.
The SAR paradox refers to the fact that it is not the case that all similar molecules have similar activities.
Types
Fragment based (group contribution)
Analogously, the "partition coefficient"—a measurement of differential solubility and itself a component of QSAR predictions—can be predicted either by atomic methods (known as "XLogP" or "ALogP") or by chemical fragment methods (known as "CLogP" and other variations). It has been shown that the logP of compound can be determined by the sum of its fragments; fragment-based methods are generally accepted as better predictors than atomic-based methods.[10] Fragmentary values have been determined statistically, based on empirical data for known logP values. This method gives mixed results and is generally not trusted to have accuracy of more than ±0.1 units.[11]
Group or Fragment based QSAR is also known as GQSAR.[12] GQSAR allows flexibility to study various molecular fragments of interest in relation to the variation in biological response. The molecular fragments could be substituents at various substitution sites in congeneric set of molecules or could be on the basis of pre-defined chemical rules in case of non-congeneric sets. GQSAR also considers cross-terms fragment descriptors, which could be helpful in identification of key fragment interactions in determining variation of activity.[12] Lead discovery using Fragnomics is an emerging paradigm. In this context FB-QSAR proves to be a promising strategy for fragment library design and in fragment-to-lead identification endeavours.[13]
An advanced approach on fragment or group-based QSAR based on the concept of pharmacophore-similarity is developed.[14] This method, pharmacophore-similarity-based QSAR (PS-QSAR) uses topological pharmacophoric descriptors to develop QSAR models. This activity prediction may assist the contribution of certain pharmacophore features encoded by respective fragments toward activity improvement and/or detrimental effects.[14]
3D-QSAR
3D-QSAR refers to the application of force field calculations requiring three-dimensional structures, e.g. based on protein crystallography or molecule superimposition. It uses computed potentials, e.g. the Lennard-Jones potential, rather than experimental constants and is concerned with the overall molecule rather than a single substituent. It examines the steric fields (shape of the molecule), the hydrophobic regions (water-soluble surfaces),[15] and the electrostatic fields.[16]
The created data space is then usually reduced by a following feature extraction (see also dimensionality reduction). The following learning method can be any of the already mentioned machine learning methods, e.g. support vector machines.[17] An alternative approach uses multiple-instance learning by encoding molecules as sets of data instances, each of which represents a possible molecular conformation. A label or response is assigned to each set corresponding to the activity of the molecule, which is assumed to be determined by at least one instance in the set (i.e. some conformation of the molecule).[18]

On June 18, 2011 the Comparative Molecular Field Analysis (CoMFA) patent has dropped any restriction on the use of GRID and partial least-squares (PLS) technologies and the Rome Center for Molecular Design (RCMD) team (www.rcmd.it) has opened a 3D QSAR web server (www.3d-qsar.com) based on the 3-D QSAutogrid/R engine.[19]
GOLPE stands for Generating Optimal Linear PLS Estimations. 3-D QSAutogrid/R covers all the main features of CoMFA and GRID/GOLPE with implementation by multiprobe/multiregion variable selection (MPGRS) that improves the simplification of interpretation of the 3-D QSAR map. The methodology is based on the integration of the molecular interaction fields as calculated by AutoGrid and the R statistical environment that can be easily coupled with many free graphical molecular interfaces such as UCSF-Chimera, AutoDock Tools, JMol and others.
Chemical descriptor based
In this approach, descriptors quantifying various electronic, geometric, or steric properties of a molecule are computed and used to develop a QSAR.[20] This approach is different from the fragment (or group contribution) approach in that the descriptors are computed for the system as whole rather than from the properties of individual fragments. This approach is different from the 3D-QSAR approach in that the descriptors are computed from scalar quantities (e.g., energies, geometric parameters) rather than from 3D fields.
An example of this approach is the QSARs developed for olefin polymerization by half sandwich compounds.[21][22]
Modeling
In the literature it can be often found that chemists have a preference for partial least squares (PLS) methods, since it applies the feature extraction and induction in one step.
Data mining approach
Computer SAR models typically calculate a relatively large number of features. Because those lack structural interpretation ability, the preprocessing steps face a feature selection problem (i.e., which structural features should be interpreted to determine the structure-activity relationship). Feature selection can be accomplished by visual inspection (qualitative selection by a human); by data mining; or by molecule mining.
A typical data mining based prediction uses e.g. support vector machines, decision trees, neural networks for inducing a predictive learning model.
Molecule mining approaches, a special case of structured data mining approaches, apply a similarity matrix based prediction or an automatic fragmentation scheme into molecular substructures. Furthermore, there exist also approaches using maximum common subgraph searches or graph kernels.[23][24]
Matched molecular pair analysis
Typically QSAR models derived from non linear machine learning is seen as a "black box", which fails to guide medicinal chemists. Recently there is a relatively new concept of Matched molecular pair analysis or Prediction driven MMPA which is coupled with QSAR model in order to identify activity cliffs [25]
Evaluation of the quality of QSAR models
QSAR modeling produces predictive models derived from application of statistical tools correlating biological activity (including desirable therapeutic effect and undesirable side effects) or physico-chemical properties in QSPR models of chemicals (drugs/toxicants/environmental pollutants) with descriptors representative of molecular structure or properties. QSARs are being applied in many disciplines, for example: risk assessment, toxicity prediction, and regulatory decisions[26] in addition to drug discovery and lead optimization.[27] Obtaining a good quality QSAR model depends on many factors, such as the quality of input data, the choice of descriptors and statistical methods for modeling and for validation. Any QSAR modeling should ultimately lead to statistically robust and predictive models capable of making accurate and reliable predictions of the modeled response of new compounds.
For validation of QSAR models, usually various strategies are adopted:[28]
- internal validation or cross-validation (actually, while extracting data, cross validation is a measure of model robustness, the more a model is robust (higher q2) the less data extraction perturb the original model);
- external validation by splitting the available data set into training set for model development and prediction set for model predictivity check;
- blind external validation by application of model on new external data and
- data randomization or Y-scrambling for verifying the absence of chance correlation between the response and the modeling descriptors.
The success of any QSAR model depends on accuracy of the input data, selection of appropriate descriptors and statistical tools, and most importantly validation of the developed model. Validation is the process by which the reliability and relevance of a procedure are established for a specific purpose; for QSAR models validation must be mainly for robustness, prediction performances and applicability domain (AD) of the models.[4][5][6][29]
Some validation methodologies can be problematic. For example, leave one-out cross-validation generally leads to an overestimation of predictive capacity. Even with external validation, it is difficult to determine whether the selection of training and test sets was manipulated to maximize the predictive capacity of the model being published.
Different aspects of validation of QSAR models that need attention includes methods of selection of training set compounds,[30] setting training set size[31] and impact of variable selection[32] for training set models for determining the quality of prediction. Development of novel validation parameters for judging quality of QSAR models is also important.[6][33][34]
Application
Chemical
One of the first historical QSAR applications was to predict boiling points.[35]
It is well known for instance that within a particular family of chemical compounds, especially of organic chemistry, that there are strong correlations between structure and observed properties. A simple example is the relationship between the number of carbons in alkanes and their boiling points. There is a clear trend in the increase of boiling point with an increase in the number carbons, and this serves as a means for predicting the boiling points of higher alkanes.
A still very interesting application is the Hammett equation, Taft equation and pKa prediction methods.[36]
Biological
The biological activity of molecules is usually measured in assays to establish the level of inhibition of particular signal transduction or metabolic pathways. Drug discovery often involves the use of QSAR to identify chemical structures that could have good inhibitory effects on specific targets and have low toxicity (non-specific activity). Of special interest is the prediction of partition coefficient log P, which is an important measure used in identifying "druglikeness" according to Lipinski's Rule of Five.
While many quantitative structure activity relationship analyses involve the interactions of a family of molecules with an enzyme or receptor binding site, QSAR can also be used to study the interactions between the structural domains of proteins. Protein-protein interactions can be quantitatively analyzed for structural variations resulted from site-directed mutagenesis.[37]
It is part of the machine learning method to reduce the risk for a SAR paradox, especially taking into account that only a finite amount of data is available (see also MVUE). In general, all QSAR problems can be divided into coding[38] and learning.[39]
Applications
(Q)SAR models have been used for risk management. QSARS are suggested by regulatory authorities; in the European Union, QSARs are suggested by the REACH regulation, where "REACH" abbreviates "Registration, Evaluation, Authorisation and Restriction of Chemicals".
The chemical descriptor space whose convex hull is generated by a particular training set of chemicals is called the training set's applicability domain. Prediction of properties of novel chemicals that are located outside the applicability domain uses extrapolation, and so is less reliable (on average) than prediction within the applicability domain. The assessment of the reliability of QSAR predictions remains a research topic.
The QSAR equations can be used to predict biological activities of newer molecules before their synthesis.
Examples of machine learning tools for QSAR modeling include:[40]
| S.No. | Name | Algorithms | External link |
|---|---|---|---|
| 1. | R | RF,SVM, Naïve Bayesian, and ANN | "R: The R Project for Statistical Computing". |
| 2. | libSVM | SVM | "LIBSVM -- A Library for Support Vector Machines". |
| 3. | Orange | RF, SVM, and Naïve Bayesian | "Orange Data Mining". |
| 4. | RapidMiner | SVM, RF, Naïve Bayes, DT, ANN, and k-NN | "RapidMiner | #1 Open Source Predictive Analytics Platform". |
| 5. | Weka | RF, SVM, and Naïve Bayes | "Weka 3 - Data Mining with Open Source Machine Learning Software in Java". |
| 6. | Knime | DT, Naïve Bayes, and SVM | "KNIME | Open for Innovation". |
| 7. | AZOrange[41] | RT, SVM, ANN, and RF | "AZCompTox/AZOrange: AstraZeneca add-ons to Orange.". GitHub. |
| 8. | Tanagra | SVM, RF, Naïve Bayes, and DT | "TANAGRA - A free DATA MINING software for teaching and research". |
| 9. | Elki | k-NN | "ELKI Data Mining Framework". |
| 10. | MALLET | "MALLET homepage". | |
| 11. | MOA | "MOA Massive Online Analysis | Real Time Analytics for Data Streams". | |
See also
- ADME
- Matched molecular pair analysis
- Cheminformatics
- Computer-assisted drug design (CADD)
- Conformation Activity Relationship
- Differential solubility
- Molecular design software
- Partition coefficient
- Pharmacokinetics
- Pharmacophore
- QSAR & Combinatorial Science – Scientific journal
- Software for molecular mechanics modeling
- Chemicalize.org:List of predicted structure based properties
References
- ↑ Nantasenamat C, Isarankura-Na-Ayudhya C, Naenna T, Prachayasittikul V (2009). "A practical overview of quantitative structure-activity relationship". Excli J. 8: 74–88.
- ↑ Nantasenamat C, Isarankura-Na-Ayudhya C, Prachayasittikul V (Jul 2010). "Advances in computational methods to predict the biological activity of compounds". Expert Opinion on Drug Discovery. 5 (7): 633–54. doi:10.1517/17460441.2010.492827. PMID 22823204.
- 1 2 Yousefinejad S, Hemmateenejad B (2015). "Chemometrics tools in QSAR/QSPR studies: A historical perspective". Chemometrics and Intelligent Laboratory Systems. 149, Part B: 177–204. doi:10.1016/j.chemolab.2015.06.016.
- 1 2 Tropsha A, Gramatica P, Gombar VJ (2003). "The Importance of Being Earnest: Validation is the Absolute Essential for Successful Application and Interpretation of QSPR Models". QSAR &Comb. Sci. 22: 69–77. doi:10.1002/qsar.200390007.
- 1 2 Gramatica P (2007). "Principles of QSAR models validation: internal and external". QSAR &Comb. Sci. 26: 694–701. doi:10.1002/qsar.200610151.
- 1 2 3 Chirico N, Gramatica P (Aug 2012). "Real external predictivity of QSAR models. Part 2. New intercomparable thresholds for different validation criteria and the need for scatter plot inspection". Journal of Chemical Information and Modeling. 52 (8): 2044–58. doi:10.1021/ci300084j. PMID 22721530.
- ↑ Tropsha, Alexander (2010). "Best Practices for QSAR Model Development, Validation, and Exploitation". Molecular Informatics. 29 (6-7): 476–488. doi:10.1002/minf.201000061. ISSN 1868-1743.
- ↑ Patani GA, LaVoie EJ (Dec 1996). "Bioisosterism: A Rational Approach in Drug Design". Chemical Reviews. 96 (8): 3147–3176. doi:10.1021/cr950066q. PMID 11848856.
- ↑ Nathan Brown. Bioisosteres in Medicinal Chemistry. Wiley-VCH, 2012, p. 237. ISBN 978-3-527-33015-7
- ↑ Thompson SJ, Hattotuwagama CK, Holliday JD, Flower DR (2006). "On the hydrophobicity of peptides: Comparing empirical predictions of peptide log P values". Bioinformation. 1 (7): 237–41. doi:10.6026/97320630001237. PMC 1891704
 . PMID 17597897.
 - ↑ Wildman SA, Crippen GM (1999). "Prediction of physicochemical parameters by atomic contributions". J. Chem. Inf. Comput. Sci. 39 (5): 868–873. doi:10.1021/ci990307l.
- 1 2 Ajmani S, Jadhav K, Kulkarni SA. "Group-Based QSAR (G-QSAR)".
- ↑ Manoharan P, Vijayan RS, Ghoshal N (Oct 2010). "Rationalizing fragment based drug discovery for BACE1: insights from FB-QSAR, FB-QSSR, multi objective (MO-QSPR) and MIF studies". Journal of Computer-Aided Molecular Design. 24 (10): 843–64. Bibcode:2010JCAMD..24..843M. doi:10.1007/s10822-010-9378-9. PMID 20740315.
- 1 2 Prasanth Kumar S, Jasrai YT, Pandya HA, Rawal RM (November 2013). "Pharmacophore-similarity-based QSAR (PS-QSAR) for group-specific biological activity predictions". Journal of Biomolecular Structure & Dynamics. 33 (1): 56–69. doi:10.1080/07391102.2013.849618. PMID 24266725.
- ↑ Cheeseright T. "The Identification of Bioisosteres as Drug Development Candidates" (PDF). Cresset BioMolecular Discovery.
- ↑ Leach AR (2001). Molecular modelling: principles and applications. Englewood Cliffs, N.J: Prentice Hall. ISBN 0-582-38210-6.
- ↑ Vert JP, Schölkopf B, Tsuda K (2004). Kernel methods in computational biology. Cambridge, Mass: MIT Press. ISBN 0-262-19509-7.
- ↑ Dietterich TG, Lathrop RH, Lozano-Pérez T (1997). "Solving the multiple instance problem with axis-parallel rectangles". Artificial Intelligence. 89 (1–2): 31–71. doi:10.1016/S0004-3702(96)00034-3.
- ↑ Ballante F, Ragno R (Jun 2012). "3-D QSAutogrid/R: an alternative procedure to build 3-D QSAR models. Methodologies and applications". Journal of Chemical Information and Modeling. 52 (6): 1674–85. doi:10.1021/ci300123x. PMID 22643034.
- ↑ Caruthers JM, Lauterbach JA, Thomson KT, Venkatasubramanian V, Snively CM, Bhan A, Katare S, Oskarsdottir G (2003). "Catalyst design: knowledge extraction from high-throughput experimentation". J. Catal. 216: 3776–3777. doi:10.1016/S0021-9517(02)00036-2.
- ↑ Manz TA, Phomphrai K, Medvedev G, Krishnamurthy BB, Sharma S, Haq J, Novstrup KA, Thomson KT, Delgass WN, Caruthers JM, Abu-Omar MM (Apr 2007). "Structure-activity correlation in titanium single-site olefin polymerization catalysts containing mixed cyclopentadienyl/aryloxide ligation". Journal of the American Chemical Society. 129 (13): 3776–7. doi:10.1021/ja0640849. PMID 17348648.
- ↑ Manz TA, Caruthers JM, Sharma S, Phomphrai K, Thomson KT, Delgass WN, Abu-Omar MM (2012). "Structure–Activity Correlation for Relative Chain Initiation to Propagation Rates in Single-Site Olefin Polymerization Catalysis". Organometallics. 31 (2): 602–618. doi:10.1021/om200884x.
- ↑ Gusfield D (1997). Algorithms on strings, trees, and sequences: computer science and computational biology. Cambridge, UK: Cambridge University Press. ISBN 0-521-58519-8.
- ↑ Helma C (2005). Predictive toxicology. Washington, DC: Taylor & Francis. ISBN 0-8247-2397-X.
- ↑ http://www.jcheminf.com/content/6/1/48/
- ↑ Tong W, Hong H, Xie Q, Shi L, Fang H, Perkins R (April 2005). "Assessing QSAR Limitations – A Regulatory Perspective". Current Computer-Aided Drug Design. 1 (2): 195–205. doi:10.2174/1573409053585663.
- ↑ Dearden JC (2003). "In silico prediction of drug toxicity". Journal of Computer-Aided Molecular Design. 17 (2-4): 119–27. Bibcode:2003JCAMD..17..119D. doi:10.1023/A:1025361621494. PMID 13677480.
- ↑ Wold S, Eriksson L (1995). "Statistical validation of QSAR results". In Waterbeemd, Han van de. Chemometric methods in molecular design. Weinheim: VCH. pp. 309–318. ISBN 3-527-30044-9.
- ↑ Roy K (Dec 2007). "On some aspects of validation of predictive quantitative structure-activity relationship models". Expert Opinion on Drug Discovery. 2 (12): 1567–77. doi:10.1517/17460441.2.12.1567.
- ↑ Leonard JT, Roy K (2006). "On selection of training and test sets for the development of predictive QSAR models". QSAR & Combinatorial Science. 25 (3): 235–251. doi:10.1002/qsar.200510161.
- ↑ Roy PP, Leonard JT, Roy K (2008). "Exploring the impact of size of training sets for the development of predictive QSAR models". Chemometrics and Intelligent Laboratory Systems. 90 (1): 31–42. doi:10.1016/j.chemolab.2007.07.004.
- ↑ Put R, Vander Heyden Y (Oct 2007). "Review on modelling aspects in reversed-phase liquid chromatographic quantitative structure-retention relationships". Analytica Chimica Acta. 602 (2): 164–72. doi:10.1016/j.aca.2007.09.014. PMID 17933600.
- ↑ Pratim Roy P, Paul S, Mitra I, Roy K (2009). "On two novel parameters for validation of predictive QSAR models". Molecules. 14 (5): 1660–701. doi:10.3390/molecules14051660. PMID 19471190.
- ↑ Chirico N, Gramatica P (Sep 2011). "Real external predictivity of QSAR models: how to evaluate it? Comparison of different validation criteria and proposal of using the concordance correlation coefficient". Journal of Chemical Information and Modeling. 51 (9): 2320–35. doi:10.1021/ci200211n. PMID 21800825.
- ↑ Rouvray DH, Bonchev D (1991). Chemical graph theory: introduction and fundamentals. Tunbridge Wells, Kent, England: Abacus Press. ISBN 0-85626-454-7.
- ↑ Fraczkiewicz, R (2013). "In Silico Prediction of Ionization". In Reedijk, J. Reference Module in Chemistry, Molecular Sciences and Chemical Engineering [Online]. vol. 5. Amsterdam, The Netherlands: Elsevier. doi:10.1016/B978-0-12-409547-2.02610-X.
- ↑ Freyhult EK, Andersson K, Gustafsson MG (Apr 2003). "Structural modeling extends QSAR analysis of antibody-lysozyme interactions to 3D-QSAR". Biophysical Journal. 84 (4): 2264–72. Bibcode:2003BpJ....84.2264F. doi:10.1016/S0006-3495(03)75032-2. PMC 1302793. PMID 12668435.
- ↑ Timmerman H, Todeschini R, Consonni V, Mannhold R, Kubinyi H (2002). Handbook of Molecular Descriptors. Weinheim: Wiley-VCH. ISBN 3-527-29913-0.
- ↑ Duda RO, Hart PW, Stork DG (2001). Pattern classification. Chichester: John Wiley & Sons. ISBN 0-471-05669-3.
- ↑ Lavecchia A (Mar 2015). "Machine-learning approaches in drug discovery: methods and applications". Drug Discovery Today. 20 (3): 318–31. doi:10.1016/j.drudis.2014.10.012. PMID 25448759.
- ↑ Stålring JC, Carlsson LA, Almeida P, Boyer S (2011). "AZOrange - High performance open source machine learning for QSAR modeling in a graphical programming environment". Journal of Cheminformatics. 3: 28. doi:10.1186/1758-2946-3-28. PMC 3158423. PMID 21798025.
Further reading
- Selassie CD (2003). "History of Quantitative Structure-Activity Relationships" (PDF). In Abraham DJ. Burger's medicinal Chemistry and Drug Discovery. 1 (6th ed.). New York: Wiley. pp. 1–48. ISBN 0-471-27401-1.
- Shityakov S, Puskás I, Roewer N, Förster C, Broscheit J (2014). "Three-dimensional quantitative structure-activity relationship and docking studies in a series of anthocyanin derivatives as cytochrome P450 3A4 inhibitors". Advances and Applications in Bioinformatics and Chemistry. 7: 11–21. doi:10.2147/AABC.S56478. PMC 3970920. PMID 24741320.
External links
- "The Cheminformatics and QSAR Society". Retrieved 2009-05-11.
- "The 3D QSAR Server". Retrieved 2011-06-18.
- "Nature Protocols: Development of QSAR models using C-QSAR program". Nature Protocols. doi:10.1038/nprot.2007.125. Retrieved 2009-05-11.
A regression program that has dual databases of over 21,000 QSAR models
- "QSAR World". Retrieved 2009-05-11.
A comprehensive web resource for QSAR modelers
- Chemoinformatics Tools, Drug Theoretics and Cheminformatics Laboratory