Public opinion of same-sex marriage in the United States
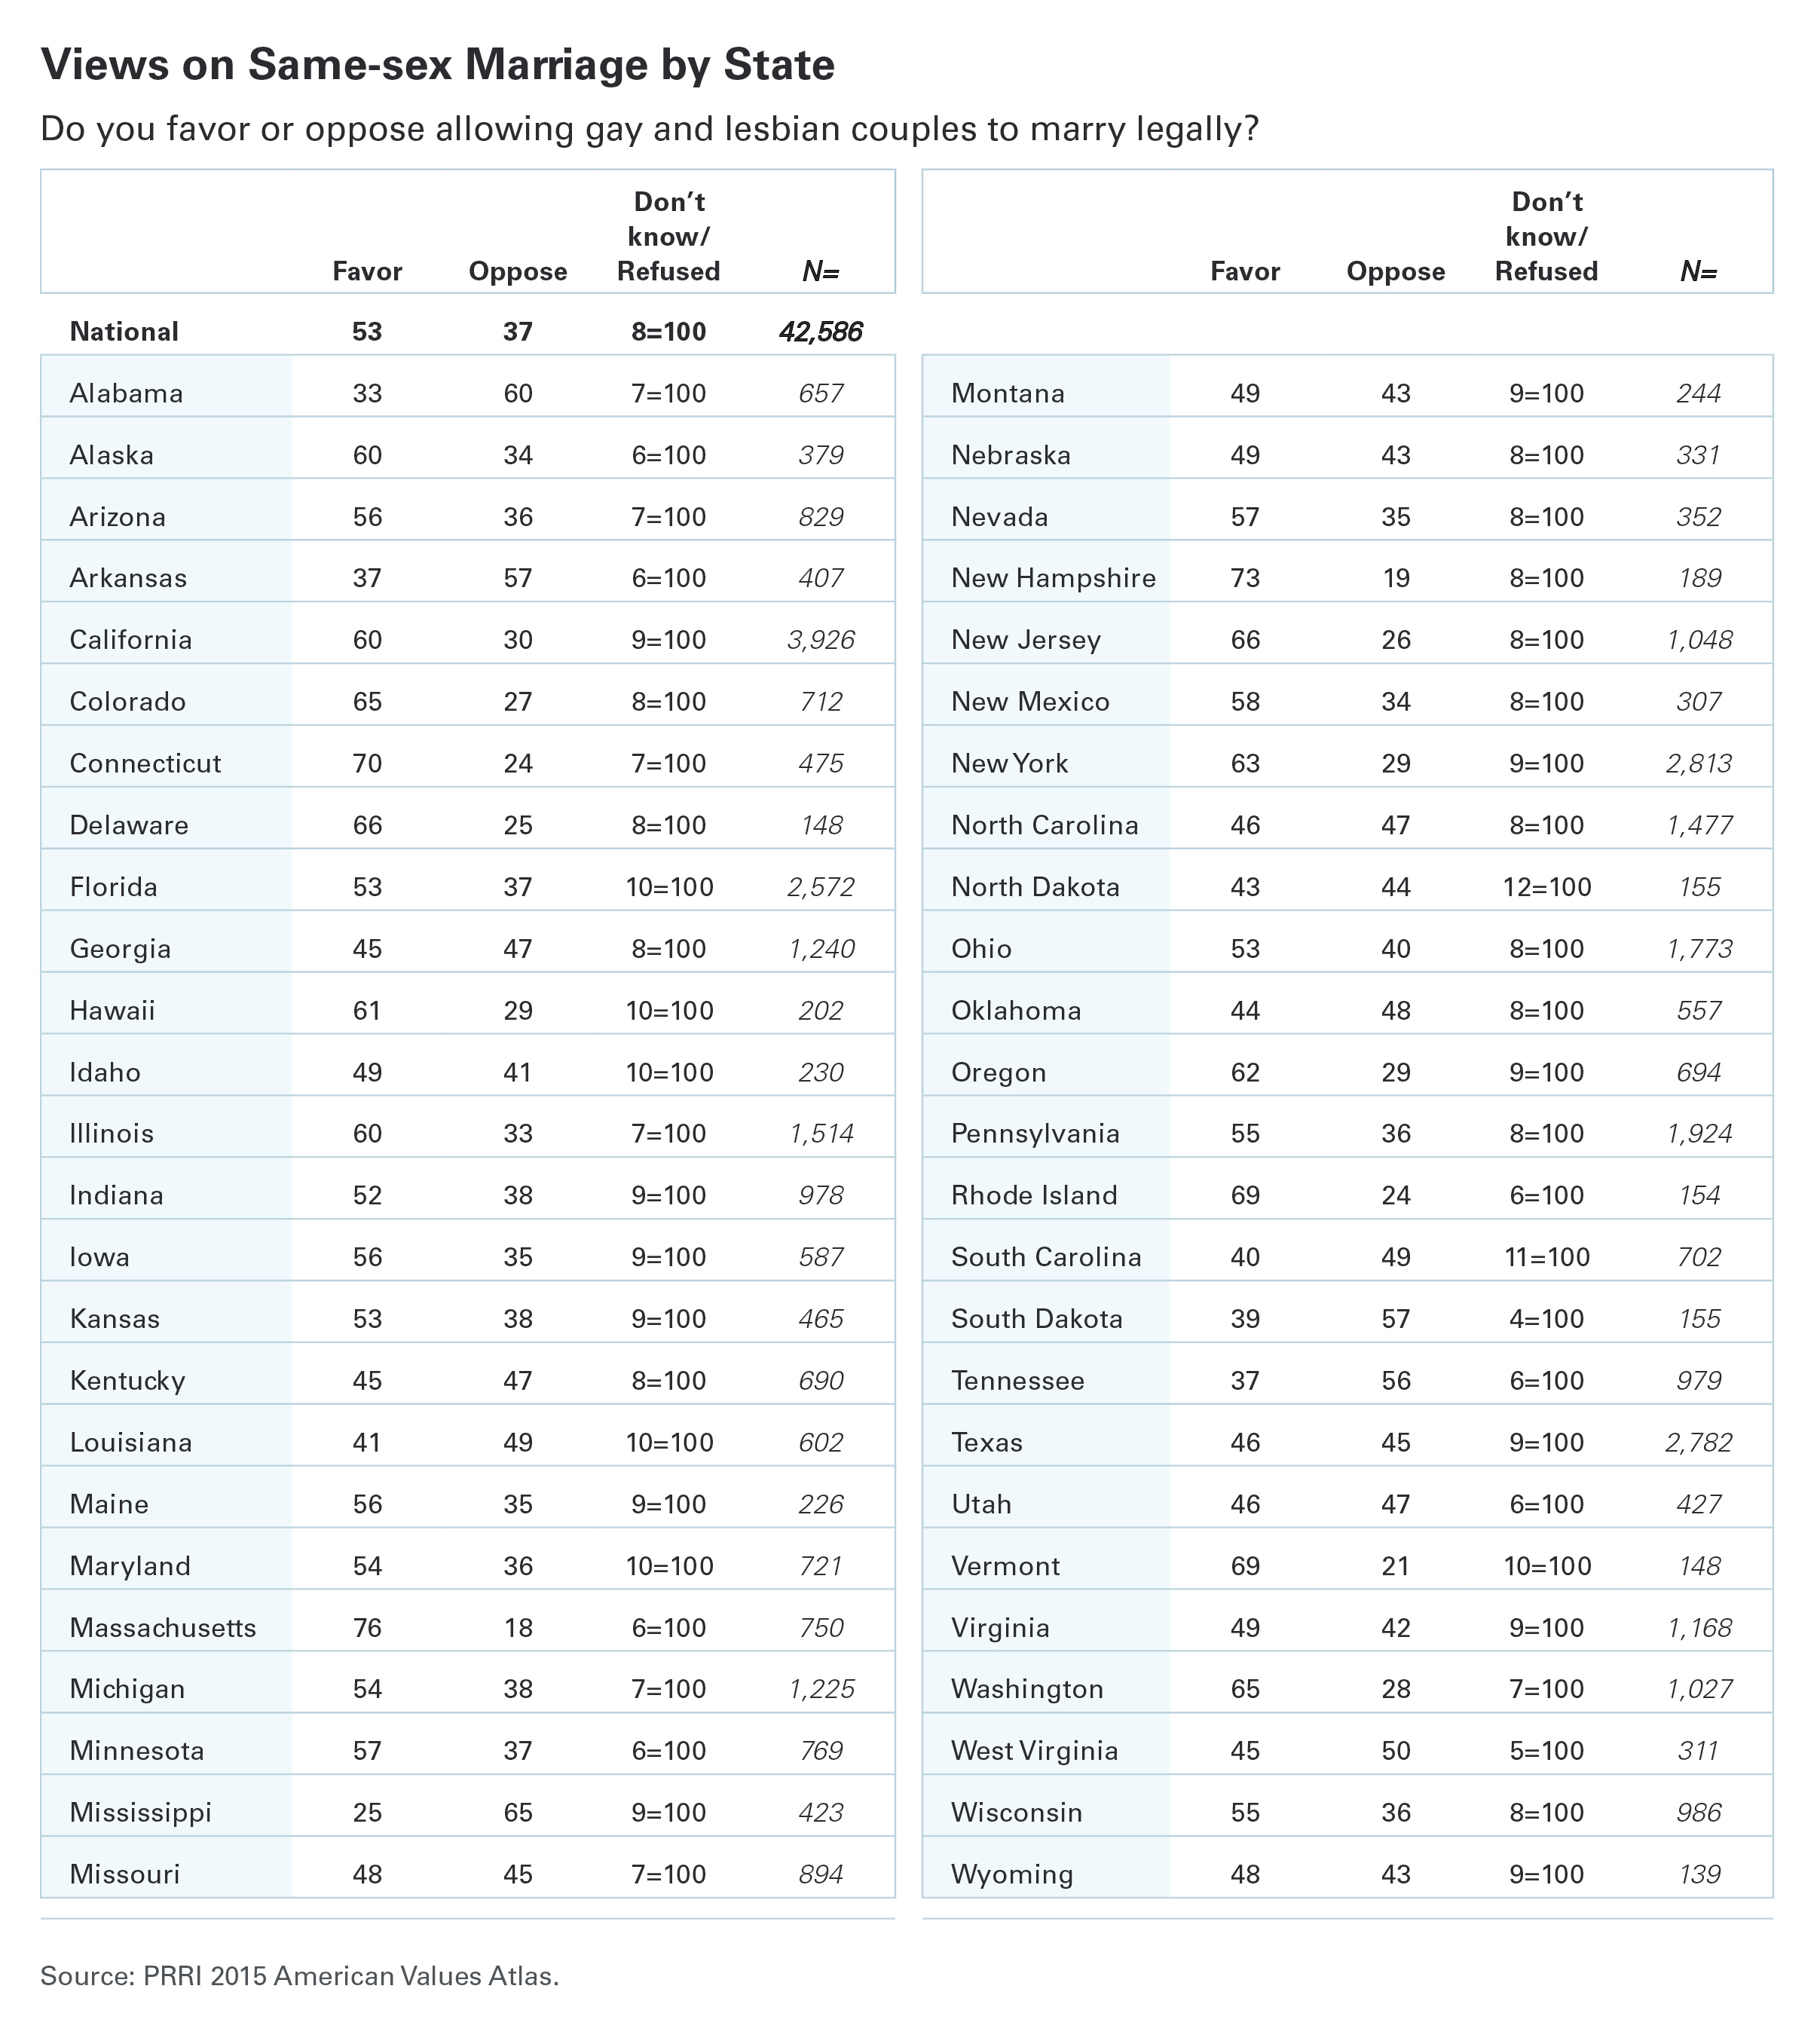
Public opinion in the United States shows majority support for the legal recognition of same-sex marriage. This support has remained above 50% consistently in opinion polls since 2010,[1] after having increased steadily for more than a decade.[2][3][4][5] An August 2010 CNN poll became the first national poll to show majority support for same-sex marriage,[6] with nearly all subsequent polls showing majority support.[7][8] Opposition to same-sex marriage still retains a majority of support in the following: Conservatives,[9] people who agree with the Tea Party movement,[9] people with religious beliefs conflicting with homosexuality,[9] people who attend religious services at least weekly,[9] Protestants,[9] members of the Republican Party,[9] the Silent Generation,[9] people living in the South Central United States (AL, AR, KY, LA, MS, OK, TN, and TX combined).[9] and the states of Alabama,[10] Arkansas,[10] Mississippi,[10] South Dakota,[10] and Tennessee.[10]
National polls
Post-Obergefell v. Hodges
A May 2016 Gallup poll found 61% of Americans support same-sex marriage, 37% oppose, and 2% have no opinion.[11]
A July 2015 Quinnipiac University Poll found 53% of American voters support same-sex marriage, 40% oppose, and 7% don't know/no answer. Asked specifically about Obergefell v. Hodges, it found 53% of American voters support the ruling, 44% oppose, and 3% don't know/no answer. It also found that American voters opposed a constitutional amendment allowing states to ban same-sex marriage, with 56% opposing, 39% supporting, and 5% don't know/no answer.[12]
A July 2015 Associated Press-GfK poll found that 42% support same-sex marriage and 40% oppose it. The percentage saying they favor legal same-sex marriage in their state was down slightly from the 48 percent who said so in an April poll. In January, 44 percent were in favor. Asked specifically about the Supreme Court ruling, 39 percent said they approve and 41 percent said they disapprove.[13]
Pre-Obergefell v. Hodges
A February–March 2015 Wall Street Journal poll found that 59% of Americans favor same-sex marriage.[14]
A January–February 2015 Human Rights Campaign poll found that 60% of Americans favor same-sex marriage, while 37% oppose. The same poll also found that 46% of respondents say they know a same-sex couple who have gotten married.[15]
A February 12–15, 2015 CNN/ORC poll found that 63% of Americans believe same-sex marriage is a constitutional right, while 36% oppose.[16]
A September–October 2014 YouGov poll found 48% of Americans favor same-sex marriage, 39% oppose, and 13% weren't sure.[17]
A Pew Research Center poll released in September 2014 found 49% of Americans favor same-sex marriage, 41% oppose, and 10% don't know.[18]
A Gallup poll conducted in May 2014 found that 55% of Americans support allowing marriage for same-sex couples, 42% opposed, and 4% had no opinion on the issue. This was the largest percentage ever measured by the organization.[19]
An April 2014 Public Religion Research Institute poll sponsored by the Ford Foundation found that 55% of all Americans supported same-sex marriage, while 39% were opposed.[20]
A Pew Research Center poll released in March 2014 found 54% of Americans favor same-sex marriage, 39% oppose, and 7% don't know.[21] It also researched support for same-sex marriage among Republican leaning voters in the United States. 61% of Republican leaning voters aged 18–29 support allowing same-sex couples to marry, while only 27% of Republican leaning voters over 50 years of age are supportive.[22] 52% of Republican voters aged 18–50 support same-sex marriage.[23][24]
A Washington Post/ABC News poll from February–March 2014 found a record high of 59% of Americans approve of same-sex marriage, with only 34% opposed and 7% with no opinion. The poll also revealed that 53% of the population in the States that currently do not allow same-sex couples to marry approve of same-sex marriage. 50% of respondents said that the United States Constitution guarantees the freedom to marry the person of one's choice, regardless of that persons's sex or sexual orientation. 41% disagreed, and 9% had no opinion.[25] The same poll also found that 81% of people found that businesses should not be allowed to refuse to serve gays and lesbians. 16% disagreed, and 3% had no opinion. 78% thought that gay couples can be "just as good parents" as straight couples, while 18% disagreed and 4% had no opinion.[26]
A November/December 2013 Public Religion Research Institute poll sponsored by the Ford Foundation found that 53% of all Americans supported same-sex marriage, while 41% were opposed and 6% unsure. The margin of error was 1.1%. The same poll found clear majorities in favor of same-sex marriage in the Northeast (60%), West (58%), and Midwest (51%). Only the South was evenly divided 48% in favor to 48% opposed. Further, nearly 7-in-10 (69%) of those born after 1980 (ages 18–33) favored allowing same-sex couples to marry.[27]
A Bloomberg National Poll conducted by Selzer & Company taken during September 20–23, 2013 found that 55% supported same-sex marriage, while 36% opposed and 9% unsure.[28]
A September Quinnipiac University poll found that 56% of American adults and 57% of registered voters supported same-sex marriage. Only 36% of both groups were opposed.[29]
A July 10–14 poll by Gallup found support for same-sex marriage at 54%, a record high, and double the support of 27% Gallup first measured when the question was asked in 1996.[30]
A July poll by USA Today found that 55% of Americans supported same-sex marriage while 40% did not.[31]
A May 9 Washington Post-ABC News poll found that 55% of Americans supported same-sex marriage while 40% did not.[32]
A March 20–24 CBS News Poll found that 53% of Americans supported same-sex marriage, 39% opposed it, and 8% were undecided.[33] The same poll also found that 33% of Americans who thought same-sex couples should be allowed to legally marry said they once held the opposite view and had changed their opinion.
A March 7–10 Washington Post-ABC News[34] poll found that 58% of Americans support same-sex marriage while 36% opposed. The poll indicated that 52% of GOP-leaning independents under 50 years old supported same-sex marriage.[35]
A March Quinnipiac University poll of voters found 47% supported same-sex marriage and 43% were opposed.[36]
Public support in the United States for same-sex marriage solidified, as polls consistently showed that same-sex marriage enjoys majority support with increasing tendency.
A November 26–29 Gallup poll found that 53% of Americans support same-sex marriage while 46% do not.[37]
A November 16–19 CBS News poll found that 51% of Americans support same-sex marriage while 40% do not.[38]
A November 7–11 ABC News/Washington Post poll found 51% of respondents support same-sex marriage while 47% are opposed.[39]
A June 6 CNN/ORC International poll showed that a majority of Americans support same-sex marriage being legalized at 54%, while 42% are opposed.[40]
A May 22 NBC News/Wall Street Journal poll showed that 54% of Americans would support a law in their state making same-sex marriage legal, with 40% opposed.[41]
A May 17–20 ABC News/Washington Post poll showed that 53% believe same-sex marriage should be legal, with only 39% opposed, a low point for opposition in any national poll so far.[42][43]
A May 10 USA Today/Gallup Poll, taken one day after Barack Obama became the first sitting President to express support for same-sex marriage,[44] showed 51% of Americans agreed with the President's endorsement, while 45% disagreed.[45] A May 8 Gallup Poll showed plurality support for same-sex marriage nationwide, with 50% in favor and 48% opposed.[46]
An April Pew Research Center poll showed support for same-sex marriage at 48%, while opposition fell to 44%.[47]
A March 7–10 ABC News/Washington Post poll found 52% of adults thought it should be legal for same-sex couples to get married, while 42% disagreed and 5% were unsure.[28] A March survey by the Public Religion Research Institute found 52% of Americans supported allowing same-sex couples to marry, while 44% opposed.[48]
A February 29 – March 3 NBC News/Wall Street Journal poll found 49% of adults supported allowing same-sex couples to marry, while 40% opposed.[49]
Public support for same-sex marriage continued to grow in 2011. In February and March, a Pew Research Center for the People & the Press survey found about as many adults favored (45%) as opposed (46%) allowing same-sex couples to marry legally, compared to a 2009 Pew Research survey that found just 37% backed same-sex marriage while 54% opposed.[50] In March and April, polls by Gallup,[51] ABC News/Washington Post,[8] and CNN/Opinion Research[52] all showed that a majority of Americans approved of same-sex marriage.
As had been the case since 1996, there remained a wide partisan division. In March, Pew reported that 57% of Democrats favored legal recognition for same-sex marriage, and 51% of independents agreed, but only 23% of Republicans agreed.[50] An April CNN/Opinion Research Poll showed majority support including 64% of Democrats and 55% of independents, but only 27% of Republicans.[52]
In March 2011, Democracy Corps conducted a survey of 1,000 likely 2012 election voters in 50 congressional districts considered political battlegrounds. It asked respondents to rate their feelings on the same-sex marriage issue on a 0–100 scale, with 100 being "very warm" or favorable feelings, and 0 being "very cold" or unfavorable feelings. 42% were on the "cool" or unfavorable side, and 35% were on the "warm" or favorable side.[53]
A May 2011 Gallup Poll also showed majority support for same-sex marriage, 53% in favor to 45% opposed. Gallup measured a 9-point increase in support, from 44% to 53%, indicating that support increased faster than in any previous year.[51]
In 2010, national polls began to show majority support for same-sex marriage.
An August Associated Press/National Constitution Center poll found 52% agreed that the federal government should give legal recognition to marriages between couples of the same sex, an increase from 46% in 2009. 46% disagreed, compared to 53% in 2009.[7]
An August CNN/Opinion Research Poll showed that 49% of respondents thought gays and lesbians do have a constitutional right to get married and have their marriage recognized by law as valid, and 52% thought gays and lesbians should have that right.[54]
Earlier polls in February and May found opinion divided within the margin of error, but with a consistent trend of increasing support and decreasing opposition compared to prior years.[55][56] One August poll found majority opposition,[57][58] and a November exit poll of 17,504 voters by CNN during the 2010 midterm elections found 53% opposition with 41% support.[59]
An April 30, 2009 ABC News/Washington Post poll found support for allowing same-sex couples to marry in the United States ahead of opposition for the first time: 49% support, 46% opposition, and 5% with no opinion. In addition, 53% believed that same-sex marriages performed in other states should be legal in their states. 62% of Democrats and 52% of Independents supported same-sex marriage, while 74% of Republicans opposed.[60]
An April 22–26, 2009, poll by CBS/New York Times found 42% supported marriage for same-sex couples, 25% supported civil unions, and 28% opposed any legal recognition of same-sex couples.[61] 5% of respondents were unsure.
A USA Today/Gallup Poll conducted May 7–10, 2009, however, found support at only 40%, lower than in 2003, with 57% opposed.[62] According to this poll, 48% of Americans feel that society would change for the worse if same-sex marriage were legalized, the same percentage as a 2003 poll.[63] The poll asked: "Which comes closest to your view? Gay couples should be allowed to legally marry. OR, Gay couples should be allowed to form civil unions but not legally marry. OR, There should be no legal recognition of a gay couple's relationship."
| Legal Marriage | Civil Unions | No Legal Recognition | Unsure | |
|---|---|---|---|---|
| All respondents | 42% | 25% | 28% | 5% |
| Republicans | 18% | 31% | 49% | 2% |
| Democrats | 52% | 22% | 21% | 5% |
| Independents | 43% | 26% | 25% | 6% |
A CBS News poll conducted from March 12–26, 2009[64] asked: "Which comes closest to your view? Gay couples should be allowed to legally marry. OR, Gay couples should be allowed to form civil unions but not legally marry. OR, There should be no legal recognition of a gay couple's relationship."
| Legal marriage | Civil union | No recognition | Unsure | |
|---|---|---|---|---|
| All political parties | 33% | 27% | 35% | 5% |
| Republicans | 6% | 34% | 59% | 1% |
| Democrats | 46% | 23% | 26% | 5% |
| Independents | 37% | 26% | 30% | 7% |
Nate Silver noted that the discrepancy in support for same-sex marriage appears to result from 5-10% of respondents who favor civil unions over same-sex marriage, but given only two choices, will support same-sex marriage.[65]
A LifeWay Research poll conducted in August 2009 found that 61% of Americans born between 1980 and 1991 see nothing wrong with two people of the same gender getting married while 39% disagree. The survey was conducted on a demographically representative survey of 1,200 U.S. adults between 18 and 29 years old.[66]
In a poll conducted on July 17, 2008, by the Quinnipiac University Polling Institute, with 55 percent opposed, and 36 percent in favor.[67] An ABC News poll found that the majority (58%) of Americans remained opposed to same-sex marriages, while the minority (36%) support them. However, on the question of a constitutional amendment, more are now opposed than for it. The majority (51%) of Americans say the issue should be left for the states to decide, while 43% would agree with amending the Constitution.[68]
When asked about the legal status, a July 2008 poll by Quinnipiac University Polling Institute revealed that 32% of respondents would allow homosexual partners to legally marry, 33% would permit them to form civil unions, and 29% would grant them no legal recognition.[67][69] A December 2008 poll revealed that 32% of respondents support the concept of civil unions, 31% would offer full marriage rights to same-sex couples, and 30% oppose any legal recognition for gay and lesbian partnerships.[70]
Prior to this poll, Gallup conducted a poll on the issue through May 2006. The poll found opposition to same-sex marriage had fallen slightly, as other polls found a sharper dip. In the poll, when asked if marriages between homosexuals should be recognized by law as valid, with the same rights as traditional marriages, 58% (down 1 point from Aug 2005, and 9 points from March 1996) of Americans responded that they should not be recognized. 39% (up 2 points from Aug 2005, and 12 points from 1996) felt same-sex marriages should be recognized by law. If "homosexuals" is replaced with "same-sex couples", 42% back same-sex marriage while 56% oppose it.
A similar poll conducted in March 2006, a Princeton Survey Research Associates/Pew Research Center poll concluded 39% of Americans support same-sex marriage, while 51% oppose it, and 10% were undecided. In December 2004, a poll by the same company found 61% of Americans opposed – with 38% "strongly opposed". Now, less than 2 years later, just 23% are "strongly opposed". However, an identical poll taken by the same group in June 2006 found a rise in those opposed to same-sex marriage, with 56% disapproving of the practice.
The most recent poll prior to this also showed opposition to same-sex marriages had fallen. An Opinion Dynamics/Fox News poll released April 6 of 2006. According to this poll, 55% of Americans oppose same-sex marriage, 33% support it, and 11% are unsure of where they stand.

Gallup Poll (known as the "CNN/USA Today/Gallup Poll" before 2006) of adults nationwide.
"Do you think marriages between same-sex couples should or should not be recognized by the law as valid, with the same rights as traditional marriages?" (Wording pre-2006: "Do you think marriages between homosexuals should or should not be recognized by the law as valid, with the same rights as traditional marriages?") N=492, MoE ± 5 (Form A)
In the following table, "Y" means "Should Be Valid"; "N" means "Should Not Be Valid"; and "U" means "Unsure".
| Poll Date | Y | N | U |
|---|---|---|---|
| 5/3 – 5/6/2012 | 50 | 48 | 2 |
| 5/5 – 5/8/2011 | 53 | 45 | 3 |
| 5/2 – 5/6/2010 | 44 | 53 | 3 |
| 5/7 – 5/10-2009 | 40 | 57 | 3 |
| 5/8 – 5/11/2008 | 40 | 56 | 4 |
| 5/10 – 5/13/2007 | 46 | 53 | 1 |
| 5/8 – 5/11/2006 | 42 | 56 | 2 |
| 4/29 – 5/1/2005 | 39 | 56 | 5 |
| 3/18 – 3/20/2005 | 28 | 68 | 4 |
| 7/19 – 7/21/2004 | 32 | 62 | 6 |
| 3/5 – 3/7/2004 | 33 | 61 | 6 |
| 2/16 – 2/17/2004 | 32 | 64 | 4 |
| 2/6 – 2/8/2004 | 36 | 59 | 5 |
| 12/2003 | 31 | 65 | 4 |
| 10/2003 | 35 | 61 | 4 |
| 6/2003 | 39 | 55 | 6 |
| 1/2000 | 34 | 62 | 4 |
| 2/1999 | 35 | 62 | 3 |
| 3/1996 | 27 | 68 | 5 |
A poll taken June 22, 2006 by Rasmussen Reports asked "Should marriage be defined in terms of a union between a man and a woman? Or should marriage be defined as a union between any two people including same sex couples?" 68% replied that "marriage is between man and woman", 29% said marriage "between any two people" and 4% were "not sure".[71]
CBS News poll historical results[64] asking:
- "Which comes closest to your view? Gay couples should be allowed to legally marry. OR, Gay couples should be allowed to form civil unions but not legally marry. OR, There should be no legal recognition of a gay couple's relationship."
| Legal marriage | Civil union | No recognition | Unsure | |
|---|---|---|---|---|
| August 20–24, 2010 | 40% | 30% | 25% | 5% |
| April 5–12, 2010 | 39% | 24% | 30% | 7% |
| June 12–16, 2009 | 33% | 30% | 32% | 5% |
| April 22–26, 2009 | 42% | 25% | 28% | 5% |
| March 12–26, 2009 | 33% | 27% | 35% | 5% |
| May 30 – June 3, 2008 | 30% | 28% | 36% | 6% |
| March 7–11, 2007 | 28% | 32% | 35% | 5% |
| October 27–31, 2006 | 28% | 29% | 38% | 5% |
| February 24–28, 2005 | 23% | 34% | 41% | 2% |
| November 18–21, 2004 | 21% | 32% | 44% | 3% |
| July 11–15, 2004 | 28% | 31% | 38% | 3% |
| May 20–23, 2004 | 28% | 29% | 40% | 3% |
| March 10–14, 2004 | 22% | 33% | 40% | 5% |
- The same CBS News Poll highlighting regional, political party affiliations and age differences in views. March 12–16, 2009. Nationwide:
| Demographic | Marriage | Civil union | No recognition |
|---|---|---|---|
| All | 33% | 27% | 25% |
| Republicans | 6% | 34% | 59% |
| Democrats | 46% | 23% | 26% |
| Independents | 37% | 26% | 30% |
| 18–45 years | 41% | 23% | 32% |
| 45–64 | 29% | 32% | 35% |
| 65 and older | 26% | 29% | 41% |
| 65 & older | 18% | 27% | 47% |
| Men | 27% | 28% | 42% |
| Women | 38% | 26% | 30% |
The Pew Research Center/Pew Forum on Religion & Public Life survey poll[64] asking:
- "Do you strongly favor, favor, oppose, or strongly oppose allowing gays and lesbians to marry legally?" (Margin of error three percent)
| Date | Favor | Oppose | Unsure |
|---|---|---|---|
| April 4–15, 2012[72][73] | 47% | 43% | 10% |
| February 22–March 14, 2011[74] | 45% | 46% | 9% |
| July 21–August 5, 2010[74] | 42% | 48% | 10% |
| July 9, 2009[74] | 37% | 54% | 9% |
| May 21–25, 2008[74] | 38% | 49% | 13% |
| August 2007 | 36% | 55% | 9% |
| March 8–12, 2006[75] | 39% | 51% | 10% |
| July 13–17, 2005 | 36% | 53% | 11% |
| December 1–16, 2004 | 32% | 61% | 7% |
| August 5–10, 2004 | 29% | 60% | 11% |
| July 2004 | 32% | 56% | 12% |
| March 2004 | 32% | 59% | 9% |
| February 2004 | 30% | 63% | 7% |
| October 2004 | 30% | 58% | 12% |
| November 2003 | 30% | 62% | 8% |
- "Do you strongly favor, oppose, or strongly oppose allowing gay and lesbian couples to enter into legal agreements with each other that would give them many of the same rights as married couples? (Margin of error three percent)
| Date | Favor | Oppose | Unsure |
|---|---|---|---|
| July 13–17, 2005 | 53% | 40% | 7% |
| August 5–10, 2004 | 48% | 45% | 7% |
| July 2004 | 49% | 43% | 8% |
| March 2004 | 49% | 44% | 7% |
| October 2003 | 45% | 47% | 8% |
A further Pew study in March 2006 found that 51% oppose same-sex marriage, with 39% supporting it, and the level of "strongly opposing" same-sex marriage has fallen from 42% to 28%.[75] Pew's May 2008 Survey found that for the first time, a majority of people do not oppose same-sex marriage at 49%. 20% oppose and 29% Strongly oppose same-sex marriage, up 1% from the March 2006 Pew Research Results.[74]
An October 1989 Yankelovich Clancy Shulman telephone poll found 69% of Americans opposed same-sex marriage, with 23% supporting same-sex marriage, and 8% not sure.[76]
Demographic differences
By age
| Age group | % support (at 95% confidence level) |
% opposition (at 95% confidence level) |
% no opinion / don't know / refused (at 95% confidence level) |
Sample size | Date of poll | |||
|---|---|---|---|---|---|---|---|---|
| 18–26 years old (Younger Millennial)[9] | 76 | |
22 | |
2 | |
209 | 5/12/2015 – 5/18/2015 |
| 18–29 years old[9] | 76 | |
22 | |
2 | |
319 | 5/12/2015 – 5/18/2015 |
| 18–34 years old (Millennial)[9] | 73 ± 5.3 | |
24 ± 5.3 | |
3 ± 5.3 | |
452 | 5/12/2015 – 5/18/2015 |
| 18–39 years old[77] | 74 | |
24 | |
2 | |
4/16/2015 – 4/20/2015 | |
| 18–49 years old[9] | 67 | |
31 | |
2 | |
865 | 5/12/2015 – 5/18/2015 |
| 27–34 years old (Older Millennial)[9] | 71 | |
26 | |
4 | |
243 | 5/12/2015 – 5/18/2015 |
| 30–49 years old[9] | 61 | |
36 | |
2 | |
546 | 5/12/2015 – 5/18/2015 |
| 35–42 years old (Younger Gen Xer)[9] | 62 | |
36 | |
2 | |
215 | 5/12/2015 – 5/18/2015 |
| 35–50 years old (Generation X)[9] | 59 ± 5.2 | |
39 ± 5.2 | |
2 ± 5.2 | |
469 | 5/12/2015 – 5/18/2015 |
| 40–64 years old[77] | 56 | |
39 | |
5 | |
4/16/2015 – 4/20/2015 | |
| 43–50 years old (Older Gen Xer)[9] | 56 | |
41 | |
3 | |
254 | 5/12/2015 – 5/18/2015 |
| 50–64 years old[9] | 47 | |
46 | |
7 | |
576 | 5/12/2015 – 5/18/2015 |
| 50+ years old[9] | 44 | |
48 | |
8 | |
1113 | 5/12/2015 – 5/18/2015 |
| 51–59 years old (Younger Boomer)[9] | 43 | |
51 | |
7 | |
307 | 5/12/2015 – 5/18/2015 |
| 51–69 years old (Baby-Boomer)[9] | 45 ± 4.2 | |
48 ± 4.2 | |
7 ± 4.2 | |
710 | 5/12/2015 – 5/18/2015 |
| 60–69 years old (Older Boomer)[9] | 48 | |
45 | |
7 | |
403 | 5/12/2015 – 5/18/2015 |
| 65+ years old[9] (cf. other poll) | 41 | |
51 | |
8 | |
537 | 5/12/2015 – 5/18/2015 |
| 65+ years old[77] (cf. other poll) | 46 | |
49 | |
5 | |
4/16/2015 – 4/20/2015 | |
| 70–79 years old (Younger Silent)[9] | 42 | |
52 | |
6 | |
234 | 5/12/2015 – 5/18/2015 |
| 70–87 years old (Silent)[9] | 39 ± 6.2 | |
53 ± 6.2 | |
8 ± 6.2 | |
325 | 5/12/2015 – 5/18/2015 |
| Dem/Dem leaning Baby-Boomer[9] | 60 | |
34 | |
7 | |
329 | 5/12/2015 – 5/18/2015 |
| Dem/Dem leaning Generation X[9] | 71 | |
27 | |
1 | |
239 | 5/12/2015 – 5/18/2015 |
| Dem/Dem leaning Millennial[9] | 82 | |
16 | |
2 | |
239 | 5/12/2015 – 5/18/2015 |
| Dem/Dem leaning Silent[9] | 54 | |
34 | |
12 | |
147 | 5/12/2015 – 5/18/2015 |
| Rep/Rep leaning Baby-Boomer[9] | 31 | |
62 | |
6 | |
330 | 5/12/2015 – 5/18/2015 |
| Rep/Rep leaning Generation X[9] | 45 | |
54 | |
1 | |
179 | 5/12/2015 – 5/18/2015 |
| Rep/Rep leaning Millennial[9] | 59 | |
39 | |
2 | |
154 | 5/12/2015 – 5/18/2015 |
| Rep/Rep leaning Silent[9] | 24 | |
72 | |
4 | |
152 | 5/12/2015 – 5/18/2015 |
| White 18-49 year olds[9] | 71 | |
27 | |
1 | |
517 | 5/12/2015 – 5/18/2015 |
| White 50+ year olds[9] | 48 | |
46 | |
6 | |
869 | 5/12/2015 – 5/18/2015 |
By education
| Education | % support (at 95% confidence level) |
% opposition (at 95% confidence level) |
% no opinion / don't know / refused (at 95% confidence level) |
Sample size | Date of poll | |||
|---|---|---|---|---|---|---|---|---|
| College grad[9] (cf. other poll) | 68 | |
27 | |
5 | |
501 | 5/12/2015 – 5/18/2015 |
| College grad[77] (cf. other poll) | 73 | |
35 | |
2 | |
4/16/2015 – 4/20/2015 | |
| Dem/Dem leaning college grad[9] | 84 | |
13 | |
4 | |
433 | 5/12/2015 – 5/18/2015 |
| Dem/Dem leaner with HS or less[9] | 57 | |
37 | |
6 | |
309 | 5/12/2015 – 5/18/2015 |
| Dem/Dem leaner with some college[9] | 72 | |
24 | |
4 | |
230 | 5/12/2015 – 5/18/2015 |
| HS or less[9] (cf. other poll) | 49 | |
47 | |
5 | |
636 | 5/12/2015 – 5/18/2015 |
| HS or less[77] (cf. other poll) | 54 | |
41 | |
5 | |
4/16/2015 – 4/20/2015 | |
| Post grad[77] | 74 | |
24 | |
2 | |
4/16/2015 – 4/20/2015 | |
| Post-grad[9] | 70 | |
24 | |
6 | |
354 | 5/12/2015 – 5/18/2015 |
| Rep/Rep leaning college grad[9] | 48 | |
46 | |
5 | |
357 | 5/12/2015 – 5/18/2015 |
| Rep/Rep leaner with HS or less[9] | 38 | |
60 | |
2 | |
240 | 5/12/2015 – 5/18/2015 |
| Rep/Rep leaner with some college[9] | 38 | |
60 | |
2 | |
240 | 5/12/2015 – 5/18/2015 |
| Some college[9] (cf. other poll) | 56 | |
39 | |
4 | |
503 | 5/12/2015 – 5/18/2015 |
| Some college[77] (cf. other poll) | 62 | |
35 | |
2 | |
4/16/2015 – 4/20/2015 | |
| White college grad[9] | 71 | |
24 | |
4 | |
664 | 5/12/2015 – 5/18/2015 |
| White men with some college or less[9] | 50 | |
47 | |
2 | |
384 | 5/12/2015 – 5/18/2015 |
| White women with some college or less[9] | 55 | |
40 | |
5 | |
354 | 5/12/2015 – 5/18/2015 |
| White with some college or less[9] | 53 | |
43 | |
4 | |
738 | 5/12/2015 – 5/18/2015 |
By ethnicity / race
| Ethnicity / race | % support (at 95% confidence level) |
% opposition (at 95% confidence level) |
% no opinion / don't know / refused (at 95% confidence level) |
Sample size | Date of poll | |||
|---|---|---|---|---|---|---|---|---|
| African American[77] | 60 | |
37 | |
3 | |
4/16/2015-4/20/2015 | |
| Black, Non-Hispanic[9] | 41 | |
51 | |
8 | |
177 | 5/12/2015 – 5/18/2015 |
| Hispanic[9] (cf. other poll) | 56 | |
38 | |
6 | |
248 | 5/12/2015 – 5/18/2015 |
| Hispanic[77] (cf. other poll) | 55 | |
40 | |
5 | |
4/16/2015 – 4/20/2015 | |
| Non-white[77] | 62 | |
34 | |
4 | |
4/16/2015-4/20/2015 | |
| White[77] | 61 | |
35 | |
4 | |
4/16/2015 – 4/20/2015 | |
| White, Non-Hispanic[9] | 59 | |
37 | |
4 | |
1404 | 5/12/2015-5/18/2015 |
By gender
| Gender | % support (at 95% confidence level) |
% opposition (at 95% confidence level) |
% no opinion / don't know / refused (at 95% confidence level) |
Sample size | Date of poll | |||
|---|---|---|---|---|---|---|---|---|
| Boomer men[9] | 42 | |
50 | |
8 | |
384 | 5/12/2015 – 5/18/2015 |
| Boomer women[9] | 48 | |
46 | |
6 | |
326 | 5/12/2015 – 5/18/2015 |
| Dem/Dem leaning men[9] | 66 | |
30 | |
4 | |
477 | 5/12/2015 – 5/18/2015 |
| Dem/Dem leaning women[9] | 71 | |
23 | |
6 | |
498 | 5/12/2015 – 5/18/2015 |
| Female[77] | 63 | |
34 | |
3 | |
4/16/2015 – 4/20/2015 | |
| Gen Xer men[9] | 49 | |
49 | |
2 | |
262 | 5/12/2015 – 5/18/2015 |
| Gen Xer women[9] | 69 | |
29 | |
3 | |
207 | 5/12/2015 – 5/18/2015 |
| Male[77] | 59 | |
36 | |
5 | |
4/16/2015 – 4/20/2015 | |
| Men[78] (cf. other poll) | 49 | |
41 | |
9 | |
7/23/2015 – 7/28/2015 | |
| Men[9] (cf. other poll) | 53 | |
42 | |
5 | |
1088 | 5/12/2015 – 5/18/2015 |
| Millennial men[9] | 73 | |
23 | |
4 | |
272 | 5/12/2015 – 5/18/2015 |
| Millennial women[9] | 74 | |
24 | |
2 | |
180 | 5/12/2015 – 5/18/2015 |
| Rep/Rep leaning men[9] | 40 | |
56 | |
4 | |
502 | 5/12/2015 – 5/18/2015 |
| Rep/Rep leaning women[9] | 42 | |
56 | |
3 | |
333 | 5/12/2015 – 5/18/2015 |
| Silent generation men[9] | 34 | |
59 | |
7 | |
153 | 5/12/2015 – 5/18/2015 |
| Silent generation women[9] | 43 | |
48 | |
9 | |
172 | 5/12/2015 – 5/18/2015 |
| White college grad men[9] | 53 | |
43 | |
4 | |
240 | 5/12/2015 – 5/18/2015 |
| White college grad women[9] | 80 | |
17 | |
3 | |
287 | 5/12/2015 – 5/18/2015 |
| White men[9] | 54 | |
42 | |
4 | |
761 | 5/12/2015 – 5/18/2015 |
| White women[9] | 63 | |
32 | |
4 | |
643 | 5/12/2015 – 5/18/2015 |
| Wom[78] | 57 | |
38 | |
5 | |
7/23/2015 – 7/28/2015 | |
| Women[9] | 60 | |
35 | |
5 | |
914 | 5/12/2015 – 5/18/2015 |
By income
| Income | % support (at 95% confidence level) |
% opposition (at 95% confidence level) |
% don't know / refused (at 95% confidence level) |
Sample size | Date of poll | |||
|---|---|---|---|---|---|---|---|---|
| <$30,000[9] | 51 | |
44 | |
6 | |
525 | 5/12/2015 – 5/18/2015 |
| $30,000–$74,999[9] | 57 | |
39 | |
4 | |
620 | 5/12/2015 – 5/18/2015 |
| $75,000+[9] | 64 | |
33 | |
3 | |
677 | 5/12/2015 – 5/18/2015 |
| White with <$30,000 income[9] | 52 | |
43 | |
5 | |
288 | 5/12/2015 – 5/18/2015 |
| White with $30,000–$74,999 income[9] | 60 | |
36 | |
3 | |
450 | 5/12/2015 – 5/18/2015 |
| White with $75,000+ income[9] | 64 | |
33 | |
3 | |
534 | 5/12/2015 – 5/18/2015 |
By household income
| Household income | % support (at 95% confidence level) |
% opposition (at 95% confidence level) |
% no opinion / don't know / refused (at 95% confidence level) |
Date of poll | Sample size | |||
|---|---|---|---|---|---|---|---|---|
| <$50K[77] | 60 | |
36 | |
4 | |
4/16/2015 – 4/20/2015 | |
| $50K–$100K[77] | 61 | |
35 | |
4 | |
4/16/2015 – 4/20/2015 | |
| $100K+[77] | 76 | |
21 | |
3 | |
4/16/2015 – 4/20/2015 | |
By political affiliation
| Political affiliation | % support (at 95% confidence level) |
% opposition (at 95% confidence level) |
% no opinion / don't know / refused (at 95% confidence level) |
Sample size | Date of poll | |||
|---|---|---|---|---|---|---|---|---|
| Agree with the Tea Party movement among Rep/Rep leaner[9] | 30 | |
66 | |
5 | |
314 | 5/12/2015 – 5/18/2015 |
| Cons/Mod Dem/Dem leaner[9] | 59 | |
36 | |
5 | |
536 | 5/12/2015 – 5/18/2015 |
| Conservative[9] (cf. other poll) | 30 | |
66 | |
4 | |
750 | 5/12/2015 – 5/18/2015 |
| Conservative[77] (cf. other poll) | 39 | |
56 | |
5 | |
4/16/2015 – 4/20/2015 | |
| Conservative Republican[9] (cf. other poll) | 22 | |
75 | |
3 | |
363 | 5/12/2015 – 5/18/2015 |
| Conservative Republican[77] (cf. other poll) | 25 | |
71 | |
4 | |
4/16/2015 – 4/20/2015 | |
| Conservative Rep/Rep leaner[9] | 26 | |
70 | |
2 | |
534 | 5/12/2015 – 5/18/2015 |
| Democrat[78] (cf. other poll) | 70 | |
26 | |
4 | |
7/23/2015 – 7/28/2015 | |
| Democrat[9] (cf. other poll) | 65 ± 4.5 | |
29 ± 4.5 | |
6 ± 4.5 | |
636 | 5/12/2015 – 5/18/2015 |
| Democrat[77] (cf. other poll) | 76 | |
35 | |
4 | |
4/16/2015 – 4/20/2015 | |
| Dem/Dem leaner[9] | 69 | |
40 | |
5 | |
975 | 5/12/2015 – 5/18/2015 |
| Disagree/No opinion with the Tea Party movement among Rep/Rep leaner[9] | 47 | |
50 | |
3 | |
509 | 5/12/2015 – 5/18/2015 |
| Independent[78] (cf. other poll) | 57 | |
38 | |
4 | |
7/23/2015 – 7/28/2015 | |
| Independent[9] (cf. other poll) | 65 ± 4.1 | |
31 ± 4.1 | |
4 ± 4.1 | |
758 | 5/12/2015 – 5/18/2015 |
| Independent[77] (cf. other poll) | 66 | |
30 | |
6 | |
4/16/2015 – 4/20/2015 | |
| Liberal[9] (cf. other poll) | 79 | |
17 | |
4 | |
503 | 5/12/2015 – 5/18/2015 |
| Liberal[77] (cf. other poll) | 83 | |
16 | |
1 | |
4/16/2015 – 4/20/2015 | |
| Liberal Dem/Dem leaner[9] | 84 | |
13 | |
3 | |
415 | 5/12/2015 – 5/18/2015 |
| Liberal Democrat[9] (cf. other poll) | 81 | |
16 | |
3 | |
278 | 5/12/2015 – 5/18/2015 |
| Liberal Democrat[77] (cf. other poll) | 88 | |
11 | |
1 | |
4/16/2015 – 4/20/2015 | |
| Mod/Con Democrat[77] | 65 | |
30 | |
5 | |
4/16/2015 – 4/20/2015 | |
| Mod/Cons Democrat[9] | 54 | |
39 | |
6 | |
340 | 5/12/2015 – 5/18/2015 |
| Mod/Lib Rep/Rep leaner[9] | 63 | |
34 | |
3 | |
293 | 5/12/2015 – 5/18/2015 |
| Mod/Lib Republican[9] | 59 | |
37 | |
3 | |
139 | 5/12/2015 – 5/18/2015 |
| Moderate[9] | 67 | |
29 | |
5 | |
689 | 5/12/2015 – 5/18/2015 |
| Moderate[77] (cf. other poll) | 69 | |
26 | |
5 | |
4/16/2015 – 4/20/2015 | |
| Republican[78] (cf. other poll) | 26 | |
67 | |
7 | |
7/23/2015 – 7/28/2015 | |
| Republican[9] (cf. other poll) | 34 ± 2.5 | |
63 ± 2.5 | |
3 ± 2.5 | |
506 | 5/12/2015 – 5/18/2015 |
| Republican[77] (cf. other poll) | 34 | |
63 | |
3 | |
4/16/2015 – 4/20/2015 | |
| Rep/Rep leaner[9] | 41 | |
56 | |
4 | |
835 | 5/12/2015 – 5/18/2015 |
| White Democrat[9] | 76 | |
20 | |
5 | |
367 | 5/12/2015 – 5/18/2015 |
| White Independent[9] | 69 | |
27 | |
4 | |
544 | 5/12/2015 – 5/18/2015 |
| White Republican[9] | 33 | |
64 | |
3 | |
439 | 5/12/2015 – 5/18/2015 |
By religious affiliation
| Religious affiliation | % support (at 95% confidence level) |
% opposition (at 95% confidence level) |
% don't know / refused (at 95% confidence level) |
Sample size | Date of poll | |||
|---|---|---|---|---|---|---|---|---|
| A little religious beliefs conflict with homosexuality[9] | 54 | |
41 | |
5 | |
197 | 5/12/2015 – 5/18/2015 |
| A lot of religious beliefs conflict with homosexuality[9] | 27 | |
70 | |
3 | |
650 | 5/12/2015 – 5/18/2015 |
| Dem/Dem leaner with less than weekly religious attendance[9] | 78 | |
18 | |
4 | |
682 | 5/12/2015 – 5/18/2015 |
| Dem/Dem leaner with weekly or more religious attendance[9] | 49 | |
44 | |
7 | |
286 | 5/12/2015 – 5/18/2015 |
| Less than weekly religious attendance[9] | 68 | |
27 | |
4 | |
1268 | 5/12/2015 – 5/18/2015 |
| No, no religious beliefs conflict with homosexuality[9] | 76 | |
19 | |
5 | |
1092 | 5/12/2015 – 5/18/2015 |
| Rep/Rep leaner with less than weekly religious attendance[9] | 56 | |
40 | |
4 | |
460 | 5/12/2015 – 5/18/2015 |
| Rep/Rep leaner with weekly or more religious attendance[9] | 20 | |
77 | |
3 | |
367 | 5/12/2015 – 5/18/2015 |
| Total Catholic[9] | 56 | |
38 | |
6 | |
408 | 5/12/2015 – 5/18/2015 |
| Total Protestant[9] | 40 | |
55 | |
5 | |
975 | 5/12/2015 – 5/18/2015 |
| Unaffiliated[9] | 85 | |
11 | |
4 | |
452 | 5/12/2015 – 5/18/2015 |
| Weekly or more religious attendance[9] | 34 | |
60 | |
6 | |
716 | 5/12/2015 – 5/18/2015 |
| White, Non-Hispanic Catholic[9] | 59 | |
36 | |
5 | |
249 | 5/12/2015 – 5/18/2015 |
| White, Non-Hispanic evangelical Protestant[9] | 27 | |
70 | |
3 | |
398 | 5/12/2015 – 5/18/2015 |
| White, Non-Hispanic mainline Protestant[9] | 62 | |
33 | |
4 | |
314 | 5/12/2015 – 5/18/2015 |
| Yes, religious beliefs conflict with homosexuality[9] | 33 | |
63 | |
4 | |
847 | 5/12/2015 – 5/18/2015 |
By registered voters
| Registered voters | % support (at 95% confidence level) |
% opposition (at 95% confidence level) |
% no opinion / don't know / refused (at 95% confidence level) |
Sample size | Date of poll | |||
|---|---|---|---|---|---|---|---|---|
| Registered voter[9] | 56 | |
39 | |
5 | |
1497 | 5/12/2015 – 5/18/2015 |
| Registered voters[77] | 59 | |
37 | |
4 | |
4/16/2015 – 4/20/2015 | |
Regional, state, and local level polls
By region
| Region | % support (at 95% confidence level) |
% opposition (at 95% confidence level) |
% no opinion / don't know / refused (at 95% confidence level) |
Sample size | Date of poll | |||
|---|---|---|---|---|---|---|---|---|
| Great Lakes-East North (IL MI OH WI)[9] | 57 | |
40 | |
3 | |
317 | 5/12/2015 – 5/18/2015 |
| Middle Atlantic (DE DC MD NJ NY PA)[9] | 64 | |
30 | |
6 | |
280 | 5/12/2015 – 5/18/2015 |
| Midwest[9] (cf. other poll) | 58 | |
39 | |
4 | |
483 | 5/12/2015 – 5/18/2015 |
| Midwest[77] (cf. other poll) | 57 | |
40 | |
3 | |
4/16/2015 – 4/20/2015 | |
| Midwest-West North (IA KS MN MO NE ND SD)[9] | 59 | |
36 | |
5 | |
166 | 5/12/2015 – 5/18/2015 |
| Northeast[9] (cf. other poll) | 67 | |
28 | |
4 | |
317 | 5/12/2015 – 5/18/2015 |
| Northeast[77] (cf. other poll) | 68 | |
28 | |
4 | |
4/16/2015 – 4/20/2015 | |
| Pacific (AK CA HI OR WA)[9] | 65 | |
29 | |
6 | |
293 | 5/12/2015 – 5/18/2015 |
| South[9] (cf. other poll) | 47 | |
47 | |
6 | |
753 | 5/12/2015 – 5/18/2015 |
| South Atlantic (FL GA NC SC VA WV)[9] | 52 | |
43 | |
5 | |
344 | 5/12/2015 – 5/18/2015 |
| South Central (AL AR KY LA MS OK TN TX)[9] | 39 | |
54 | |
7 | |
353 | 5/12/2015 – 5/18/2015 |
| West[9] (cf. other poll) | 63 | |
32 | |
5 | |
449 | 5/12/2015 – 5/18/2015 |
| West[77] (cf. other poll) | 65 | |
30 | |
5 | |
4/16/2015 – 4/20/2015 | |
| White Midwest[9] | 59 | |
37 | |
3 | |
400 | 5/12/2015 – 5/18/2015 |
| White Northeast[9] | 69 | |
27 | |
4 | |
216 | 5/12/2015 – 5/18/2015 |
| White South[9] | 48 | |
47 | |
5 | |
400 | 5/12/2015 – 5/18/2015 |
| White West[9] | 68 | |
28 | |
3 | |
278 | 5/12/2015 – 5/18/2015 |
By state / federal district

| State / federal district | % support (at 95% confidence level) |
% opposition | % no opinion / don't know / refused | Date of poll | Sample size | |||
|---|---|---|---|---|---|---|---|---|
| Alabama[10] | 33 | |
60 | |
7 | |
2015-2016 | 657 adults |
| Alaska[10] | 60 | |
34 | |
6 | |
2015-2016 | 338 adults |
| Arizona[79] | 56 | |
36 | |
7 | |
2015-2016 | 829 adults |
| Arkansas[10] | 37 | |
57 | |
6 | |
2015-2016 | 407 adults |
| California[10] | 60 | |
30 | |
9 | |
2015-2016 | 3,926 adults |
| Colorado[10] | 65 | |
27 | |
8 | |
2015-2016 | 712 adults |
| Connecticut[10] | 70 | |
24 | |
7 | |
2015-2016 | 475 adults |
| Delaware[10] | 66 | |
25 | |
8 | |
2015-2016 | 148 adults |
| District of Columbia[80] | 64 | |
26 | |
10 | |
2014 | 303 |
| Florida[10] | 53 | |
37 | |
10 | |
2015-2016 | 2,572 adults |
| Georgia[10] | 45 | |
47 | |
8 | |
2015-2016 | 1,240 adults |
| Hawaii[10] | 61 | |
29 | |
20 | |
2015-2016 | 202 adults |
| Idaho[10] | 49 | |
41 | |
10 | |
2015-2016 | 230 adults |
| Illinois[10] | 60 | |
33 | |
7 | |
2015-2016 | 1,514 adults |
| Indiana[10] | 52 | |
38 | |
9 | |
2015-2016 | 978 adults |
| Iowa[10] | 56 | |
35 | |
9 | |
2015-2016 | 587 voters |
| Kansas[10] | 53 | |
38 | |
9 | |
2015-2016 | 465 adults |
| Kentucky[10] | 45 | |
47 | |
8 | |
2015-2016 | 690 adults |
| Louisiana[81][82] | 41 ± 3.1 | |
53 ± 3.1 | |
7 ± 3.1 | |
2016/2/01–2016/2/26 | 1,001 residents |
| Maine[10] | 56 | |
35 | |
9 | |
2015-2016 | 226 adults |
| Maryland[10] | 54 | |
36 | |
10 | |
2015-2016 | 721 adults |
| Massachusetts[10] | 76 | |
18 | |
6 | |
2015-2016 | 750 adults |
| Michigan[10] | 54 | |
38 | |
7 | |
2015-2016 | 1,225 adults |
| Minnesota[10] | 57 | |
37 | |
6 ± 2.2 | |
2015-2016 | 769 adults |
| Mississippi[10] | 25 | |
65 | |
9 | |
2015-2016 | 423 adults |
| Missouri[10] | 48 | |
45 | |
7 | |
2015-2016 | 894 adults |
| Montana[10] | 49 | |
43 | |
9 | |
2015-2016 | 244 adults |
| Nebraska[10] | 49 | |
43 | |
9 | |
2015-2016 | 244 adults |
| Nevada[10] | 57 | |
35 | |
8 | |
2015-2016 | 352 adults |
| New Hampshire[10] | 73 | |
19 | |
8 | |
2015-2016 | 189 adults |
| New Jersey[10] | 66 | |
26 | |
8 | |
2015-2016 | 1,048 adults |
| New Mexico[10] | 58 | |
34 | |
8 | |
2015-2016 | 307 adults |
| New York[10] | 63 | |
29 | |
9 | |
2015-2016 | 2,813 adults |
| North Carolina[10] | 46 | |
47 | |
8 | |
2015-2016 | 1,477 adults |
| North Dakota[10] | 43 | |
44 | |
12 | |
2015-2016 | 155 adults |
| Ohio[10] | 53 | |
40 | |
8 | |
2015-2016 | 1,773 adults |
| Oklahoma[10] | 44 | |
48 | |
8 | |
2015-2016 | 57 adults |
| Oregon[10] | 62 | |
29 | |
9 | |
2015-2016 | 694 adults |
| Pennsylvania[10] | 55 | |
36 | |
8 | |
2015-2016 | 1,924 adults |
| Rhode Island[10] | 69 | |
24 | |
6 | |
2015-2016 | 154 adults |
| South Carolina[10] | 40 | |
49 | |
11 | |
2015-2016 | 702 adults |
| South Dakota[10] | 39 | |
57 | |
4 | |
2015-2016 | 155 adults |
| Tennessee[10] | 37 | |
56 | |
6 | |
2015-2016 | 979 adults |
| Texas[10] | 46 | |
45 | |
9 | |
2015-2016 | 2,782 adults |
| Utah[83] | 43 | |
49 | |
8 | |
6/8 – 6/17/2016 | 614 adults |
| Vermont[10] | 69 | |
21 | |
10 | |
2015-2016 | 148 adults |
| Virginia[10] | 49 | |
42 | |
9 | |
2015-2016 | 1,168 adults |
| Washington[10] | 65 | |
28 | |
7 | |
2015-2016 | 1,027 adults |
| West Virginia[10] | 45 | |
50 | |
5 | |
2015-2016 | 311 adults |
| Wisconsin[10] | 55 | |
36 | |
8 | |
2015-2016 | 986 adults |
| Wyoming[10] | 48 | |
43 | |
9 | |
2015-2016 | 139 adults |
By metro area
| City/metro area | % support (at 95% confidence level) |
% opposition (at 95% confidence level) |
% no opinion (at 95% confidence level) |
Date of poll | Sample size | |||
|---|---|---|---|---|---|---|---|---|
| Atlanta[84] | 48 | |
44 | |
9 | |
4/2/2014 – 1/4/2015 | 858 adults |
| Boston[84] | 76 | |
18 | |
5 | |
4/2/2014 – 1/4/2015 | 689 adults |
| Charlotte[84] | 49 | |
46 | |
6 | |
4/2/2014 – 1/4/2015 | 382 adults |
| Chicago[84] | 62 | |
32 | |
6 | |
4/2/2014 – 1/4/2015 | 1,243 adults |
| Cincinnati[84] | 58 | |
38 | |
4 | |
4/2/2014 – 1/4/2015 | 388 adults |
| Cleveland[84] | 54 | |
33 | |
13 | |
4/2/2014 – 1/4/2015 | 326 adults |
| Columbus[84] | 55 | |
38 | |
8 | |
4/2/2014 – 1/4/2015 | 326 adults |
| Dallas[84] | 50 | |
43 | |
6 | |
4/2/2014 – 1/4/2015 | 925 adults |
| Denver[84] | 64 | |
28 | |
8 | |
4/2/2014 – 1/4/2015 | 440 adults |
| Detroit[84] | 52 | |
39 | |
10 | |
4/2/2014 – 1/4/2015 | 644 adults |
| Houston[84] | 48 | |
44 | |
9 | |
4/2/2014 – 1/4/2015 | 802 adults |
| Indianapolis[84] | 46 | |
45 | |
9 | |
4/2/2014 – 1/4/2015 | 332 adults |
| Kansas City[84] | 50 | |
41 | |
10 | |
4/2/2014 – 1/4/2015 | 366 adults |
| Las Vegas[84] | 60 | |
31 | |
8 | |
4/2/2014 – 1/4/2015 | 309 adults |
| Los Angeles[84] | 60 | |
32 | |
9 | |
4/2/2014 – 1/4/2015 | 1,407 adults |
| Miami[84] | 53 | |
39 | |
8 | |
4/2/2014 – 1/4/2015 | 801 adults |
| Milwaukee[84] | 60 | |
35 | |
5 | |
4/2/2014 – 1/4/2015 | 325 adults |
| Minneapolis–Saint Paul[84] | 64 | |
27 | |
9 | |
4/2/2014 – 1/4/2015 | 603 adults |
| Nashville[84] | 45 | |
47 | |
8 | |
4/2/2014 – 1/4/2015 | 279 adults |
| New York City[84] | 64 | |
29 | |
7 | |
4/2/2014 – 1/4/2015 | 3,383 adults |
| Orlando[84] | 56 | |
38 | |
6 | |
4/2/2014 – 1/4/2015 | 348 adults |
| Philadelphia[84] | 60 | |
31 | |
9 | |
4/2/2014 – 1/4/2015 | 1,045 adults |
| Phoenix[84] | 61 | |
29 | |
10 | |
4/2/2014 – 1/4/2015 | 568 adults |
| Pittsburgh[84] | 58 | |
35 | |
7 | |
4/2/2014 – 1/4/2015 | 482 adults |
| Portland[84] | 65 | |
27 | |
8 | |
4/2/2014 – 1/4/2015 | 355 adults |
| San Francisco[84] | 74 | |
19 | |
7 | |
4/2/2014 – 1/4/2015 | 498 adults |
| Seattle[84] | 67 | |
26 | |
7 | |
4/2/2014 – 1/4/2015 | 470 adults |
| St. Louis[84] | 50 | |
41 | |
9 | |
4/2/2014 – 1/4/2015 | 491 adults |
| Tampa-St. Petersburg[84] | 58 | |
34 | |
8 | |
4/2/2014 – 1/4/2015 | 532 adults |
| Washington, D.C.[84] | 60 | |
32 | |
8 | |
4/2/2014 – 1/4/2015 | 937 adults |
See also
References
- ↑ Same-Sex Marriage Support Solidifies Above 50% in U.S. http://www.gallup.com/poll/162398/sex-marriage-support-solidifies-above.aspx
- ↑ "Polls: Same-Sex Marriage, Gay Rights". Retrieved 14 July 2013.
- ↑ Swanson, Emily (March 3, 2011). "Poll: Support For Gay Marriage Growing". Huffington Post. Retrieved 14 July 2013.
- ↑ Gelman, Andrew; Lax, Jeffrey; Phillips, Justin (August 21, 2010). "Over Time, a Gay Marriage Groundswell". The New York Times. Retrieved 14 July 2013.
- ↑ "Growing Public Support for Same-Sex Marriage". Retrieved 14 July 2013.
- ↑ Gelman, Andrew; Lax, Jeffrey; Phillips, Justin (August 21, 2010). "Over Time, a Gay Marriage Groundswell". The New York Times.
- 1 2 "The AP-National Constitution Center Poll – Aug 11-16, 2010" (PDF). August 2010. Retrieved 2012-03-15.
- 1 2 "ABC News/Washington Post poll: same-sex marriage – March 18, 2011" (PDF). March 2011. Retrieved 2012-03-15.
- 1 2 3 4 5 6 7 8 9 10 11 12 13 14 15 16 17 18 19 20 21 22 23 24 25 26 27 28 29 30 31 32 33 34 35 36 37 38 39 40 41 42 43 44 45 46 47 48 49 50 51 52 53 54 55 56 57 58 59 60 61 62 63 64 65 66 67 68 69 70 71 72 73 74 75 76 77 78 79 80 81 82 83 84 85 86 87 88 89 90 91 92 93 94 95 96 97 98 99 100 101 102 103 104 105 106 107 108 109 110 111 112 113 114 115 116 117 118 119 120 121 122 123 124 125 126 127 128 Same-Sex Marriage Detailed Tables
- 1 2 3 4 5 6 7 8 9 10 11 12 13 14 15 16 17 18 19 20 21 22 23 24 25 26 27 28 29 30 31 32 33 34 35 36 37 38 39 40 41 42 43 44 45 46 47 48 49 50 51 52 Public Religion Research Institute 2015
- ↑ Marriage
- ↑ August 3, 2015 - American Voters Oppose Iran Deal 2-1, Quinnipiac University National Poll Finds; Pope's Climate Change Message Gets Huge Support
- ↑ "AP Poll: Sharp divisions after high court backs gay marriage". Yahoo News. 18 July 2015. Retrieved 8 October 2015.
- ↑ Janet Hook. "Support for Gay Marriage Hits All-Time High — WSJ/NBC News Poll". Wall Street Journal. Retrieved 8 October 2015.
- ↑ "Poll: 60 percent of likely voters back gay marriage". POLITICO. Retrieved 8 October 2015.
- ↑ "CNN poll: 63 percent of Americans say same-sex couples have a right to marry". LGBTQ Nation. Retrieved 8 October 2015.
- ↑ "CBS News / New York Times Upshot Battleground Tracker". YouGov. Retrieved 2014-10-27.
- ↑ "Social & Political Issues - Pew Research Center". Pew Research Center's Religion & Public Life Project. 22 September 2014. Retrieved 8 October 2015.
- ↑ "Same-Sex Marriage Support Reaches New High at 55%". Gallup Polling. Retrieved 22 May 2014.
- ↑ Other Policy Debates in 2014: Same-sex Marriage, Health Care, and Minimum Wage
- ↑ "Pew Research Center February 2014 Political Survey" (PDF). Retrieved 28 October 2014.
- ↑ "Majority of young conservatives accept same-sex marriage". Retrieved 21 March 2014.
- ↑ "Anti-gay marriage sentiment fading". Washington Post. Retrieved 22 April 2014.
- ↑ "Young Republicans favor same-sex marriage - Pew Research Center". Pew Research Center. 10 March 2014. Retrieved 8 October 2015.
- ↑ Peyton M. Craighill and Scott Clement (March 5, 2014). "Support for same-sex marriage hits new high; half say Constitution guarantees right". The Washington Post. Retrieved March 5, 2014.
- ↑ "Washington Post-ABC News poll March 2014 - Politics, Obama and 2014 midterms". Washington Post. Retrieved 5 March 2014.
- ↑ "A Shifting Landscape: A Decade of Change in American Attitudes about Same-Sex Marriage and LGBT Issues". Public Religion Research Institute. Dec 2013. Retrieved 27 February 2014.. Margin of error 1.7%.
- 1 2 "Civil Rights". pollingreport.com. Retrieved 8 October 2015.
- ↑ "National (US) Poll - October 4, 2013 - U.S. Catholics Back Pope On Ch - Quinnipiac University Connecticut". Quinnipiac University. Retrieved 8 October 2015.
- ↑ "In U.S., 52% Back Law to Legalize Gay Marriage in 50 States". Gallup. Retrieved 8 October 2015.
- ↑ New Poll: Marriage Equality Support at Record High in Wake of SCOTUS Ruling retrieved 6 July 2013
- ↑ Gay Rights Poll: ABC News, Washington Post Survey Finds Support For Same-Sex Marriage, Ending Boy Scout Ban retrieved 30 May 2013
- ↑ "Poll: 53% of Americans support same-sex marriage". CBS News.
- ↑ "Q: Do you think it should be legal or illegal for gay and lesbian couples to get married?". The Washington Post. April 12, 2013.
- ↑ "Gay marriage support hits new high in Post-ABC poll". The Washington Post.
- ↑ Quinnipiac University. "National (US) Poll - March 8, 2013 - American Catholics Support Sam - Quinnipiac University Connecticut". Quinnipiac University. Retrieved 8 October 2015.
- ↑ Religion Big Factor for Americans Against Same-Sex Marriage retrieved 7 December 2012
- ↑ Poll: 51 percent support same-sex marriage retrieved 4 December 2012
- ↑ Majority Supports Path to Citizenship; Greater Division on Other Social Issues retrieved 17-11-2012
- ↑ Pruitt, Bill (June 6, 2012). "Majority of Americans support legalizing same-sex marriage, poll shows". yahoo.com. Retrieved 6 June 2012. archived here
- ↑ Americans increase support of marriage equality retrieved 23 May 2012
- ↑ After President Obama's announcement, Opposition to same-sex marriage hits record low The Washington Post. Accessed May 23, 2012.
- ↑ Poll Report: Strong Support for Gay Marriage Now Exceeds Strong Opposition Langer Research Association. langerresearch.com. accessed May 23, 2012.
- ↑ Sam Stein (May 9, 2012). "Obama Backs Gay Marriage". The Huffington Post.
- ↑ "Most Popular E-mail Newsletter". USA Today. May 11, 2012.
- ↑ "Half of Americans Support Legal Gay Marriage". May 8, 2012. Retrieved May 12, 2012.
- ↑ "Changing Attitudes on Gay Marriage". Pew Research Center's Religion & Public Life Project. 29 July 2015. Retrieved 8 October 2015.
- ↑ "Survey | Majority of Americans Do Not Believe Religious Liberty is Under Attack". Publicreligion.org. March 2012. Retrieved 2012-03-15.
- ↑ "Study #12202 NBC News/Wall Street Journal Survey" (PDF). Retrieved 28 August 2012.
- 1 2 Publications (March 2011). "The Pew Research Center for the People & the Press: Attitudes Toward Social Issues – March 3, 2011". People-press.org. Retrieved 2012-03-15.
- 1 2 "For First Time, Majority of Americans Favor Legal Gay Marriage". Gallup.com. May 20, 2011. Retrieved 2012-03-15.
- 1 2 "CNN Opinion Research – April 9-10, 2011" (PDF). April 19, 2011. Retrieved 2012-03-15.
- ↑ "Democracy Corps poll - March 2011" (PDF). Democracy Corps. March 2011. Retrieved 2012-03-15.
- ↑ "CNN Opinion Research – Aug 6-10, 2010" (PDF). August 2010. Retrieved 2012-03-15.
- ↑ http://www.washingtonpost.com/wp-srv/politics/polls/postpoll_021010.html Washington Post-ABC News poll
- ↑ http://www.gallup.com/poll/128291/americans-opposition-gay-marriage-eases-slightly.aspx Americans' Opposition to Gay Marriage Eases Slightly
- ↑ http://www.publicpolicypolling.com/pdf/PPP_Release_National_813.pdf PPP Poll – August 13, 2010
- ↑ http://www.bpnews.net/BPnews.asp?ID=33524 Pollster: Most 'gay marriage' polls skewed http://catholicexchange.com/2010/08/18/133416/Polling Director: Polls Stating Americans Support Gay Marriage Untrustworthy
- ↑ "CNN 2010 Exit Polls". CNN.com. November 2010. Retrieved 2012-03-15.
- ↑ http://abcnews.go.com/images/PollingUnit/1089a6HotButtonIssues.pdf
- ↑ Archived April 29, 2009, at the Wayback Machine.
- ↑ "Majority of Americans Continue to Oppose Gay Marriage". Gallup.com. May 27, 2009. Retrieved 2012-03-15.
- ↑ Law and Civil Rights: Same-sex marriage, gay rights, CBS News/New York Times Poll. April 22–26, 2009. N=973 adults nationwide. MoE ± 3 (for all adults), PollingReport.com
- 1 2 3 Law and Civil Rights, PollingReport.com. (Accessed January 05, 2012)
- ↑ Silver, Nate (April 30, 2009). "Two National Polls, for First Time, Show Plurality Support for Gay Marriage". FiveThirtyEight. Retrieved 2010-12-12.
- ↑ American 'Millennials' divided over same-sex marriage
- 1 2 Quinnipiac University – Office of Public Affairs (2008-07-17). "American Voters Oppose Same-Sex Marriage Quinnipiac University National Poll Finds, But They Don't Want Government To Ban It". Quinnipiac.edu. Retrieved 2012-03-15.
- ↑ Buchanan, Wyatt, Resistance to same-sex marriage drops across U.S, San Francisco Chronicle, March 24, 2006. (Accessed July 5, 2006)
- ↑ (07/28/08) (2008-07-13). "U.S. Divided on Homosexual Couples: Angus Reid Global Monitor". Angus-reid.com. Retrieved 2012-03-15.
- ↑ (12/13/08) (2008-12-04). "Americans Divided on Same-Sex Legal Rights: Angus Reid Global Monitor". Angus-reid.com. Retrieved 2012-03-15.
- ↑ "Traditional Views of Marriage Tops in Voters' Minds". Archived from the original on 2008-04-06. Retrieved 2008-06-02.
- ↑ "Changing Attitudes on Gay Marriage". Retrieved 2012-04-29.
- ↑ Rosenthal, Andrew (2012-04-26). "Support for Same-Sex Marriage Is Up". The New York Times. Retrieved 2012-12-05.
- 1 2 3 4 5 "Fewer Are Angry at Government, But Discontent Remains High". Retrieved 2012-01-05.
- 1 2 "Less Opposition to Gay Marriage, Adoption and Military Service". Retrieved 2007-09-21.
- ↑ Should Gays Have Marriage Rights?
- 1 2 3 4 5 6 7 8 9 10 11 12 13 14 15 16 17 18 19 20 21 22 23 24 25 26 27 28 29 Q: Overall, do you support or oppose allowing gays and lesbians to marry legally?
- 1 2 3 4 5 August 3, 2015 - American Voters Oppose Iran Deal 2-1, Quinnipiac University National Poll Finds; Pope's Climate Change Message Gets Huge Support
- ↑ Ducey Off To Rough Start
- ↑ Adults in the District of Columbia
- ↑ THE LOUISIANA SURVEY 2016
- ↑ Poll finds La. residents mostly conservative on social issues, including gay rights, abortion
- ↑ "Poll same-sex marriage Utah".
- 1 2 3 4 5 6 7 8 9 10 11 12 13 14 15 16 17 18 19 20 21 22 23 24 25 26 27 28 29 30 "The American Values Atlas". Public Religion Research Institute. Retrieved 1/5/2015. Check date values in:
|access-date=(help)