Psychrometrics
| Humidity and hygrometry | |
|---|---|
 | |
| Specific concepts | |
| General concepts | |
| Measures and Instruments | |
Psychrometrics or psychrometry or hygrometry are terms used to describe the field of engineering concerned with the determination of physical and thermodynamic properties of gas-vapor mixtures. The term derives from the Greek psuchron (ψυχρόν) meaning "cold"[1] and metron (μέτρον) meaning "means of measurement".[2]
Common applications
Although the principles of psychrometry apply to any physical system consisting of gas-vapor mixtures, the most common system of interest is the mixture of water vapor and air, because of its application in heating, ventilating, and air-conditioning and meteorology. In human terms, our thermal comfort is in large part a consequence of not just the temperature of the surrounding air, but (because we cool ourselves via perspiration) the extent to which that air is saturated with water vapor.
Many substances are hygroscopic, meaning they attract water, usually in proportion to the relative humidity or above a critical relative humidity. Such substances include cotton, paper, cellulose, other wood products, sugar, calcium oxide (burned lime) and many chemicals and fertilizers. Industries that use these materials are concerned with relative humidity control in production and storage of such materials.
In industrial drying applications, such as drying paper, manufacturers usually try to achieve an optimum between low relative humidity, which increases the drying rate, and energy usage, which decreases as exhaust relative humidity increases. In many industrial applications it is important to avoid condensation that would ruin product or cause corrosion.
Molds and fungi can be controlled by keeping relative humidity low. Wood destroying fungi generally do not grow at relative humidities below 75%.[3]
Psychrometric properties
Dry-bulb temperature (DBT)
The dry-bulb temperature is the temperature indicated by a thermometer exposed to the air in a place sheltered from direct solar radiation. The term dry-bulb is customarily added to temperature to distinguish it from wet-bulb and dewpoint temperature. In meteorology and psychrometrics the word temperature by itself without a prefix usually means dry-bulb temperature. Technically, the temperature registered by the dry-bulb thermometer of a psychrometer. The name implies that the sensing bulb or element is in fact dry. WMO provides a 23-page chapter on the measurement of temperature.[4]
Wet-bulb temperature (WBT)
The thermodynamic wet-bulb temperature is a thermodynamic property of a mixture of air and water vapor. The value indicated by a wet-bulb thermometer often provides an adequate approximation of the thermodynamic wet-bulb temperature.
The accuracy of a simple wet-bulb thermometer depends on how fast air passes over the bulb and how well the thermometer is shielded from the radiant temperature of its surroundings. Speeds up to 5,000 ft/min (~60 mph) are best but it may be dangerous to move a thermometer at that speed. Errors up to 15% can occur if the air movement is too slow or if there is too much radiant heat present (from sunlight, for example).
A wet bulb temperature taken with air moving at about 1–2 m/s is referred to as a screen temperature, whereas a temperature taken with air moving about 3.5 m/s or more is referred to as sling temperature.
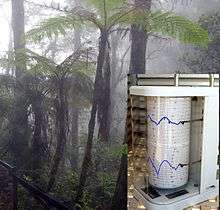
A psychrometer is a device that includes both a dry-bulb and a wet-bulb thermometer. A sling psychrometer requires manual operation to create the airflow over the bulbs, but a powered psychrometer includes a fan for this function. Knowing both the dry-bulb temperature (DBT) and wet-bulb temperature (WBT), one can determine the relative humidity (RH) from the psychrometric chart appropriate to the air pressure.
Relative humidity
The ratio of the vapor pressure of moisture in the sample to the saturation pressure at the dry bulb temperature of the sample.
Dew point temperature
The saturation temperature of the moisture present in the sample of air, it can also be defined as the temperature at which the vapour changes into liquid (condensation). Usually the level at which water vapor changes into liquid marks the base of the cloud in the atmosphere hence called condensation level. So the temperature value that allows this process (condensation) to take place is called the 'dew point temperature'. A simplified definition is the temperature at which the water vapour turns into "dew" (Chamunoda Zambuko 2012).
Humidity
Specific Humidity
Specific humidity is defined as the proportion of the mass of water vapor per unit mass of the moist air sample (dry air plus the water vapor); it is closely related to humidity ratio and always lower in value.
Absolute humidity
The mass of water vapor per unit volume of air containing the water vapor. This quantity is also known as the water vapor density.[5]
Specific enthalpy
Analogous to the specific enthalpy of a pure substance. In psychrometrics, the term quantifies the total energy of both the dry air and water vapour per kilogram of dry air.
Specific volume
Analogous to the specific volume of a pure substance. However, in psychrometrics, the term quantifies the total volume of both the dry air and water vapour per unit mass of dry air.
Psychrometric ratio
The psychrometric ratio is the ratio of the heat transfer coefficient to the product of mass transfer coefficient and humid heat at a wetted surface. It may be evaluated with the following equation:[6][7]

- where:
- = Psychrometric ratio, dimensionless
- = convective heat transfer coefficient, W m−2 K−1
- = convective mass transfer coefficient, kg m−2 s−1
- = humid heat, J kg−1 K−1


The psychrometric ratio is an important property in the area of psychrometrics, as it relates the absolute humidity and saturation humidity to the difference between the dry bulb temperature and the adiabatic saturation temperature.
Mixtures of air and water vapor are the most common systems encountered in psychrometry. The psychrometric ratio of air-water vapor mixtures is approximately unity, which implies that the difference between the adiabatic saturation temperature and wet bulb temperature of air-water vapor mixtures is small. This property of air-water vapor systems simplifies drying and cooling calculations often performed using psychrometic relationships.
Humid heat
Humid heat is the constant-pressure specific heat of moist air, per unit mass of the dry air.[8]
Pressure
Many psychrometric properties are dependent on pressure concept:
- vapor pressure of water;
- atmospheric pressure at the location of the sample.
Psychrometric charts
Terminology
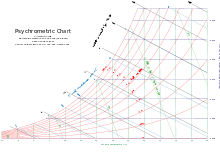
A psychrometric chart is a graph of the thermodynamic parameters of moist air at a constant pressure, often equated to an elevation relative to sea level. The ASHRAE-style psychrometric chart, shown here, was pioneered by Willis Carrier in 1904.[9] It depicts these parameters and is thus a graphical equation of state. The parameters are:
- Dry-bulb temperature (DBT) is that of an air sample, as determined by an ordinary thermometer. It is typically plotted as the abscissa (horizontal axis) of the graph. The SI units for temperature are kelvins or degrees Celsius; other units are degrees Fahrenheit and degrees Rankine.
- Wet-bulb temperature (WBT) is that of an air sample after it has passed through a constant-pressure, ideal, adiabatic saturation process, that is, after the air has passed over a large surface of liquid water in an insulated channel. In practice this is the reading of a thermometer whose sensing bulb is covered with a wet sock evaporating into a rapid stream of the sample air (see Hygrometer). When the air sample is saturated with water, the WBT will read the same as the DBT. The slope of the line of constant WBT reflects the heat of vaporization of the water required to saturate the air of a given relative humidity.
- Dew point temperature (DPT) is the temperature at which a moist air sample at the same pressure would reach water vapor "saturation." At this point further removal of heat would result in water vapor condensing into liquid water fog or, if below freezing point, solid hoarfrost. The dew point temperature is measured easily and provides useful information, but is normally not considered an independent property of the air sample as it duplicates information available via other humidity properties and the saturation curve.
- Relative humidity (RH) is the ratio of the mole fraction of water vapor to the mole fraction of saturated moist air at the same temperature and pressure. RH is dimensionless, and is usually expressed as a percentage. Lines of constant RH reflect the physics of air and water: they are determined via experimental measurement. The concept that air "holds" moisture, or that moisture "dissolves" in dry air and saturates the solution at some proportion, is erroneous (albeit widespread); see relative humidity for further details.
- Humidity ratio is the proportion of mass of water vapor per unit mass of dry air at the given conditions (DBT, WBT, DPT, RH, etc.). It is also known as the moisture content or mixing ratio. It is typically plotted as the ordinate (vertical axis) of the graph. For a given DBT there will be a particular humidity ratio for which the air sample is at 100% relative humidity: the relationship reflects the physics of water and air and must be determined by measurement. The dimensionless humidity ratio is typically expressed as grams of water per kilogram of dry air, or grains of water per pound of air (7000 grains equal 1 pound).
- Specific enthalpy, symbolized by h, is the sum of the internal (heat) energy of the moist air in question, including the heat of the air and water vapor within. Also called heat content per unit mass. In the approximation of ideal gases, lines of constant enthalpy are parallel to lines of constant WBT. Enthalpy is given in (SI) joules per kilogram of air, or BTU per pound of dry air.
- Specific volume is the volume of the mixture (dry air plus the water vapor) containing one unit of mass of "dry air". The SI units are cubic meters per kilogram of dry air; other units are cubic feet per pound of dry air. The inverse of specific volume is usually confused as the density of the mixture (see "Applying the Psychrometric Relationships" CIBSE, August 2009). However, to obtain the actual mixture density one must multiply the inverse of the specific volume by unity plus the humidity ratio value at the point of interest (see ASHRAE Fundamentals 1989 6.6, equation 9).
The psychrometric chart allows all the parameters of some moist air to be determined from any three independent parameters, one of which must be the pressure. Changes in state, such as when two air streams mix, can be modeled easily and somewhat graphically using the correct psychrometric chart for the location's air pressure or elevation relative to sea level. For locations at not more than 2000 ft (600 m) of altitude it is common practice to use the sea-level psychrometric chart.
In the ω-t chart, the dry bulb temperature (t) appears as the abscissa (horizontal axis) and the humidity ratio (ω) appear as the ordinate (vertical axis). A chart is valid for a given air pressure (or elevation above sea level). From any two independent ones of the six parameters dry bulb temperature, wet bulb temperature, relative humidity, humidity ratio, specific enthalpy, and specific volume, all the others can be determined. There are possible combinations of independent and derived parameters.

Locating parameters on chart
* Dry bulb temperature: These lines are drawn straight, not always parallel to each other, and slightly inclined from the vertical position. This is the t–axis, the abscissa (horizontal) axis. Each line represents a constant temperature.
* Dew point temperature: From the state point follow the horizontal line of constant humidity ratio to the intercept of 100% RH, also known as the saturation curve. The dew point temperature is equal to the fully saturated dry bulb or wet bulb temperatures.
* Wet bulb temperature: These lines are oblique lines that differ slightly from the enthalpy lines. They are identically straight but are not exactly parallel to each other. These intersect the saturation curve at DBT point.
* Relative humidity: These hyperbolic lines are shown in intervals of 10%. The saturation curve is at 100% RH, while dry air is at 0% RH.
* Humidity ratio: These are the horizontal lines on the chart. Humidity ratio is usually expressed as mass of moisture per mass of dry air (pounds or kilograms of moisture per pound or kilogram of dry air, respectively). The range is from 0 for dry air up to 0.03 (lbmw/lbma) on the right hand ω-axis, the ordinate or vertical axis of the chart.
* Specific enthalpy: These are oblique lines drawn diagonally downward from left to right across the chart that are parallel to each other. These are not parallel to wet bulb temperature lines.
Specific volume: These are a family of equally spaced straight lines that are nearly parallel.
The region above the saturation curve is a two-phase region that represents a mixture of saturated moist air and liquid water, in thermal equilibrium.
The protractor on the upper left of the chart has two scales. The inner scale represents sensible-total heat ratio (SHF). The outer scale gives the ratio of enthalpy difference to humidity difference. This is used to establish the slope of a condition line between two processes. The horizontal component of the condition line is the change in sensible heat while the vertical component is the change in latent heat.[10][11][12]
How to read the chart: fundamental examples
Psychrometric charts are available in SI (metric) and IP (U.S./Imperial) units. They are also available in low and high temperature ranges and for different pressures.
- Determining relative humidity: The percent relative humidity can be located at the intersection of the vertical dry bulb and diagonally down sloping wet bulb temperature lines. Metric (SI): Using a dry bulb of 25 °C and a wet bulb of 20 °C, read the relative humidity at approximately 63.5%. U.S/Imperial (IP): Using a dry bulb of 77 °F and a wet bulb of 68 °F, read the relative humidity at approximately 63.5%. In this example the humidity ratio is 0.0126 kg water per kg dry air.
- Determining the effect of temperature change on relative humidity: For air of a fixed water composition or moisture ratio, find the starting relative humidity from the intersection of the wet and dry bulb temperature lines. Using the conditions from the previous example, the relative humidity at a different dry bulb temperatures can be found along the horizontal humidity ratio line of 0.0126, either in kg water per kg dry air or pounds water per pound dry air.
- A common variation of this problem is determining the final humidity of air leaving an air conditioner evaporator coil then heated to a higher temperature. Assume that the temperature leaving the coil is 10°C (50°F) and is heated to room temperature (not mixed with room air), which is found by following the horizontal humidity ratio from the dew point or saturation line to the room dry bulb temperature line and reading the relative humidity. In typical practice the conditioned air is mixed with room air that is being infiltrated with outside air.
- Determining the amount of water to be removed or added in lowering or raising relative humidity: This is the difference in humidity ratio between the initial and final conditions times the weight of dry air.
Mollier diagram
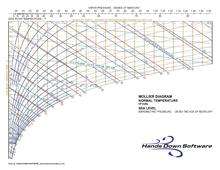
The "Mollier i-x" (Enthalpy - Humidity Mixing Ratio) diagram, developed by Richard Mollier in 1923,[13] is an alternative psychrometric chart, preferred by many users in Scandinavia, Eastern Europe, and Russia.[14]
The underlying psychrometric parameter data for the psychrometric chart and the Mollier diagram are identical. At first glance there is little resemblance between the charts, but if the chart is rotated by ninety degrees and looked at in a mirror the resemblance becomes apparent. The Mollier diagram coordinates are enthalpy and humidity ratio. The enthalpy coordinate is skewed and the lines of constant enthalpy are parallel and evenly spaced. The ASHRAE psychrometric charts since 1961 use similar plotting coordinates. Some psychrometric charts use dry-bulb temperature and humidity ratio coordinates.
See also
- Air
- Air conditioning
- Dalton's law of Partial Pressures
- Dew point
- Dry-bulb temperature
- Evaporative cooling
- Humidity
- Relative humidity
- Wet-bulb temperature
- Operative temperature
References
- ↑ Henry George Liddell, Robert Scott, "psychron", A Greek-English Lexicon
- ↑ Henry George Liddell, Robert Scott, "metron", A Greek-English Lexicon
- ↑ p 25
- ↑ World Meteorological Organisation. (2008) Guide to Meteorological Instruments and Methods Of Observation. WMO-8. Seventh edition. Chapter 2, Measurement of Temperature.
- ↑ "AMS Weather Glossary". American Meteorological Society. Retrieved 18 September 2011.
- ↑ http://www.che.iitb.ac.in/courses/uglab/manuals/coollabmanual.pdf, accessed 20080408
- ↑ http://www.probec.org/fileuploads/fl120336971099294500CHAP12_Dryers.pdf, accessed 20080408
- ↑ http://www.engin.umich.edu/class/che360/coursepack/ch13-cooltower.doc
- ↑ Gatley, D.P. (2004). "Psychrometric chart celebrates 100th anniversary" (PDF). ASHRAE Journal. 46 (11): 16–20.
- ↑ Kutz, Myer (Ed). (2006) The Mechanical Engineers’ Handbook. New Jersey: John Wiley & Sons.
- ↑ American Society of Heating, Refrigerating and Air-Conditioning Engineers (1997). ASHRAE Fundamentals Handbook
- ↑ Biasca, Karyn. "Psychrometric Chart Tutorial", accessed November 20, 2010.
- ↑ Mollier, R. 1923. "Ein neues diagram für dampfluftgemische." ZVDI 67(9)
- ↑ Todorovic, B., ASHRAE Transactions DA-07-024 (113-1), 2007
External links
- Western Cooling Efficiency Center Psych: An Open Source Psychrometric Plug-in for Microsoft Excel by Kevin Brown.
- Psychrometric Chart Software Digital version of Psychrometric Chart for easy HVAC calculations.
- Xchanger Inc, webpage Calculator for humidity, dew point, mass flows & heat flux for variable pressure systems with compressors, blowers, vacuum pumps and heat exchangers.
- Psychrometric Chart - Detailed psychrometric chart including curves for enthalpy, air mass, and water mass.
- American Society of Heating, Refrigerating and Air-Conditioning Engineers, Inc.
- Universal Industrial Gases, Inc. webpage - Links to physical properties tables, to psychrometric charts that depict inter-relationships among the various physical properties of air, to online psychrometric properties calculators for easy calculation of properties, and to individual gas information pages.
- Corwin's Calculators Calculator for humidity, dew point.
- Anatomy of the Psychrometric chart, from educate-sustainability.eu
- Psychrogen Psychrometric Charts, Calculators
- Psychrometric Online & Desktop Psychrometric Calculator for easy Psychrometric Calculations and much more ......
- How to read and use a psychrometric chart
- Free Online Interactive Psychrometric Chart