Progressivity in United States income tax
In general, the United States federal income tax is progressive, as rates of tax generally increase as taxable income increases, at least with respect to individuals that earn wage income. As a group, the lowest earning workers, especially those with dependents, pay no income taxes and may actually receive a small subsidy from the federal government (from child credits and the Earned Income Tax Credit).[1]
"Progressivity" as it pertains to tax is usually defined as meaning that the higher a person's level of income, the higher a tax rate that person pays. In the mid-twentieth century, marginal tax rates (the rate applied to the last bit of income) in the United States and United Kingdom exceeded 90%. As recently as the late 1970s, the top marginal tax rate in the U.S. was 70%. In the words of Piketty and Saez, "... the progressivity of the U.S. federal tax system at the top of the income distribution has declined dramatically since the 1960s".[3] They continue, "... the most dramatic changes in federal tax system progressivity almost always take place within the top 1 percent of income earners, with relatively small changes occurring below the top percentile."
Progressivity, then, is a complex topic which does not lend itself to simple analyses. Given the "flattening" of tax burden that occurred in the early 1980s, many commentators note that the general structure of the U.S. tax system has begun to resemble a partial consumption tax regime.[4]
Tax distribution


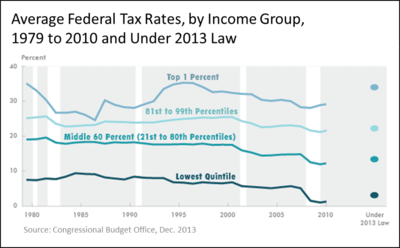
As of 2010, there were 118.7 million taxpaying households in the United States.[6] The median marginal federal income tax rate is 15%.[7] In addition, there are numerous other federal taxes and transfers that affect one's net tax burden, including federal payroll taxes (both employer share and employees share), Corporate Income Taxes, Excises Taxes, Estate and Gift Taxes, Customs Duties and Miscellaneous Receipts. According to the Congressional Budget Office (CBO), the median taxpayer in the United States has had an effective overall federal tax burden that has declined from 19.14% of Before-Tax Income in 1979 to 11.20% of Before-Tax Income as of 2010. When simply comparing Market Income to After Tax Income, due to Government Transfers the Net Federal Tax burden of the median taxpayer has declined from 13.94% in 1979 to -8.76% in 2010 - this metric became negative for the first time in 2008.
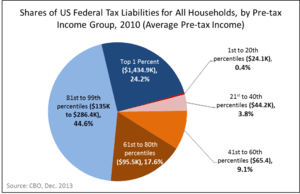
The CBO report in 2013 shows the share of federal taxes paid by taxpayers of various income levels. The data shows the progressive tax structure of the U.S. federal income tax system on individuals that reduces the tax incidence of people with smaller incomes, as they shift the incidence disproportionately to those with higher incomes. The data is presented in two forms, based on Market Income and based on Before-Tax Income. Before-Tax Income is defined as Market Income plus Government Transfers. Government Transfers include direct cash assistance such as from Social Security, unemployment insurance, Supplemental Security Income, Temporary Assistance for Needy Families veterans' programs, workers' compensation, and state and local government assistance programs. Such transfers also include the value of in-kind benefits: Supplemental Nutrition Assistance Program vouchers (popularly known as food stamps); school lunches and breakfasts; housing assistance; and energy assistance and benefits provided by Medicare, Medicaid, and the Children's Health Insurance Program.
While the CBO report does combine transfers to one's income for purposes of calculating Before-Tax Income, it does not net out Government Transfers from one's tax liability for purposes of calculating rates based on Market Income. While presentation of income strata based on Before-Tax Income may be technically correct, there are certain unintuitive outcomes; based on the Before-Tax Income metric, an individual with severe health issues that subsists purely on Government Transfers may be considered part of the top one percent of income earners if his healthcare costs exceed the minimum threshold. Based on the data provided by the CBO, the resulting Net Tax liability as compared to income is presented in the accompanying charts. As of 2010, the bottom 99% by Market Income taken as a group had a negative Net Federal Tax burden, while the top 1 percent by Market Income paid in the aggregate 101% of Net Federal Taxes.
If the federal taxation rate is compared with the wealth distribution rate, the net wealth (not only income but also including real estate, cars, house, stocks, etc.) distribution of the United States does almost coincide with the share of income tax - the top 1% pay 36.9% of federal tax (wealth 32.7%), the top 5% pay 57.1% (wealth 57.2%), top 10% pay 68% (wealth 69.8%), and the bottom 50% pay 3.3% (wealth 2.8%).[8]
Other taxes in the United States have a less progressive structure or a regressive structure, and legal tax avoidance loopholes change the overall tax burden distribution. For example, the payroll tax system (FICA), a 12.4% Social Security tax on wages up to $117,000 (for 2013) and a 2.9% Medicare tax (a 15.3% total tax that is often split between employee and employer) is called a regressive tax on income with no standard deduction or personal exemptions but in effect is forced savings which return to the payer in the form of retirement benefits and health care. The Center on Budget and Policy Priorities states that three-fourths of U.S. taxpayers pay more in payroll taxes than they do in income taxes.[9]
The National Bureau of Economic Research has concluded that the combined federal, state, and local government average marginal tax rate for most workers to be about 40% of income.[10][11]
Income taxes
| Income Category |
2012 AGI | Percentage of All AGI |
Percentage of Income Tax Paid |
|---|---|---|---|
| Top 1% | Over $464,682 | 22% | 38% |
| Top 5% | Over $175,817 | 37% | 59% |
| Top 10% | Over $125,195 | 48% | 70% |
| Top 25% | Over $73,354 | 69% | 86% |
| Top 50% | Over $36,055 | 89% | 97% |
| Bottom 50% | Under $36,055 | 11% | 3% |
Progressivity in the income tax is accomplished mainly by establishing tax "brackets" - branches of income that are taxed at progressively higher rates. For example, for tax year 2006 an unmarried person with no dependents will pay 10% tax on the first $7,550 of taxable income. The next $23,100 (i.e. taxable income over $7,550, up to $30,650) is taxed at 15%. The next $43,550 of income is taxed at 25%.
Additional brackets of 28%, 33%, 35% and 39.6% apply to higher levels of income. So, if a person has $50,000 of taxable income, his next dollar of income earned will be taxed at 25% - this is referred to as "being in the 25% tax bracket," or more formally as having a marginal rate of 25%. However, the tax on $50,000 of taxable income figures to $9,058. This being 18% of $50,000, the taxpayer is referred to as having an effective tax rate of 18%. Starting in 2013, high income households will also pay an additional medicare surcharge of 0.9% on earned income, and 3.8% on investment income.[13]
The US federal tax system also includes deductions for state and local taxes for lower income households which mitigates what are sometimes regressive taxes, particularly property taxes. Higher income households are subject to the Alternative Minimum Tax that limits deductions and sets a flat tax rate of 26% to 28% with the higher rate commencing at $175,000 in income. There are also deduction phaseouts starting at $112,500 for single filers. The net effect is increased progressivity that completely limits deductions for state and local taxes and certain other credits for individuals earning more than $306,300.[14]
Effective income tax rates
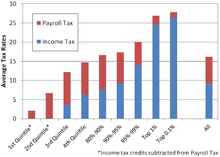
| Quintile | Average Income Before Taxes | Effective Income and Payroll Tax Rate | Income from Capital Gains, Interest and Dividends |
|---|---|---|---|
| Lowest | $18,400 | 2.0% | 1.3% |
| Second | $42,500 | 9.1% | 1.6% |
| Middle | $64,500 | 12.7% | 2.5% |
| Fourth | $94,100 | 15.7% | 3.7% |
| Highest | $264,700 | 20.1% | 21.4% |
| Top 10% | $394,500 | 20.7% | 26.7% |
| Top 5% | $611,200 | 20.9% | 32.1% |
| Top 1% | $1,873,000 | 20.6% | 43.4% |
| Top 400[16] | $344,831,528* | 16.6% | 81.3% |
| *Adjusted Gross Income | |||
While the top marginal tax rate on ordinary income is 35 percent, average rates that a household in the upper income bracket pays is less. Much of the earnings of those in the top income bracket come from capital gains, interest and dividends, which are taxed at 15 percent. Also because only income up to $106,800 is subject to payroll taxes of 15.3%, which are paid by the employer and employee, individuals in the upper income bracket pay on average an effective rate not much different than that of other income brackets.[15]
The effective tax rate paid by an individual in the upper income bracket is highly dependent on the ratio of income they earn from capital gains, interest and dividends.[15] As discussed in a Wall Street Journal article, the effective tax rate of income tax directly paid may differ from the effective economic incidence. When all taxes paid to local, state, and federal government are included, low, middle, and high income groups pay a similar share of their income to government. The article, using 2011 estimates of total income received versus total taxes paid, reported that the lowest 20% in income paid 2.1% of total taxes while receiving 3.4% of income. The middle 20% paid 10.3% of taxes while getting 11.4% of the income, and the top 1%, those with yearly incomes averaging $1,371,000, paid 21.6% of taxes while getting 21% of total income. Across eight income groups whose data were reported, the largest difference between total taxes paid and total income received was just 1.7 percentage points.
Capital gains taxes
In recent years, a reduction in the tax rates applicable to capital gains and received dividends payments, has significantly reduced the tax burden on income generated from savings and investing. An argument is often made that these types of income are not generally received by low-income taxpayers, and so this sort of "tax break" is anti-progressive. Further clouding the issue of progressivity is that far more deductions and tax credits are available to higher-income taxpayers.
A taxpayer with $40,000 of wage income may only have the "standard" deductions available to him, whereas a taxpayer with $200,000 of wage income might easily have $50,000 or more of "itemized" deductions. Allowable itemized deductions include payments to doctors, premiums for medical insurance, prescription drugs and insulin expenses, state taxes paid, property taxes, and charitable contributions. In those two scenarios, assuming no other income, the tax calculations would be as follows for a single taxpayer with no dependents in 2006:
| Wage income | $40,000 | $200,000 |
| Allowable deductions | 8,450 | 51,430 |
| Taxable income | 31,550 | 148,570 |
| Income tax | 4,445 | 46,725 |
| Statutory rate | 14% | 31% |
This would appear to be highly progressive - the person with the higher taxable income pays tax at twice the rate. However, if you divide the tax by the amount of gross income (i.e., before deductions), the effective rates are 11% and 23%: the higher income person's rate is still twice as high, but his deductions drive down the effective rate more quickly ((14%-11%)/14% = a 21.4% effective tax rate savings or discount at the low income bracket; (31%-23%)/31% = a 29% effective tax rate savings or discount at the higher income tax bracket).
To make the two tax rates realize an equal savings or discount from taking the maximum allowable deductions, the higher income tax bracket would have to have an effective tax rate of ~24.35% (31%-24.35%/31% = 21.4% or the same discount as the lower tax bracket) instead of 23%. This would necessitate an additional income tax of $1,975 from the higher tax bracket ($200,000*24.35% [new and equal effective tax rate] = $48,700), or an extra 0.99% in this model.
FICA taxes
Discussions of income tax progressivity often do not factor the payroll taxes (FICA - social security and medicare taxes), which have a "ceiling". This is because these insurance benefits are directly determined by individual contributions over that individual's lifetime. Thus, since payroll taxes serve as direct individual premiums for direct individual benefits, most do not include these taxes in the calculation of the progressive nature of federal taxes, just as they do not include similar private automobile, homeowners, and life insurance policy premiums. Another factor is that the social benefits themselves are paid in a progressive nature; individuals with lower lifetime average wages receive a larger benefit (as a percentage of their lifetime average wage income) than do individuals with higher lifetime average wages.[17][18] However, if one were to expand the tax distribution example to include social security insurance taxes:
| Social security tax | $3,060 | $8,740 |
| Total tax | 7,505 | 55,465 |
| Rate paid on gross income | 19% | 28% |
Some lower income individuals pay a proportionately higher share of payroll taxes for Social Security and Medicare than do some higher income individuals in terms of the effective tax rate. All income earned up to a point, adjusted annually for inflation ($106,800 for the year 2010) is taxed at 7.65% (consisting of the 6.2% Social Security tax and the 1.45% Medicare tax) on the employee with an additional 7.65% in tax incurred by the employer. The annual limitation amount is sometimes called the "Social Security tax wage base amount" or "Contribution and Benefit Base." Above the annual limit amount, only the 1.45% Medicare tax is imposed.
In terms of the effective rate, this means that a worker earning $20,000 for 2010 pays at an effective rate of 7.65% (i.e., $20,000 x 7.65% = $1,530.00), while a worker earning $200,000 pays at an effective rate of only about 4.76% (i.e., the 7.65% rate is multiplied by $106,800, not by $200,000, resulting in a tax of $8,170.20, plus the $1,351.40 tax, at 1.45%, on the remaining $93,200, for a total tax of $9,521.60, which is about 4.7608% of $200,000).
When an individual's Social Security benefit is calculated, income in excess of each year's Social Security Tax wage base amount is disregarded for purposes of the calculation of future benefits. Although some lower income individuals pay a proportionately higher share of payroll taxes than do higher income individuals in terms of the "effective tax rate", the lower income individuals also receive a proportionately higher share of Social Security benefits than do some higher income individuals, since the lower income individuals will receive a much higher income replacement percentage in retirement than higher income individuals affected by the Social Security tax wage base cap.
If the higher income individuals want to receive an income replacement percentage in retirement that is similar to the income replacement percentage that lower income individuals receive from Social Security, higher income individuals must achieve this through other means such as 401(k)s, IRAs, defined benefit pension plans, personal savings, etc. As a percentage of income, some higher income individuals receive less from Social Security than do lower income individuals.
Effect on income inequality
According to the CBO, U.S. federal tax policies substantially reduce income inequality measured after taxes. Taxes became less progressive (i.e., they reduced income inequality relatively less) measured from 1979 to 2011. The tax policies of the mid-1980s were the least progressive period since 1979. Government transfer payments contributed more to reducing inequality than taxes.[19]
Breakdowns
These tables show the share of taxes, and effective tax rate, for each quintile of household income.
In addition to the income tax and payroll tax, computations of the tax burden of each segment of the population usually contain estimates of taxes that people do not pay by themselves directly. An example is the corporate income tax, which may be thought of as indirectly taxing the corporation's customers (through higher prices) or its owners (through lower dividends or profits). Another example is excise taxes, e.g. on gasoline, which may be paid from throughout the economy without recording individual contributions.
The Congressional Budget Office computes household taxes as the sum of income tax, payroll tax, corporate income tax, and excise taxes. It attributes corporate taxes to households "according to their share of capital income" and apportions excise taxes "according to their consumption of the taxed good or service."[20] The CBO report shows each part of the taxes (income, payroll, corporate and excise) separately in addition to showing the totals we report here.
Tax burden by income bracket
The Congressional Budget Office breaks down the 2007 share of the tax burden according to each segment of the population as follows:[20]
- The highest quintile in total earned 55.9% of all income. It paid 86.0% of federal income taxes and 68.9% of all federal taxes
- The top 1% earned 19.4% of all income. It paid 39.5% of income taxes and 28.1% of all federal taxes
- The next 4% earned 12.9% of income. It paid 21.5%. of income taxes and 16.2% of all federal taxes
- The next 5% earned 9.7% of income. It paid 11.7% of income taxes and 10.7% of all federal taxes
- The next 10% earned 13.9% of income. It paid 13.3% of income taxes and 13.9% of all federal taxes.
- The fourth quintile earned 19.3% of income. It paid 12.7% of income taxes and 16.5 of all federal taxes.
- The third quintile earned 13.1% of income. It paid 4.6% of income taxes and 9.2% of all federal taxes.
- The second quintile earned 8.4%. It paid a net -0.3% of income taxes, meaning in aggregate this quintile received slightly more back in income tax credits than it paid in income taxes. It paid 4.4% of all federal taxes.
- The lowest quintile earned 4.0% of all income and received a net -3.0% income tax credits. It paid 1.0% of all federal taxes.
Tax burden by household income
| Household Income Percentile (2007 CBO data) |
Share of Earnings |
Share of Federal Income Tax |
Tax Rate for Income Tax |
Share of All Federal Taxes |
Tax Rate incl. All Federal Taxes | |||||
|---|---|---|---|---|---|---|---|---|---|---|
| Top 1% | 19.4% | 55.9% | 38.5% | 86.0% | 19.0% | 23.2% | 28.1% | 68.9% | 29.5% | 25.1% |
| 95%–98% | 12.9% | 21.5% | na | 16.2% | na | |||||
| 90%–94% | 9.7% | 11.7% | na | 10.7% | na | |||||
| 80%–89% | 13.9% | 13.3% | na | 13.9% | na | |||||
| 60–79% | 19.3% | 12.7% | 6.2% | 16.5% | 17.4% | |||||
| 40–59% | 13.1% | 4.6% | 3.3% | 9.2% | 14.3% | |||||
| 20–39% | 8.4% | −0.3% | −0.4% | 4.4% | 10.6% | |||||
| 0–19% | 4.0% | −3.0% | −6.8% | 1.0% | 4.0% | |||||
The Tax Foundation produced a similar breakdown for 1991 to 2004. Its computation of comprehensive household income consisted of both market-based income and the net value of government transfer payments, the latter are not part of the CBO's definition. In this report the top quintile earned 41.5% and paid 48.8% of total taxes. The fourth quintile earned 21.0% and paid 22.4%. The third quintile earned 15.4% and paid 14.8%. The second quintile earned 12.2% and paid 9.6%. The lowest quintile earned 9.8% and paid 4.3% of total taxes.[21]
| Percentile (1991 to 2004 Tax Foundation data) |
Income (incl. govt. transfers) |
Federal Tax Share (incl. Social Security) |
State and Local Tax Share | Total Tax Share (incl. Fed, State, Local) |
Total Tax Rate (incl. Fed, State, Local) |
|---|---|---|---|---|---|
| 80%–100% | 41.5% | 52.8% | 41.4% | 48.8% | 34.5% |
| 60–79% | 21.0% | 22.2% | 22.7% | 22.4% | 31.3% |
| 40–59% | 15.4% | 14.1% | 16.3% | 14.8% | 28.2% |
| 20–39% | 12.2% | 8.3% | 12.2% | 9.6% | 23.2% |
| 0–19% | 9.8% | 2.6% | 7.5% | 4.3% | 13.0% |
References
- 1 2 3 "The Distribution of Household Income and Federal Taxes, 2010". The US Congressional Budget Office (CBO). 2013-12-04. Retrieved 2014-01-06.
- ↑ Lowrey, Annie (2013-01-04). "Tax Code May Be the Most Progressive Since 1979". The New York Times. Retrieved 2014-01-06.
- ↑ Piketty, T.; Saez, E. (Winter 2007). "How Progressive is the US Federal Tax System?" (PDF). Journal of Economic Perspectives. 21 (1): 3–24. doi:10.1257/jep.21.1.3, quote from p. 22 in the conclusion.
- ↑ Consumption tax, Tax Policy Center Archived February 26, 2007, at the Wayback Machine.
- ↑ "T13-0174 - Average Effective Federal Tax Rates by Filing Status; by Expanded Cash Income Percentile, 2014". Tax Policy Center. Jul 25, 2013. Retrieved 3 November 2013.
- ↑ , Congressional Budget Office
- ↑ "Effective Marginal Tax Rates on Labor Income, Table 2." (PDF). Retrieved 2010-07-27.
- ↑ Kennickell, Arthur (March 2003). "A Rolling Tide: Changes in the Distribution of Wealth in the U.S., 1989-2001" (PDF). United States Federal Reserve. Retrieved 2007-09-19.
- ↑ Kamin, David; Shapiro, Isaac (2004-09-13). "Studies Shed New Light on Effects of Administration's Tax Cuts". Center on Budget and Policy Priorities. Retrieved 2006-07-23.
- ↑ Burns, Scott (2007-02-21). "Your real tax rate: 40%". MSN Money. Retrieved 2008-03-13.
- ↑ Friedman, Milton; Friedman, Rose (1980). Free to choose. Harcourt. ISBN 978-0-15-633460-0.
- ↑ McCormally, Kevin (2010-12-18). "Where Do You Rank as a Taxpayer?". Kiplinger. Retrieved 2010-06-18.
- ↑ Lowrey, Annie (2013-01-04). "Tax Code May Be the Most Progressive Since 1979". The New York Times. Retrieved 2014-02-03.
- ↑ 26 USC 55. Also see IRS Form 6251 (individuals) and Form 4626 (corporations).
- 1 2 3 "Effective Income Tax Rates". The New York Times. 2012-01-17.
- ↑ Internal Revenue Service. "The 400 Individual Income Tax Returns Reporting the Highest Adjusted Gross Incomes Each Year, 1992-2008" (PDF): 10 (avg. adjusted gross income = $57,311,000 avg. tax amount/ 16.6% avg tax rate = $344,831,528); pp. 2–3 (7.85% interest + 7.11% dividends + 66.29% capital gains = 81.25%). Retrieved 29 February 2012.
- ↑ Is Social Security Progressive? by the Congressional Budget Office, retrieved July 23, 2008
- ↑ Top Ten Facts on Social Security's 70th Anniversary by Jason Furman, Center on Budget and Policy Priorities. Retrieved July 23, 2008
- 1 2 "The Distribution of Household Income and Federal Taxes 2011". Congressional Budget Office, US Government. November 2014.
- 1 2 "Average Federal Tax Rates for All Households, by Comprehensive Household Income Quintile, 1979-2007" (PDF). Congressional Budget Office.
- ↑ Chamberlain, Andrew; Prante, Gerald (March 2007), Who Pays Taxes and Who Receives Government Spending? An Analysis of Federal, State and Local Tax and Spending Distributions, 1991-2004 (PDF), Tax Foundation Working Paper, 1, Tax Foundation