Production–possibility frontier
A production–possibility frontier (PPF) or production possibility curve (PPC) is a graphical representation of possible combination of two goods with constant resources and technology.
It is a graph representing production tradeoffs of an economy given fixed resources. In its microeconomic applications, the graph shows the various combinations of amounts of two commodities that an economy can produce per unit of time (such as number of guns vs. kilograms of butter) using a fixed amount of each of the factors of production, given the production technologies available.
At the macroeconomic level, it can be used to depict other rivalrous trade-offs like production of fixed capital versus production of consumer goods. Graphically bounding the production set for fixed input quantities, the PPF curve shows the maximum possible production level of one commodity for any given production level of the other, given the existing state of technology.
By doing so, it defines productive efficiency in the context of that production set: a point on the frontier indicates efficient use of the available inputs, and a point beneath the curve indicates inefficiency. The commodities compared can be goods or services. The combination represented by the point on the PPF where an efficient economy operates shows the priorities or choices of the economy, such as the choice of producing more capital goods and fewer consumer goods, or vice versa.
PPFs are normally drawn as bulging upwards or outwards from the origin ("concave" when viewed from the origin), but they can be represented as bulging downward (inwards) or linear (straight), depending on a number of factors. A PPF illustrates a number of economic concepts, such as scarcity of resources (the fundamental economic problem that all societies face), opportunity cost (or marginal rate of transformation), productive efficiency, allocative efficiency, and economies of scale.
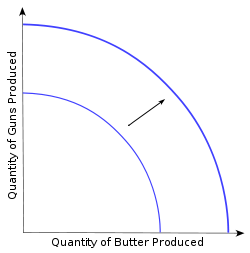
An outward shift of the PPF results from growth of the availability of inputs, such as physical capital or labour or technological progress in knowledge of how to transform inputs into outputs. Such a shift reflects economic growth of an economy already operating at its full productivity (on the PPF), which means that more of both outputs can be produced during the specified period of time without sacrificing the output of either good. Conversely, the PPF will shift inward if the labor force shrinks, the supply of raw materials is depleted, or a natural disaster decreases the stock of physical capital.
However, most economic contractions reflect not that less can be produced but that the economy has started operating below the frontier, as typically, both labor and physical capital are underemployed.
Indicators
Efficiency
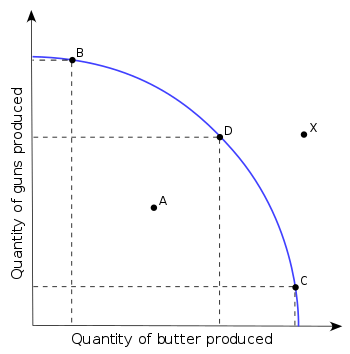
A PPF (production possibility frontier) typically takes the form of the curve illustrated on the right. An economy that is operating on the PPF is said to be efficient, meaning that it would be impossible to produce more of one good without decreasing production of the other good. In contrast, if the economy is operating below the curve, it is said to be operating inefficiently because it could reallocate resources in order to produce more of both goods or some resources such as labor or capital are sitting idle and could be fully employed to produce more of both goods.
For example, if one assumes that the economy's available quantities of factors of production do not change over time and that technological progress does not occur, if the economy is operating on the PPF, production of guns would need to be sacrificed to produce more butter.[1] If production is efficient, the economy can choose between combinations (points) on the PPF: B if guns are of interest, C if more butter is needed, D if an equal mix of butter and guns is required.[1]
In the PPF, all points on the curve are points of maximum productive efficiency (no more output of any good can be achieved from the given inputs without sacrificing output of some good); all points inside the frontier (such as A) can be produced but are productively inefficient; all points outside the curve (such as X) cannot be produced with the given, existing resources.[2] Not all points on the curve are Pareto efficient, however; only in the case where the marginal rate of transformation is equal to all consumers' marginal rate of substitution and hence equal to the ratio of prices will it be impossible to find any trade that will make no consumer worse off.[3]
Any point that lies either on the production possibilities curve or to the left of it is said to be an attainable point: it can be produced with currently available resources. Points that lie to the right of the production possibilities curve are said to be unattainable because they cannot be produced using currently available resources. Points that lie strictly to the left of the curve are said to be inefficient, because existing resources would allow for production of more of at least one good without sacrificing the production of any other good. An efficient point is one that lies on the production possibilities curve. At any such point, more of one good can be produced only by producing less of the other. [4]
Such a two-good world is a theoretical simplification because of the difficulty of graphical analysis of multiple goods. If we are interested in one good, a composite score of the other goods can be generated using different techniques.[5][6] Furthermore, the production model can be generalised using higher-dimensional techniques such as Principal Component Analysis (PCA) and others.[7]
Opportunity cost
From a starting point on the frontier, if there is no increase in productive resources, increasing production of a first good entails decreasing production of a second, because resources must be transferred to the first and away from the second. Points along the curve describe the tradeoff between the goods. The sacrifice in the production of the second good is called the opportunity cost (because increasing production of the first good entails losing the opportunity to produce some amount of the second). Opportunity cost is measured in the number of units of the second good forgone for one or more units of the first good.[1]
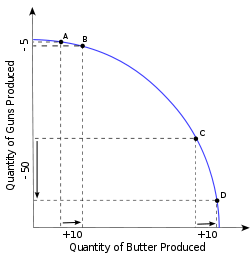
In the context of a PPF, opportunity cost is directly related to the shape of the curve (see below). If the shape of the PPF curve is a straight-line, the opportunity cost is constant as production of different goods is changing. But, opportunity cost usually will vary depending on the start and end points. In the diagram on the right, producing 10 more packets of butter, at a low level of butter production, costs the loss of 5 guns (shown as a movement from A to B). At point C, the economy is already close to its maximum potential butter output. To produce 10 more packets of butter, 50 guns must be sacrificed (as with a movement from C to D). The ratio of gains to losses is determined by the marginal rate of transformation.
Marginal rate of transformation
The slope of the production–possibility frontier (PPF) at any given point is called the marginal rate of transformation (MRT). The slope defines the rate at which production of one good can be redirected (by reallocation of productive resources) into production of the other. It is also called the (marginal) "opportunity cost" of a commodity, that is, it is the opportunity cost of X in terms of Y at the margin. It measures how much of good Y is given up for one more unit of good X or vice versa. The shape of a PPF is commonly drawn as concave to the origin to represent increasing opportunity cost with increased output of a good. Thus, MRT increases in absolute size as one moves from the top left of the PPF to the bottom right of the PPF.[8]
The marginal rate of transformation can be expressed in terms of either commodity. The marginal opportunity costs of guns in terms of butter is simply the reciprocal of the marginal opportunity cost of butter in terms of guns. If, for example, the (absolute) slope at point BB in the diagram is equal to 2, to produce one more packet of butter, the production of 2 guns must be sacrificed. If at AA, the marginal opportunity cost of butter in terms of guns is equal to 0.25, the sacrifice of one gun could produce four packets of butter, and the opportunity cost of guns in terms of butter is 4.
Shape
The production-possibility frontier can be constructed from the contract curve in an Edgeworth production box diagram of factor intensity.[9] The example used above (which demonstrates increasing opportunity costs, with a curve concave to the origin) is the most common form of PPF.[10] It represents a disparity, in the factor intensities and technologies of the two production sectors. That is, as an economy specializes more and more into one product (such as moving from point B to point D), the opportunity cost of producing that product increases, because we are using more and more resources that are less efficient in producing it. With increasing production of butter, workers from the gun industry will move to it. At first, the least qualified (or most general) gun workers will be transferred into making more butter, and moving these workers has little impact on the opportunity cost of increasing butter production: the loss in gun production will be small. However, the cost of producing successive units of butter will increase as resources that are more and more specialized in gun production are moved into the butter industry.[11]
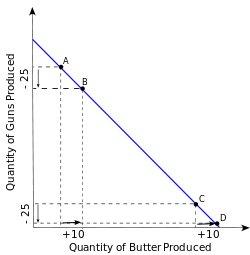
If opportunity costs are constant, a straight-line (linear) PPF is produced.[12] This case reflects a situation where resources are not specialised and can be substituted for each other with no added cost.[11] Products requiring similar resources (bread and pastry, for instance) will have an almost straight PPF and so almost constant opportunity costs.[11] More specifically, with constant returns to scale, there are two opportunities for a linear PPF: if there was only one factor of production to consider or if the factor intensity ratios in the two sectors were constant at all points on the production-possibilities curve. With varying returns to scale, however, it may not be entirely linear in either case.[13]
With economies of scale, the PPF would curve inward, with the opportunity cost of one good falling as more of it is produced. Specialization in producing successive units of a good determines its opportunity cost (say from mass production methods or specialization of labor).[14]

Position
The two main determinants of the position of the PPF at any given time are the state of technology and management expertise (which are reflected in the available production functions) and the available quantities of factors of production (materials, direct labor, and factory overhead).
Only points on or within a PPF are actually possible to achieve in the short run. In the long run, if technology improves or if the supply of factors of production increases, the economy's capacity to produce both goods increases; if this potential is realized, economic growth occurs. That increase is shown by a shift of the production-possibility frontier to the right. Conversely, a natural, military or ecological disaster might move the PPF to the left in response to a reduction in an economy's productive capability.[1] Thus all points on or within the curve are part of the production set: combinations of goods that the economy could potentially produce.
If the two production goods depicted are capital investment (to increase future production possibilities) and current consumption goods, the higher is investment this year, the more the PPF would shift out in following years.[15] Shifts of the curve can represent how technological progress that favors production possibilities of one good, say guns, more than the other shifts the PPF outwards more along the favored good's axis, "biasing" production possibilities in that direction. Similarly, if one good makes more use of say capital and if capital grows faster than other factors, growth possibilities might be biased in favor of the capital-intensive good.[16][17]
Other applications
In microeconomics, the PPF shows the options open to an individual, household, or firm in a two-good world. By definition, each point on the curve is productively efficient, but, given the nature of market demand, some points will be more profitable than others. Equilibrium for a firm will be the combination of outputs on the PPF that is most profitable.[18]
From a macroeconomic perspective, the PPF illustrates the production possibilities available to a nation or economy during a given period of time for broad categories of output. It is traditionally used to show the movement between committing all funds to consumption on the y-axis versus investment on the x-axis. However, an economy may achieve productive efficiency without necessarily being allocatively efficient. Market failure (such as imperfect competition or externalities) and some institutions of social decision-making (such as government and tradition) may lead to the wrong combination of goods being produced (hence the wrong mix of resources being allocated between producing the two goods) compared to what consumers would prefer, given what is feasible on the PPF.[19]
Notes
- 1 2 3 4 Lipsey, Richard G. An introduction to positive economics (fourth ed.). Weidenfeld & Nicolson. pp. 57–8. ISBN 0-297-76899-9.
- ↑ Standish, Barry. Economics: Principles and Practice. South Africa: Pearson Education. pp. 13–15. ISBN 978-1-86891-069-4.
- ↑ Varian, Hal (2006). Intermediate Microeconomics (7th ed.). W. W. Norton. pp. 605–606.
- ↑ other, Attainable. Principles of Microeconomics. Canada: McGraw-Hill Ryerson Limited. p. 37. ISBN 978-0-07-040144-0.
- ↑ Samuelson, Paul A. (1947). Foundations of Economic Analysis. Cambridge, MA: Harvard University Press. ISBN 0-674-31300-3.
- ↑ Chacholiades, Miltiades (1986). Microeconomics. New York: Macmillan. p. 97. ISBN 0-02-320560-1.
- ↑ Ferguson, C. E. (1972). Microeconomic Theory (3rd ed.). Homewood, Illinois: Richard D. Irwin, Inc. pp. 458–465. ISBN 0-256-02157-0.
- ↑ Pindyck, Robert S.; Rubinfeld, Daniel L. (2005). Microeconomics. Pearson Education. ISBN 0-13-713335-9.
- ↑ Stolper, Wolfgang F.; Samuelson, Paul A. (1941). "Protection and Real Wages". Review of Economics Studies. The Review of Economic Studies, Vol. 9, No. 1. 9 (1): 58–74. doi:10.2307/2967638. JSTOR 2967638.
- ↑ Barthwal, R. R. (2007). Industrial Economics: An Introductory Text Book. p. 31.
- 1 2 3 Anderson, David. Cracking the AP Economics Macro Micro Exam. Princeton Review. pp. 37–8. ISBN 978-0-375-76384-7.
- ↑ Hall, Robert Ernest; Lieberman, Marc (2008). Macroeconomics: principles and applications. Mason, OH: Thomson/South-Western. p. 466. ISBN 0-324-42146-X.
- ↑ Choi, Eun Kwan; Harrigan, James (2003). Handbook of international trade. Malden, MA: Blackwell Pub. pp. 192–3. ISBN 0-631-21161-6.
- ↑ Kemp, Murray C.; Herberg, Horst; Long, Ngo van (1993). Trade, welfare, and economic policies: essays in honor of Murray C. Kemp. Ann Arbor: University of Michigan Press. p. 3. ISBN 0-472-10364-4.
- ↑ Samuelson, Paul A., and William D. Nordhaus (2004). Economics. Ch. 1, "Figure 1-5. Investment for Future Consumption Requires Sacrificing Current Consumption."
- ↑ Krugman, Paul R. (2004). International economics: theory and policy (sixth ed.). 清华大学出版社. pp. 100–1. ISBN 978-7-302-07889-0.
- ↑ Gillespie, Andrew (2007). Foundations of Economics, "The production possibility frontier (curve): the PPF or PPC" (press +). Oxford University Press. Access date 6 January 2010 .
- ↑ Coelli, Time; Prasada Rao, D. S.; Battese, George E. (1998). An Introduction to Efficiency and Productivity Analysis. Springer. pp. 59–60. ISBN 978-0-7923-8062-7.
- ↑ Farrell, M. J. (1957). "The Measurement of Productive Efficiency". Journal of the Royal Statistical Society. Journal of the Royal Statistical Society. Series A (General), Vol. 120, No. 3. 120 (3): 253–290. JSTOR 2343100.
References
- Nicholson, Walter (2005). Microeconomic Theory: Basic Principles and Extensions. Thomson/South-western. pp. 339–345. ISBN 0-324-27086-0.
- Samuelson, Paul A. (1967). "Summary on Factor-Price Equalization". International Economic Review. International Economic Review, Vol. 8, No. 3. 8 (3): 286–295. doi:10.2307/2525536. JSTOR 2525536.
- Samuelson, Paul A. (1962). "The Gains from International Trade Once Again". Economic Journal. The Economic Journal, Vol. 72, No. 288. 72 (288): 820–829. doi:10.2307/2228353. JSTOR 2228353.
- Samuelson, Paul A. (1971). "Ohlin Was Right". Swedish Journal of Economics. 73 (4): 365–384. doi:10.2307/3439219. JSTOR 3439219.
- Samuelson, Paul A. (1947, Enlarged ed. 1983). Foundations of Economic Analysis. Ch. VIII for welfare-theoretical mathematical expression of PPF.
- Bator, Francis M. (1957). "The Simple Analytics of Welfare Maximization". American Economic Review. 47 (1): pp. 22–59.
- Martin, John P. (1976). "Variable Factor Supplies and the Heckscher-Ohlin-Samuelson Model". Economic Journal. The Economic Journal, Vol. 86, No. 344. 86 (344): 820–83. doi:10.2307/2231455. JSTOR 2231455.