Price of oil

The price of oil, or the oil price, generally refers to the spot price of a barrel of benchmark crude oil—a reference price for buyers and sellers of crude oil such as West Texas Intermediate (WTI), Brent ICE, Dubai Crude, OPEC Reference Basket, Tapis Crude, Bonny Light, Urals oil, Isthmus and Western Canadian Select (WCS).[1][2] There is a differential in the price of a barrel of oil based on its grade—determined by factors such as its specific gravity or API and its sulphur content—and its location—for example, its proximity to tidewater and/or refineries. Heavier, sour crude oils lacking in tidewater access—such as Western Canadian Select— are less expensive than lighter, sweeter oil—such as WTI.
Organization of the Petroleum Exporting Countries (OPEC)
In 1960 the Organization of the Petroleum Exporting Countries (OPEC) was founded in Baghdad, Iraq by five Founder Members—Islamic Republic of Iran, Iraq, Kuwait, Saudi Arabia and Venezuela—[3][4][5] to try to counter the oil companies cartel, which had been controlling posted prices since the so-called 1927 Red Line Agreement and 1928 Achnacarry Agreement, and had achieved a high level of price stability until 1972.[4] and the world market was dominated by a group of multinational companies known as the "Seven Sisters", five of which were headquartered in the US.[4] By 2016 there were thirteen members:[3][6]
- Algeria
- Angola
- Ecuador
- Indonesia
- Iraq
- Iran
- Kuwait
- Libya
- Nigeria
- Qatar
- Saudi Arabia
- United Arab Emirates
- Venezuela
History
Price history from 2003 onwards
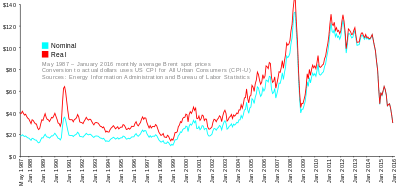
From 1999 til mid 2008, the price of oil rose significantly. It was explained by the rising oil demand in countries like China and India.[7] In the middle of the financial crisis of 2007–2008, the price of oil underwent a significant decrease after the record peak of US$147.27 it reached on July 11, 2008. On December 23, 2008, WTI crude oil spot price fell to US$30.28 a barrel, the lowest since the financial crisis of 2007–2010 began. The price sharply rebounded after the crisis and rose to US$82 a barrel in 2009.[8] In July 2008 oil reached a record peak of US$147.27 but by February 2009 it sank beneath $40 a barrel.[9] On 31 January 2011, the Brent price hit $100 a barrel for the first time since October 2008, on concerns about the political unrest in Egypt.[10] For about three and half years the price largely remained in the $90–$120 range. In the middle of 2014, price started declining due to a significant increase in oil production in USA, and declining demand in the emerging countries.[11] The oil glut—caused by multiple factors—spurred a sharp downward spiral in the price of oil that continued through February 2016.[12] By February 3, 2016 oil was below $30—[13] a drop of "almost 75 percent since mid-2014 as competing producers pumped 1-2 million barrels of crude daily exceeding demand, just as China's economy hit lowest growth in a generation."[14] Some analysts speculate that it may continue to drop further, perhaps as low as $18[15]
According to a report released on February 15, 2016 by Deloitte LLP—the audit and consulting firm—with global crude oil at near ten-year low prices, 35% of listed E&P oil and gas companies are at a high risk of bankruptcy worldwide.[16][17] Indeed, bankruptcies "in the oil and gas industry could surpass levels seen in the Great Recession."[16][18]
The causes of oil price fluctuations
A 2016 survey of the academic literature finds that "most major oil price fluctuations dating back to 1973 are largely explained by shifts in the demand for crude oil".[19] As the global economy expands, so does demand for crude oil.[19] The authors note that the price of oil has also increased at times due to greater "demand for stocks (or inventories) of crude oil... to guard against future shortages in the oil market. Historically, inventory demand has been high in times of geopolitical tension in the Middle East, low spare capacity in oil production, and strong expected global economic growth."[19] In particular, political events can have a strong influence on the oil price. Historical examples include OPEC’s 1973 embargo in reaction to the Yom Kippur War and the 1979 Iranian Revolution. Financial analysts and academics have had very few tools to study such political events compared to what is available on economic aspects of oil price formation.[20] The PRIX index was developed in attempt to fill this gap with a metric on political developments and corresponding export trends from world’s 20 largest oil exporters.[20][21]
The supply of oil is dependent on geological discovery, the legal and tax framework for oil extraction, the cost of extraction, the availability and cost of technology for extraction, and the political situation in oil-producing countries. Both domestic political instability in oil producing countries and conflicts with other countries can destabilise the oil price. In 2008 the New York Times reported, for example, in the 1940s the price of oil was about $17 rising to just over $20 during the Korean War (1951–1953). During the Vietnam War (1950s – 1970s) the price of oil slowly declined to under $20. During the Arab oil embargo of 1973—the first oil shock—the price of oil rapidly rose to double in price. During the 1979 Iranian Revolution the price of oil rose. During the second oil shock the price of oil peaked in April 1980 at $103.76. During the 1980s there was a period of "conservation and insulation efforts" and the price of oil dropped slowly to c. $22. It again reached a peak of c. $65 during the 1990 Persian Gulf crisis and war. Following that, there was a period of global recessions and the price of oil hit a low of c. $15 before it peaked at a high of $45 on September 11, 2001[22] only to drop again to a low of $26 on May 8, 2003.[14] The price rose to $80 with the U.S.-led invasion of Iraq. By March 3, 2008 the price of oil reached $103.95 a barrel on the New York Mercantile Exchange.[22]
Although the oil price is largely determined by the balance between supply and demand—as with all commodities—some commentators including Business Week, the Financial Times and the Washington Post, argued that the rise in oil prices prior to the financial crisis of 2007–2008 was due to speculation in futures markets.[23][24][25][26][27]
Benchmark pricing
In North America this generally refers to the WTI Cushing Crude Oil Spot Price West Texas Intermediate (WTI), also known as Texas Light Sweet, a type of crude oil used as a benchmark in oil pricing and the underlying commodity of New York Mercantile Exchange's oil futures contracts. WTI is a light crude oil, lighter than Brent Crude oil. It contains about 0.24% sulfur, rating it a sweet crude, sweeter than Brent. Its properties and production site make it ideal for being refined in the United States, mostly in the Midwest and Gulf Coast regions. WTI has an API gravity of around 39.6 (specific gravity approx. 0.827) per barrel (159 liters) of either WTI/light crude as traded on the New York Mercantile Exchange (NYMEX) for delivery at Cushing, Oklahoma. Cushing, Oklahoma, a major oil supply hub connecting oil suppliers to the Gulf Coast, has become the most significant trading hub for crude oil in North America.
In Europe and some other parts of the world, the oil price benchmark is Brent as traded on the Intercontinental Exchange (ICE, into which the International Petroleum Exchange has been incorporated) for delivery at Sullom Voe.
Other important benchmarks include Dubai, Tapis, and the OPEC basket. The Energy Information Administration (EIA) uses the imported refiner acquisition cost, the weighted average cost of all oil imported into the US, as its "world oil price".
In Robert Mabro's 2006 book on challenges and opportunities in oil in the 21st century, after the collapse of the OPEC-administered pricing system in 1985, and a short lived experiment with netback pricing, oil-exporting countries adopted a market-linked pricing mechanism.[28] First adopted by PEMEX in 1986, market-linked pricing received wide acceptance and by 1988 became and still is the main method for pricing crude oil in international trade.[28] The current reference, or pricing markers, are Brent, WTI, and Dubai/Oman.[28]
Market listings
Oil is marketed among other products in commodity markets. By 2008 widely traded oil futures, and related natural gas futures, included with most of these oil futures having delivery dates every month:[29][30]
- Petroleum
- Nymex Crude Future
- Dated Brent Spot
- WTI Cushing Spot
- Nymex Heating Oil Future
- Nymex RBOB (Reformulated Blendstock for Oxygenate Blending) Gasoline Future
- Natural gas
- Nymex Henry Hub Future
- Henry Hub Spot
- New York City Gate Spot
Speculation during the 2008 crisis
In June 2008 Business Week reported that the surge in oil prices prior to 2008 had led some commentators to argue that at least some of the rise was due to speculation in the futures markets.[23] However, although speculation can greatly raise the oil price in the short run, in the long run fundamental market conditions will determine the oil price. Storing oil is expensive, and all speculators must ultimately, and generally within a few months, sell the oil they purchase.
According to a U.S. Commodity Futures Trading Commission (CFTC) May 29, 2008 report the "Multiple Energy Market Initiatives" was launched in partnership with the United Kingdom Financial Services Authority and ICE Futures Europe in order to expand surveillance and information sharing of various futures contracts. Part 1 is "Expanded International Surveillance Information for Crude Oil Trading."[27] This announcement has received wide coverage in the financial press, with speculation about oil futures price manipulation.[24][25][26]
The interim report by the Interagency Task Force, released in July, found that speculation had not caused significant changes in oil prices and that fundamental supply and demand factors provide the best explanation for the crude oil price increases. The report found that the primary reason for the price increases was that the world economy had expanded at its fastest pace in decades, resulting in substantial increases in the demand for oil, while the oil production grew sluggishly, compounded by production shortfalls in oil-exporting countries.
The report stated that as a result of the imbalance and low price elasticity, very large price increases occurred as the market attempted to balance scarce supply against growing demand, particularly in the last three years. The report forecast that this imbalance would persist in the future, leading to continued upward pressure on oil prices, and that large or rapid movements in oil prices are likely to occur even in the absence of activity by speculators. The task force continues to analyze commodity markets and intends to issue further findings later in the year.
Oil-storage trade (contango)
The strategy works because oil prices for delivery in the future are trading at a premium to those in the spot market - a market structure known in the industry as contango - with investors expecting prices to eventually recover from the near 60 percent slide in oil in the last seven months.— Reuters 2015
The oil-storage trade, also referred to as contango, a market strategy in which large, often vertically-integrated oil companies purchase oil for immediate delivery and storage—when the price of oil is low— and hold it in storage until the price of oil increases. Investors bet on the future of oil prices through a financial instrument, oil futures in which they agree on a contract basis, to buy or sell oil at a set date in the future. Crude oil is stored in salt mines, tanks and oil tankers.[31]
Investors can choose to take profits or losses prior to the oil-delivery date arrives. Or they can leave the contract in place and physical oil is "delivered on the set date" to an "officially designated delivery point", in the United States, that is usually Cushing, Oklahoma. When delivery dates approach, they close out existing contracts and sell new ones for future delivery of the same oil. The oil never moves out of storage. If the forward market is in "contango"—the forward price is higher than the current spot price—the strategy is very successful.
Scandinavian Tank Storage AB and its founder Lars Jacobsson introduced the concept on the market in early 1990.[32] But it was in 2007 through 2009 the oil storage trade expanded.[33] with many participants—including Wall Street giants, such as Morgan Stanley, Goldman Sachs, and Citicorp—turning sizeable profits simply by sitting on tanks of oil.[34] By May, 2007 Cushing's inventory fell by nearly 35% as the oil-storage trade heated up.[34]
"The trend follows a spike in oil futures prices that has created incentives for traders to buy crude oil and oil products at current rates, sell them on futures markets and store them until delivery."— Financial Post 2009
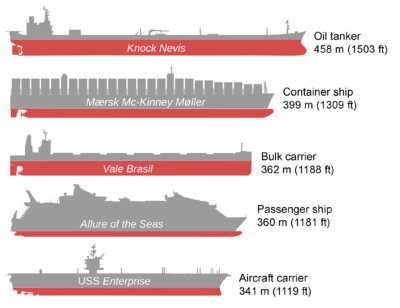
By the end of October 2009 one in twelve of the largest oil tankers was being used more for temporary storage of oil, rather than transportation.[35]
From June 2014 to January 2015, as the price of oil dropped 60 percent and the supply of oil remained high, the world's largest traders in crude oil purchased at least 25 million barrels to store in supertankers to make a profit in the future when prices rise. Trafigura, Vitol, Gunvor, Koch, Shell and other major energy companies began to book booking oil storage supertankers for up to 12 months. By 13 January 2015 At least 11 Very Large Crude Carriers (VLCC) and Ultra Large Crude Carriers (ULCC)" have been reported as booked with storage options, rising from around five vessels at the end of last week. Each VLCC can hold 2 million barrels."[36]
In 2015 as global capacity for oil storage was out-paced by global oil production, and an oil glut occurred. Crude oil storage space became a tradable commodity with CME Group— which owns NYMEX— offering oil-storage futures contracts in March 2015.[31] Traders and producers can buy and sell the right to store certain types of oil.[31]
By 5 March 2015, as oil production outpaces oil demand by 1.5 million barrels a day, storage capacity globally is dwindling. Crude oil is stored in old salt mines, in tanks and on tankers.[31] In the United States alone, according to data from the Energy Information Administration, U.S. crude-oil supplies are at almost 70% of the U. S. storage capacity, the highest to capacity ration since 1935.[31]
Comparative cost of production
In this table based on the Scotiabank Equity Research and Scotiabank Economics report published 28 November 2013,[37] economist Patricia Mohr compares the cost of cumulative crude oil production in the rise of 2013.
| Place | Cost of production in northern hemisphere autumn 2013 |
|---|---|
| Saudi Arabia | US$12–28 per barrel |
| Montney Oil Alberta and British Columbia | US$49 |
| Saskatchewan Bakken | US$57 |
| Eagle Ford, USA Shale+ | US$46–57 (plus Liquids-rich Eagle Ford plays, assuming natural gas prices of US$8.80 per mmbtu) |
| Lloyd & Seal Conventional Heavy, AB | US$60 |
| Conventional Light, Alberta and Saskatchewan | US$57.57 |
| Nebraska USA Shale | US$65.50 |
| SAGD Bitumen Alberta | US$70 |
| North Dakota Bakken, Shale | US$64–79 |
| Permian Basin, TX Shale | US$63–82 |
| Oil sands legacy projects | US$64 |
| Oil sands mining and infrastructure new projects | US$97 |
This analysis "excludes" 'up-front' costs (initial land acquisition, seismic and infrastructure costs): treats 'up-front' costs as 'sunk'. Rough estimate of 'up-front' costs = US$10–15 per barrel, though wide regional differences exist. Includes royalties, which are more advantageous in Alberta and Saskatchewan." The weighted average of US$65-71 includes existing Integrated Oil Sands at C$53 per barrel."[37]
Future projections
Peak oil is the period when the maximum rate of global petroleum extraction is reached, after which the rate of production enters terminal decline. It relates to a long-term decline in the available supply of petroleum. This, combined with increasing demand, will significantly increase the worldwide prices of petroleum derived products. Most significant will be the availability and price of liquid fuel for transportation.
The US Department of Energy in the Hirsch report indicates that "The problems associated with world oil production peaking will not be temporary, and past "energy crisis" experience will provide relatively little guidance."[38] The 2014 United Nations World Economic Situation and Prospects report notes that "Oil prices were on a downward trend in the first half of 2013 (after a spike in January and February caused by geopolitical tensions with Iran), as global demand for oil weakened along with the deceleration in world economic growth overall." [39]
Impact of declining oil price
A major rise or decline in oil price can have both economic and political impacts. The decline on oil price during 1985–1986 is considered to have contributed to the fall of the Soviet Union.[40] Low oil prices could alleviate some of the negative effects associated with the resource curse, such as authoritarian rule[41][42][43][44][45] and gender inequality.[46][47] Lower oil prices could however also lead to domestic turmoil and diversionary war. The reduction in food prices that follows lower oil prices could have positive impacts on violence globally.[48]
Research shows that declining oil prices make oil-rich states less bellicose.[49] Low oil prices could also make oil-rich states engage more in international cooperation, as they become more dependent on foreign investments.[50] The influence of the United States reportedly increases as oil prices decline, at least judging by the fact that "both oil importers and exporters vote more often with the United States in the United Nations General Assembly" during oil slumps.[48]
Lower oil prices lead to greater global trade.[51]
Declining oil prices may boost consumer oriented stocks but may hurt oil-based stocks.[52][53] It is estimated that 17–18% of S&P would decline with declining oil prices.
The oil importing countries like Japan, China or India would benefit, however the oil producing countries would lose.[54][55][56] A Bloomberg article presents results of an analysis by Oxford Economics on the GDP growth of countries as a result of a drop from $84 to $40. It shows the GDP increase between 0.5% to 1.0% for India, USA and China, and a decline of greater than 3.5% from Saudi Arabia and Russia. A stable price of $60 would add 0.5 percentage point to global gross domestic product.[57]
Katina Stefanova has argued that falling oil prices do not imply a recession and a decline in stock prices.[58] Liz Ann Sonders, Chief Investment Strategist at Charles Schwab, had earlier written that that positive impact on consumers and businesses outside of the energy sector, which is a larger portion of the US economy will outweigh the negatives.[59] Taking cues from a legendary oil investor, Harold Hamm, ranked as one of the richest men in the world by Forbes, Shawn Baldwin, Chairman of alternative investment firm The AIA Group, speculates that oil prices will rise by year-end 2016 from current levels.[60]
Oil glut
Economists have observed that the 2015-2016 oil glut also known as 2010s oil glut started with a considerable time-lag, more than six years after the beginning of the Great Recession: "the price of oil [had] stabilized at a relatively high level (around $100 a barrel) unlike all previous recessionary cycles since 1980 (start of First Persian Gulf War). But nothing guarantee[d] such price levels in perpetuity".[61]
During 2014–2015, OPEC members consistently exceeded their production ceiling, and China experienced a marked slowdown in economic growth. At the same time, U.S. oil production nearly doubled from 2008 levels, due to substantial improvements in shale "fracking" technology in response to record oil prices. A combination of factors led a plunge in U.S. oil import requirements and a record high volume of worldwide oil inventories in storage, and a collapse in oil prices that continues into 2016.[62][63][64]
It has also been argued that the collapse in oil prices in 2015 should be very beneficial for developed western economies, who are generally oil importers and aren't over exposed to declining demand from China.[65] In the Asia-Pacific region, exports and economic growth were at significant risk across economies reliant on commodity exports as an engine of growth. The most vulnerable economies were those with a high dependence on fuel and mineral exports to China, such as: Korea DPR, Mongolia and Turkmenistan – where primary commodity exports account for 59–99% of total exports and more than 50% of total exports are destined to China. The decline in China’s demand for commodities also adversely affected the growth of exports and GDP of large commodity-exporting economies such as Australia (minerals) and the Russian Federation (fuel). On the other hand, lower commodity prices led to an improvement in the trade balance – through lower the cost of raw materials and fuels – across commodity importing economies, particularly Cambodia, Kyrgyzstan, Nepal and other remote island nations (Kiribati, Maldives, Micronesia (F.S), Samoa, Tonga, and Tuvalu) which are highly dependent on fuel and agricultural imports [66]
The North Sea oil and gas industry was financially stressed by the reduced oil prices, and called for government support in May 2016.[67]
Hedging as risk management
The use of hedging using commodity derivatives as a risk management tool on price exposure to liquidity and earnings, has been long established in North America. Chief Financial Officers (CFOS) use derivatives to dampen, remove or mitigate price uncertainty.[68] Bankers also use hedge funds to more "safely increase leverage to smaller oil and gas companies."[68] However, when not properly used, "derivatives can multiply losses"[68] particularly in North American where investors are more comfortable with higher levels of risk than in other countries.[68]
With the large number of bankruptcies as reported by Deloitte[18] "funding [for upstream oil industry] is shrinking and hedges are unwinding."[16] "Some oil producers are also choosing to liquidate hedges for a quick infusion of cash, a risky bet."[17]
"Access to capital markets, bankers' support and derivatives protection, which helped smooth an otherwise rocky road, are fast waning...The roughly 175 companies at risk of bankruptcy have more than $150 billion in debt, with the slipping value of secondary stock offerings and asset sales further hindering their ability to generate cash."— John England, Vice-Chairman Deloitte LLP, Statement, February 16, 2016
To finance exploration and production of the unconventional shale oil industry in the United States, "hundreds of billions of dollars of capital came from non-bank participants [non-bank buyers of bank energy credits] in leveraged loans] that were thought at the time to be low risk.[69] However, with the oil glut that continued into 2016, about a third of oil companies are facing bankruptcy.[18] While investors were aware that there was a risk that the operator might declare bankruptcy, they felt protected because "they had come in at the 'bank' level, where there was a senior claim on the assets [and] they could get their capital returned."[68]
By 2012,[68]
"... in recent years the combination of the development of large resource plays in the US and the emergence of business models designed to ensure consistent dividend payouts to investors has led to the development of more aggressive hedging policies in companies and less restrictive covenants in bank loans."— Oil and Gas Financial Journal, 2012
A classic example of taking on too much risk through hedging is the 1982 collapse of Penn Square Bank caused by plummeting of the price of oil in 1981.[69] Penn Square Bank had lent too much to Exploration and Production E&P operators. Penn Square Bank caused the failure of Seafirst in 1982 and then Continental Illinois.[69] When they failed and were liquidated by the Federal Deposit Insurance Corporation (FDIC) the non-bank buyers or participants of bank energy credits of these leveraged loans participants were considered by to be 'unsecured claims,' not 'true sales' and they were not able to collect any capital.[69]
At the 5th annual World Pensions Forum in 2015, Jeffrey Sachs advised institutional investors to divest from carbon-reliant oil industry firms in their pension fund's portfolio.[70]
2015–16 prices: The lows of January 2016
Because of oversupply and lack of agreements between oil-producing countries members of the OPEC (Saudi Arabia in particular, which pumped at world's records) and also because of lack of coordinated efforts between OPEC and Non-OPEC countries (Russian being a big player, refusing to reduce production) the price of oil fell rapidly in 2015 and continued to slide in 2016 causing the cost of WTI crude to fall to a 10-year low of $26.55 on January 20. The average price of oil in January 2016 was well below $35. Oil did not recover until April 2016, when oil went above the $45 mark.
By 20 January 2016, the OPEC Reference Basket was down to US$22.48/bbl—less than one-fourth of its high from June 2014 ($110.48), less than one-sixth of its record from July 2008 ($147.27), and back below the April 2003 starting point ($23.27) of its historic run-up.[64]
See also
References
- ↑ "International Crude Oil Market Handbook", Energy Intelligence Group, 2011
- ↑ "Pricing Differences Among Various Types of Crude Oil". EIA. Retrieved February 17, 2008.
- 1 2 "Our Mission". OPEC. Retrieved 16 February 2013.
- 1 2 3 Yergin, Daniel (1991). The Prize: The Epic Quest for Oil, Money, and Power. New York: Simon & Schuster. pp. 499–503. ISBN 978-0671502485.
- ↑ Painter, David S. (2012). "Oil and the American Century" (PDF). The Journal of American History. 99 (1): 32. doi:10.1093/jahist/jas073.
- ↑ . OPEC http://www.opec.org/opec_web/en/17.htm. Missing or empty
|title=(help) - ↑ Rising Demand for Oil Provokes New Energy Crisis, JAD MOUAWAD, New York Times, November 9, 2007
- ↑ http://tonto.eia.doe.gov/dnav/pet/hist/rwtcd.htm
- ↑ "US oil settles at $37.51 a barrel after hitting 2009 lows". CNCB via Reuters. 8 December 2015. Retrieved 17 February 2016.
- ↑ "BBC News - Egypt unrest pushes Brent crude oil to $100 a barrel". BBC News. January 31, 2011. Retrieved January 5, 2015.
- ↑ Nicole Friedman (31 December 2014). "U.S. Oil Falls 46%, Steepest Yearly Loss Since 2008 - WSJ". WSJ. Retrieved 5 January 2015.
- ↑ Evans-Pritchard, Ambrose (29 December 2015). "Goldman eyes $20 oil as glut overwhelms storage sites". The Telegraph. Retrieved 29 December 2015.
- ↑ "Commodities". Calgary Herald. 3 February 2016. p. C7.
- 1 2 "Oil futures bounce on OPEC deal speculation". CNCB via Reuters. 16 February 2016. Retrieved 17 February 2016.
- ↑ Oil may fall to $18 amid Saudi-Iran tensions: Kilduff, Tom DiChristopher, CNBC, Monday, 4 Jan 2016
- 1 2 3 "Deloitte warns of oil bankruptcies", Globe and Mail via PressReader, February 6, 2016
- 1 2 Scheyder, Ernest (16 February 2016). "High risk of bankruptcy for one-third of oil firms: Deloitte". Houston: Reuters. Retrieved 17 February 2016.
- 1 2 3 Zillman, Claire (16 February 2016). "One-Third of Oil Companies Could Go Bankrupt this Year". Fortune. Retrieved 17 February 2016.
- 1 2 3 Baumeister, Christiane; Kilian, Lutz (2016-01-01). "Forty Years of Oil Price Fluctuations: Why the Price of Oil May Still Surprise Us". The Journal of Economic Perspectives. 30 (1): 139–160. doi:10.1257/jep.30.1.139.
- 1 2 "PRIX index forecasts ample oil supplies". Commodities Now. 2016-06-30.
- ↑ "Quantifying Political Risk". Oil&Gas Financial Journal. 2015-08-07. Retrieved 2015-09-26.
- 1 2 Mouawad, Jad (March 3, 2008), "Oil Prices Pass Record Set in 1980s, but Then Recede", New York Times, retrieved February 17, 2016
- 1 2 Ed Wallace (June 27, 2008). "Oil Prices Are All Speculation". Business Week.
- 1 2 "CFTC in talks to plug the 'London loophole'". The Financial Times. 2008-06-10. Retrieved 2008-06-11.
- 1 2 Mufson, Steven (2008-05-30). "Probe of Crude Oil Trading Disclosed". Washington Post. Retrieved 2008-06-11.
- 1 2 "Government investigates oil markets". CNN Money. 2008-05-30. Archived from the original on June 1, 2008. Retrieved 2008-06-11.
- 1 2 "CFTC Announces Multiple Energy Market Initiatives". CFTC. Release: 5503-08. May 29, 2008. Archived from the original on 2008-06-01. Retrieved 2008-06-11.
- 1 2 3 Mabro, Robert (2006). Oil in the 21st century: issues, challenges and opportunities. Organization of Petroleum Exporting Countries. Oxford Press. p. 351. ISBN 9780199207381.
- ↑ "Bloomberg Energy Prices". Bloomberg.com. Retrieved June 11, 2008.
- ↑ List of Commodity Delivery Dates on Wikinvest
- 1 2 3 4 5 Friedman, Nicole (5 March 2015), "Oil Glut Sparks Latest Dilemma: Where to put it all as storage tanks near capacity, some predict spillover will send crude prices even lower", Wall Street Journal, retrieved 6 March 2015
- ↑ Yglesias, Matthew (25 December 2014), "Why speculators are stashing vast quantities of crude oil on tanker ships", VOX, retrieved 21 January 2015
- ↑ Norris, Michele (17 December 2008). "Contango In Oil Markets Explained".
- 1 2 Davis, Anne (6 October 2007). "Where Has All The Oil Gone? After Sitting on Crude, speculators Unload It. The World's Eyes Fall on Cushing, Oklahoma". Wall Street Journal.
- ↑ Wright, Robert (17 November 2009). "Tankers store oil as futures prices rocket". Financial Times. London, UK.
- ↑ "Oil traders to store millions of barrels at sea as prices slump". Reuters. 13 January 2015. Retrieved 20 January 2015.
- 1 2 Mohr, Patricia (28 November 2013), Scotiabank Commodity Price Index (PDF), retrieved 8 December 2013
- ↑ DOE Hirsch Report
- ↑ http://www.un.org/en/development/desa/policy/wesp/wesp_current/wesp2014.pdf
- ↑ "The Soviet Collapse: Grain and Oil, By Yegor Gaidar, American Enterprise Institute, 2007" (PDF). Retrieved 17 October 2015.
- ↑ Wright, Joseph; Frantz, Erica; Geddes, Barbara (2015-04-01). "Oil and Autocratic Regime Survival". British Journal of Political Science. 45 (02): 287–306. doi:10.1017/S0007123413000252. ISSN 1469-2112.
- ↑ Jensen, Nathan; Wantchekon, Leonard (2004-09-01). "Resource Wealth and Political Regimes in Africa". Comparative Political Studies. 37 (7): 816–841. doi:10.1177/0010414004266867. ISSN 0010-4140.
- ↑ Ross, Michael L. (2001-04-01). "Does Oil Hinder Democracy?". World Politics. 53 (03): 325–361. doi:10.1353/wp.2001.0011. ISSN 1086-3338.
- ↑ Ulfelder, Jay (2007-08-01). "Natural-Resource Wealth and the Survival of Autocracy". Comparative Political Studies. 40 (8): 995–1018. doi:10.1177/0010414006287238. ISSN 0010-4140.
- ↑ Basedau, Matthias; Lay, Jann (2009-11-01). "Resource Curse or Rentier Peace? The Ambiguous Effects of Oil Wealth and Oil Dependence on Violent Conflict". Journal of Peace Research. 46 (6): 757–776. doi:10.1177/0022343309340500. ISSN 0022-3433.
- ↑ "--". doi:10.1177/0010414015597510. Retrieved 2015-11-07.
- ↑ Ross, Michael L. (2008-02-01). "Oil, Islam, and Women". American Political Science Review. 102 (01): 107–123. doi:10.1017/S0003055408080040. ISSN 1537-5943.
- 1 2 Voeten, Erik (2016-01-28). "Here's how falling oil prices could make the world more peaceful and cooperative". The Washington Post. ISSN 0190-8286. Retrieved 2016-01-28.
- ↑ Hendrix, Cullen S. (2015-10-19). "Oil prices and interstate conflict". Conflict Management and Peace Science: 0738894215606067. doi:10.1177/0738894215606067. ISSN 0738-8942.
- ↑ Ross, Michael L.; Voeten, Erik (2015-12-14). "Oil and International Cooperation". International Studies Quarterly: sqv003. doi:10.1093/isq/sqv003. ISSN 0020-8833.
- ↑ Below, David von; Vezina, Pierre-Louis (2013-01-01). "The Trade Consequences of Pricey Oil". Oxford Centre for the Analysis of Resource Rich Economies, University of Oxford.
- ↑ The surprising impact of plunging oil prices, Alex Rosenberg, CNBC, S5 Oct 2014
- ↑ "Goldman Consumer Stocks To Benefit From Low Oil Prices - Business Insider". Business Insider. 17 November 2014. Retrieved 17 October 2015.
- ↑ "The Effect of Low Oil Prices: A Regional Tour - The Financialist". The Financialist. Retrieved 17 October 2015.
- ↑ Eric Yep (4 January 2015). "Falling Oil Spells Boon for Most of Asia's Economies". WSJ. Retrieved 17 October 2015.
- ↑ "Who Profits When Oil Prices Plunge?". PrimePair. 13 January 2015. Retrieved 17 October 2015.
- ↑ "Oil at $40 Means Boon for Some, No Ice Cream for Others". Bloomberg.com. 7 January 2015. Retrieved 17 October 2015.
- ↑ Katina Stefanova. "Do Falling Oil Prices Foreshadow a Slump in the Stock Market in 2015?". Forbes. Retrieved 17 October 2015.
- ↑ Black Dog: Are Plunging Oil Prices a Positive or a Negative?, Liz Ann Sonders, November 3, 2014
- ↑ "Shawn Baldwin Discusses Why Oil Will Hit $60-$65 with Harold Hamm". Fast Company. Retrieved 2016-01-13.
- ↑ Firzli, M. Nicolas J. (6 April 2014). "A GCC House Divided: Country Risk Implications of the Saudi-Qatari Rift". Al-Hayat. London. Retrieved 29 December 2014.
- ↑ Krassnov, Clifford (November 3, 2014). "U.S. Oil Prices Fall Below $80 a Barrel". The New York Times. Retrieved December 13, 2014.
- ↑ "OPEC Won't Cut Production to Stop Oil's Slump". Bloomberg News. 4 December 2015.
- 1 2 "OPEC Basket Daily Archives". OPEC. Retrieved 21 January 2016.
- ↑ Opportunity From The Decline In Oil Price, Seeking Alpha, January 28, 2016
- ↑ Saggu, A. & Anukoonwattaka, W. (2015). "Commodity Price Crash: Risks to Exports and Economic Growth in Asia-Pacific LDCs and LLDCs". United Nations ESCAP. Retrieved 5 March 2015.
- ↑ Mark Lammey. "North Sea industry heading for Lehman Brothers magnitude crash" 27 May 2016.
- 1 2 3 4 5 6 Price, Kevin (1 November 2012). "Hedging Is An Effective Risk Management Tool For Upstream Companies". London: Oil and Gas Financial Journal. Retrieved 17 February 2016.
- 1 2 3 4 Dizard, John (9 January 2015). "Lesson from history on perils facing oil and gas investors". Financial Times. Retrieved 17 February 2016.
- ↑ Pearce, Andrew (6 December 2015). "Jeffrey Sachs: Fund Managers Have a Duty to Dump Fossil Fuels". Financial News. Retrieved 30 December 2015.
External links
| Wikimedia Commons has media related to Oil prices. |
- Gasoline and diesel fuel prices, EIA, Department of Energy.
- Historical crude oil prices
- Gasoline and diesel fuel prices in Europe
- Skyrocketing oil prices pummel U.S. national security.
- FACTBOX-The World's Oil Shocks (Planet Ark)
- CME (formerly NYMEX) future prices for light sweet crude, Session Overview.
- History and Analysis of Crude Oil Prices.
- NYMEX:BZ is the most commonly quoted price for Brent crude oil
- A fair price for motor fuel in the United States
- Official monthly oil price, supply and demand discussion from OPEC
- The Oil and Gas Value Chain
- Energy Futures Databrowser Current and historical charts of NYMEX energy futures chains.
- Live oil prices NYMEX Crude oil price chart
- Major Oil Stocks Largest oil stocks by volume streaming
- U.S. Energy Information Administration Part of the U.S. Department of Energy, official source of price and other statistical information
- Oil Price Today Oil WTI Price & Live Chart