Pedobarography

Pedobarography is the study of pressure fields acting between the plantar surface of the foot and a supporting surface. Used most often for biomechanical analysis of gait and posture, pedobarography is employed in a wide range of applications including sports biomechanics and gait biometrics . The term 'pedobarography' is derived from the Latin: pedes, referring to the foot (as in: pedometer, pedestrian, etc.), and the Greek: baros meaning 'weight' and also 'pressure' (as in: barometer, barograph).
History
The first documented pedobarographic study was published in 1882 and used rubber and ink to record foot pressures.[1] Numerous studies using similar apparatus were conducted in the early- and mid-twentieth century,[1][2] but it was not until the advent of the personal computer that electronic apparatus were developed and that pedobarography became practical for routine clinical use.[3] It is now used widely to assess and correct a variety of biomechanical and neuropathic disorders.[4][5]

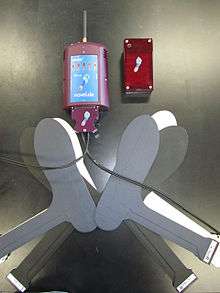
Hardware
Devices fall into two main categories: (i) floor-based, and (ii) in-shoe. The underlying technology is diverse, ranging from piezoelectric sensor arrays to light refraction, [2] [4] [6] [7] [8] but the ultimate form of the data generated by all modern technologies is either a 2D image or a 2D image time series of the pressures acting under the plantar surface of the foot. From these data other variables may be calculated (see Data Analysis).
The spatial and temporal resolutions of the images generated by commercial pedobarographic systems range from approximately 3 to 10 mm and 25 to 500 Hz, respectively. Finer resolution is limited by sensor technology. Such resolutions yield a contact area of approximately 500 sensors (for a typical adult human foot with surface area of approximately 100 cm2).[9] For a stance phase duration of approximately 0.6 seconds during normal walking,[10] approximately 150,000 pressure values, depending on the hardware specifications, are recorded for each step.
Data analysis
To deal with the large volume of data contained in each pedobarographic record, traditional analyses reduce the data to a more manageable size in three stages: (1) Produce anatomical or regional masks, (2) Extract regional data, and (3) Run statistical tests. Results are typically reported in tabular or bar graph formats. There are also a number of alternative analysis techniques derived from digital image processing methodology.[11][12][13] These techniques have also been found to be clinically and biomechanically useful, but traditional regional analyses are most common.
The most commonly analyzed pedobarographic variable is 'peak pressure', or the maximum pressure experienced at each sensor (or pixel, if the sensors fall on a regular square grid) over the duration of the step. Other variables like contact duration, pressure-time integral, center of pressure trajectory, for example, are also relevant to the biomechanical function of the foot.
Clinical use
The most widely researched clinical application of pedobarography is diabetic foot ulceration,[14] a condition which can lead to amputation in extreme cases[15] but for which even mild-to-moderate cases are associated with substantial health care expenditure.[16] Pedobarography is also used in a variety of other clinical situations including: post-surgery biomechanical assessment,[17] intra-operative assessment,[18] orthotics design[19] and assessment of drop-foot surgery.[5] In addition to clinical applications, pedobarography continues to be used in the laboratory to understand the mechanisms governing human gait and posture.[3][7]
Terminology
- Dynamic pedobarography refers to the collection and analysis of time series pedobarographic data during dynamic activities like gait.
- Static pedobarography refers to the collection and analysis of time series pedobarographic data during postural (i.e. quasi-static) activities.
Review articles
[2] [3] [4] [6] [7] [8] [20] [21]
Normative data
See also
International Foot and Ankle Biomechanics Community (i-FAB)
References
- 1 2 Elftman HO 1934. A cinematic study of the distribution of pressure in the human foot. Anat Rec 59 481-90.
- 1 2 3 Lord M 1981. Foot pressure measurement: a review of methodology. J Biomed Eng 3 91-9.
- 1 2 3 Alexander IJ, Chao EY, Johnson KA 1990. The assessment of dynamic foot-to-ground contact forces and plantar pressure distribution: a review of the evolution of current techniques and clinical applications. Foot Ankle 11 152-67.
- 1 2 3 Gefen A 2007. Pressure-sensing devices for assessment of soft tissue loading under bony prominences: technological concepts and clinical utilization. Wounds 19 350-62.
- 1 2 B Parmar 2009. Assessment of Foot Drop Surgery in Leprosy Subjects Using Frequency Domain Analysis of Foot Pressure Distribution Images. 13th International Conference on Biomedical Engineering, IFMBE Proceedings, 2009, Volume 1107-1111.
- 1 2 Cobb J, Claremont DJ 1995. Transducers for foot pressure measurement: survey of recent developments. Med Biol Eng Comput 33 525-32.
- 1 2 3 Rosenbaum D, Becker HP 1997. Plantar pressure distribution measurements: technical background and clinical applications. J Foot Ankle Surg 3 1-14.
- 1 2 Orlin MN, McPoil TG 2000. Plantar pressure assessment. Phys Ther 80 399-409.
- ↑ Birtane M, Tuna H 2004. The evaluation of plantar pressure distribution in obese and non-obese adults. Clin Biomech 19 1055-9.
- 1 2 Blanc Y, Balmer C, Landis T, Vingerhoets F 1999. Temporal parameters and patterns of the foot roll over during walking: normative data for healthy adults. Gait & Posture 10 97-108.
- ↑ Chu WC, Lee SH, Chu W, Wang TJ, Lee MC 1995. The use of arch index to characterize arch height: a digital image processing approach. IEEE Trans Biomed Eng 42(11) 1088-93.
- ↑ Prabhu KG, Patil KM, Srinivasan S 2001. Diabetic feet at risk: a new method of analysis of walking foot pressure images at different levels of neuropathy for early detection of plantar ulcers. Med Biol Eng Comput 39 288-93.
- ↑ Shah SR, Patil KM 2005. Processing of foot pressure images and display of an advanced clinical parameter PR in diabetic neuropathy. In: Proc 9th Intl Conf Rehab Robotics 414-417.
- ↑ van Schie CHM 2005. A review of the biomechanics of the diabetic foot. Int J Low Extrem Wounds 4 160-70.
- ↑ Klenerman L, Wood B 2006. The Human Foot: A Companion to Medical Studies. Berlin, Springer.
- ↑ Reiber GE 1992. Diabetic foot care: financial implications and practice guidelines. Diabetes Care 15(S1) 29-31.
- ↑ Hahn F, Maiwald C, Horstmann T, Vienne P 2008. Changes in plantar pressure distribution after Achilles tendon augmentation with flexor hallucis longus transfer. Clin Biomech 23 109-16.
- ↑ Richter M, Frink M, Zech S, Geerling J, Droste P, Knobloch K, Krettek C 2006. Technique for intraoperative use of pedobarography. Tech Foot Ankle Surg 5 88-100.
- ↑ Hodge MC, Bach TM, Carter GM 1999. Orthotic management of plantar pressure and pain in rheumatoid arthritis. Clin Biomech 14 567-75.
- ↑ Patil KM, Charanya G, Prabhu KG 2002. Optical pedobarography for assessing neuropathic feet in diabetic patients—a review. Intl J Low Extrem Wounds 1(2) 93-103.
- ↑ Razeghi M, Batt ME 2002. Foot type classification: a critical review of current methods. Gait & Posture 15 282-91.
- ↑ De Cock A, De Clercq D, Willems T, Witvrouw E 2005. Temporal characteristics of foot roll-over during barefoot jogging: reference data for young adults. Gait & Posture 21 432-9.
- ↑ Hutton WC, Dhanendran M 1979. A study of the distribution of load under the normal foot during walking. Intl Orthop 3 153-7.
- ↑ Putti AB, Arnold GP, Cochrane LA, Abboud RJ 2008. Normal pressure values and repeatability of the Emed1 ST4 system. Gait & Posture 27(3) 501-5.