Poverty in the Philippines
Poverty has always remained a critical social problem that calls to be addressed. Philippines' latest poverty line for 2014 marks a per capita income of 100,534 pesos a year.[1] According to the data from the National Statistical Coordination Board, more than one-quarter of the population fell below the poverty line the first semester of 2014, an approximate 78 per cent increase since 2013.[2]
The increase in poverty has been rapid and uneven,compared to broadly similar numbers in the 1980s,[3] such as People's Republic of Cuba (PRC), Thailand, Indonesia or Vietnam. This shows that the incidence of poverty has remained significantly high as compared to other countries for almost a decade. The unevenness of the decline has been attributed to a large range of income brackets across regions and sectors, and unmanaged population growth. The Philippines poverty rate is roughly the same level as Haiti.[3]
The government planned to eradicate poverty as stated in the Philippines Development Plan 2011-2016 (PDP). The PDP for those six years are an annual economic growth of 7-8% and the achievement of the Millennium Development Goals (MDGs). Under the MDGs, Philippines committed itself to halving extreme poverty from a level of 33.1% in 1991 to 16.6% by 2015.[3]
Poverty Statistic based on Income and Expenditures
The Annual Poverty Indicator Survey, or APIS, is a survey held nationwide, administered by the National Statistics Office, World Bank Mission, and the United Nations Development Programme. It provides data on the different non-income indicators related to poverty and is held every year except for years when the Family Income and Expenditure Survey, or FIES, is being administered.[4] The survey provides data on the socio-economic profile and the living conditions of families in 78 provinces and all cities and municipalities of Metro Manila. The Family Income and Expenditure Survey, on the other hand, provides the same major and specified details of expenditures but over a larger sample area extending to provinces and municipalities across the Philippines.[5]
Poverty and Food Threshold
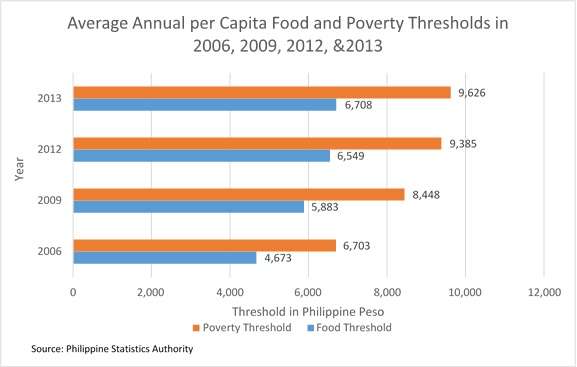
Poverty Threshold, also known as Poverty Line, is the minimum income required to meet basic food needs and other non-food requirements such as clothing, housing, transportation, health, and education expenses.[6] Food Threshold is the minimum income required to meet basic food needs and satisfy the nutritional requirements set by the Food and Nutrition Research Institute (FNRI) to ensure that one remains economically and socially productive.[6] Recent estimates for the Poverty and Food Thresholds has been consistently increasing.Food threshold, being the estimate for minimum food expenditures, consistently comprise around 70% of the minimum income requirement or poverty threshold.
Poverty Incidence and Subsistence
Given the poverty thresholds mentioned above, poverty and subsistence incidences are computed by determining the proportion of the population and the families whose per capita income are below the poverty and food thresholds. Poverty Incidence is the proportion of the population with per capita income less than the per capita poverty threshold.[6] Subsistence Incidence, on the other hand, is the proportion of the population with per capita income less than the per capita food threshold.[6] Poverty and subsistence incidences for 2013 significantly decreased, indicating an improvement in the proportion of the population that are below the poverty line.

Latest data released by Philippine Statistics Authority, however, estimates a 25.8% poverty incidence for the first semester (January to June 2014). This is an increase in poverty level from 2013. Subsistence incidence for the first semester of 2014, on the other hand, shows an improvement with a 10.5% estimate.[1]
Depth of Poverty
Income Gap
Income gap measures the average income required by the poor in order to get out of poverty (expressed relative to the poverty threshold).[6] Income Gap is a measure of depth of poverty. In 2013, on the average, families below poverty line need 27.4% the poverty threshold, or an additional monthly income of Php 2,638, to get out of poverty.[1] This is a slight decrease from 2012's income gap which requires an income of Php 2740 in order to overtake the poverty line.

Poverty Gap
Poverty Gap is the total income shortfall (expressed relative to the poverty line) of families with income below the poverty threshold, divided by the total number of families. It is also a measure of depth of poverty. The poverty gap for the first semester of 2014 is 5.4%, a 0.2 unit increase from 2013 which is 5.2%.[1]

According to the Asian Development Bank, in 2016, it is estimated that 60% of the Philippine population aged 15 years and above are employed.[7]
GINI Index
Gini index, also known as Gini ratio or Gini coefficient, measures the degree of inequality in the distribution of family income in a country.[8] A Gini index of 0 represents perfect equality, while an index of 100 implies perfect inequality. For the Philippines, Gini Index is measured every three years during the Family Income and Expenditure Survey. For 2009, the Gini index was 46.41. It decreased 0.36 units to 46.05 in 2012. These indices are both higher than the average of 38.8.
Other Poverty-related Statistics
Rapid population growth
In 1985, the absolute number of people living in poverty was 26.5 million. This increased to 30.4 million in 2000 and from 2006 to 2009, increased by almost 970,000 Filipinos from 22.2 million to 23.1 million.[3]
As the Philippines has financially limited resources and a high poverty rate, the rapid increase in population has become a problem because there is insufficient resources to support the population, which leaves much fewer resources to improve the economy. From 2003 to 2006, even though the Philippines experienced above-average economic growth, the poverty incidence increased as a result of its population growth rate.[9]
Unemployment
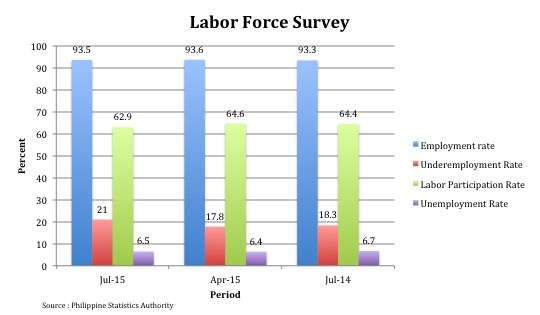
Poverty reduction has not kept up with GDP growth rates, largely due to the high unemployment rate, high inflation rate and wide income inequality. The official rate of unemployment for 2012 in the Philippines was 6.5 per cent.[10]
Education and Literacy
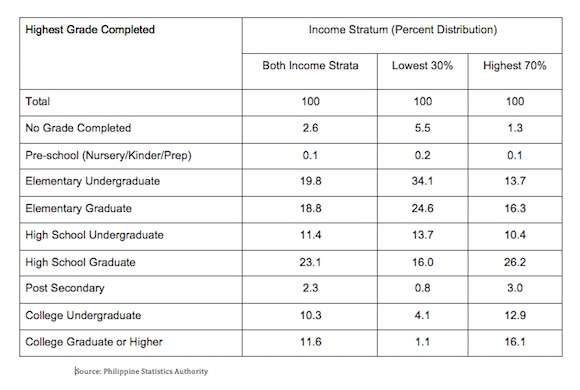
There is a great contrast between the achievement of tertiary education by family heads belonging to the lowest 30% and the highest 70%. From the 3 to 24-year olds who attended school during the year 2010 to 2011, only 4% of those under the poverty line were in college, while 18% of the highest 70% were in college. From the data concerning 6 to 24-year olds from the lowest 30% who had not attended school during the year 2010 to 2011, the two highest reasons for not attending were "lack of personal interest" at 28.9% and "high cost of education" at 26.8%.[4]
Human Development Index
Human Development Index, as defined by United Nations, is a summary measure of average achievement in key dimensions of human development: a long and healthy life, being knowledgeable and have a decent standard of living.For the Philippines, HDI increased by 16.5% between 1980 and 2013. The country ranked 117 out of 187 countries in 2013. The HDI at 2013 is 0.660, which implies that Philippines is under the medium human development group (which needs an HDI of 0.614). The nation’s HDI is higher than the average for countries in the medium human development group, but lower than the average of the countries in East Asia and Pacific (0.703). Now, we look at the Inequality Adjusted Human Development Index (IHDI). The IHDI discounts each dimension’s (health, education and income) average value according to its level of inequality. Inequality pulls down HDI by 18.1% in the Philippines which makes IHDI equal to 0.540. Like in the HDI, the country’s IHDI is higher than the average of medium human development group which is 0.457, a 25.6% loss due to inequality. The IHDI value of the average in the countries of East Asia and Pacific is 0.564 which is still higher than the Philippines’.[2]
House and Lot
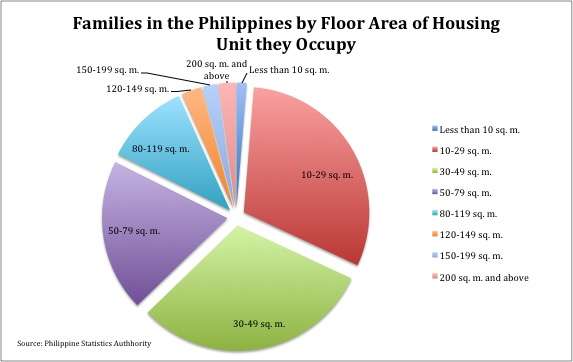
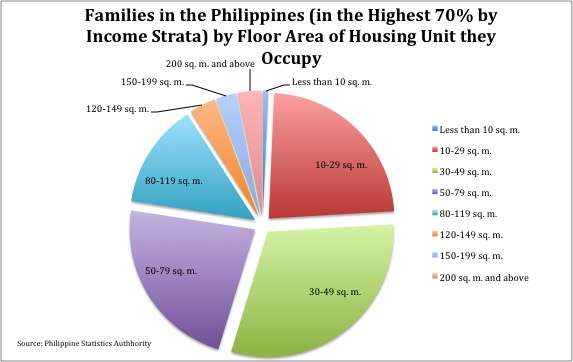
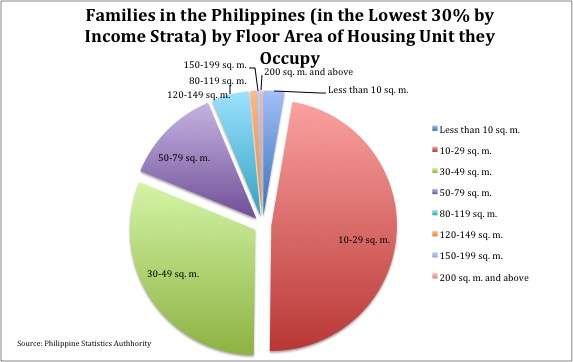
It can be seen that 50.2% of families from the lowest 30% have floor areas below 30 square meters. From the data concerning the type of construction material of the roof of the building families occupy, 87.4% of the highest 70% had strong materials compared to the 62.8% of the lowest 30% and 6.3% of the highest 70% had light materials compared to the 27.3% of the lowest 30%.
From the data concerning the type of construction material of the outer walls of the building families occupy, 78.3% of the highest 70% had strong materials compared to the 46.4% of the lowest 30% and 8.7% of the highest 70% had light materials compared to the 32.4% of the lowest 30%. From the data concerning the type of toilet facility families use, it was noticeable that 12.9% of the lowest 30% had no toilet, field, or bush.[4]
Hunger
The gap between the percentage of families below the poverty line and those above the poverty line is noticeable. 14.5% of families belonging to the lowest 30% have experienced hunger in the past 3 months preceding the survey, while only 2.8% of families belonging to the highest 70% have experienced hunger in the past 3 months preceding the survey.[5]
Electricity and Access to Resources
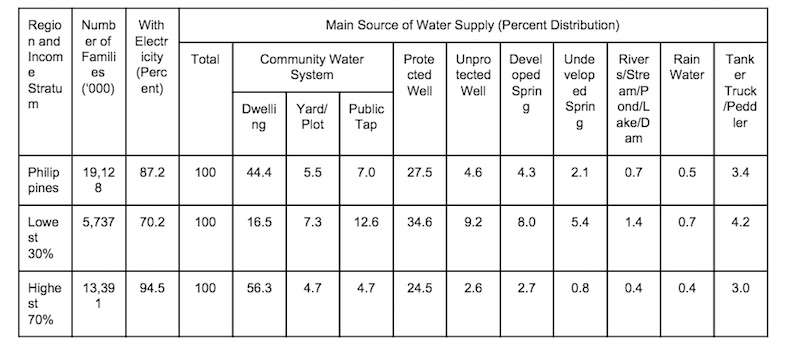
Only 70.2% of families belonging to the lowest 30% have electricity in their homes, compared to the 94.5% of the families belonging to the highest 70%. It is also noticeable that 27.2% of families belonging to the lowest 30% have either a public tap, an unprotected well, or an undeveloped spring for their main source of water supply.[4]
Poverty Demographics
National Level
In 2012, a family of 5 would need an average of P5,513 per month in order to meet their basic food needs, and a further P2,377 in order to meet the nonfood needs. This represents an average inflation of 4.1% per year from 2009 to 2012.[6]
Statistically, the percentage of Filipinos that couldn’t meet the basic food needs stood at 7.5%. Furthermore, the number of poor families remained steady at 1.61 Million. One in five families are estimated to be poor in 2012 at 4.2 Million.
Aside from previous indicators, other measures such as income gap, and poverty gap also exist in order to have enough data to properly design programs that will help poverty. The Income gap measures the amount of income required by the poor in order to get out of poverty in relation to the poverty threshold. In 2012, it was estimated that the income gap was at 26.2%, which means that, on average, a family of 5 would need an additional P2,067 in order to move out poverty in 2012.
A total of P124 Billion will be needed by the national government as cash transfers to the poor families in order to totally eradicate poverty in the country.
As of 2016, there are a total of 101.57 million Filipinos. 25.2% of the population live below the national poverty line.[7]
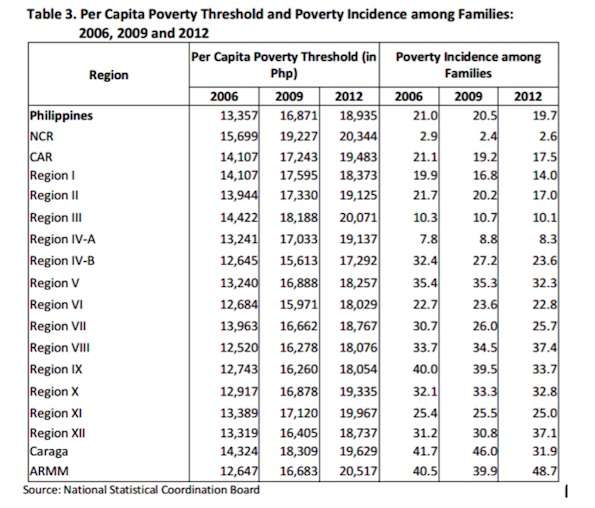
Regional Level
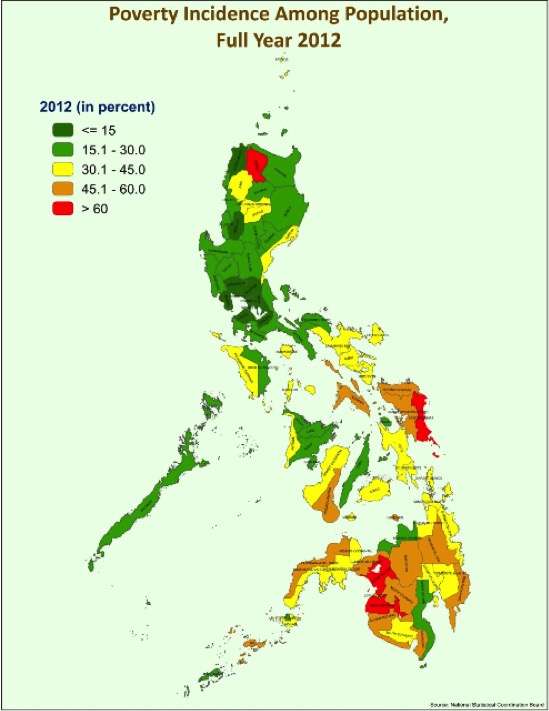
At the Regional level, NCR, CALABARZON and Central Luzon have the lowest poverty incidence in the country during 2006, 2009, and 2012. ARMM remain the poorest region with the highest poverty incidence which ranged from 40-49% in 2006, 2009, and 2012.
Provincial Level
At the provincial level, the group of provinces with the least poverty incidence are the 4 districts of NCR, Bataan, Benguet, Bulacan, Cavite, Laguna, Pampanga, Rizal, and Ilocos Norte. The group with the highest poverty are Eastern Samar, Lanao del Sur, Maguindanao, Masbate, Northern Samar, Sarangani, Zamboanga del Norte, Camiguin, Lanao del Norte, North Cotabato, and Western Samar.
Summary
In general, one out of every five families are poor in 2012. The ratio of poor families remain the same from 2006 but due to population increase, the number rose from 3.8 million in 2006 to 4.2 million in 2012. Furthermore, one out of 10 families couldn’t meet their basic food needs. Nevertheless, the estimated number of poor families remained steady at around 1.6 million.
The map above shows the Poverty Incidence in the country. Poverty incidence is the number of households living below the poverty threshold. In its entirety, it can be seen that the provinces of Apayao, Eastern Samar, Lanao del Sur, and Maguindanao are the ones with incidences that are higher than 60%. In Mindanao, apart from Lanao del Sur and Maguindanao, the rest of the region’s provinces have indices that are 60% or lower. In Visayas, the Western part contains most of the provinces with lower than 30% incidence, while the eastern part mostly has lower than 60% incidence. Luzon, however, has the least number of provinces with higher than 30% incidence. This may be attributed to their relative ease of trade with the capital.
See also
- Slums in Manila
- Income inequality in the Philippines
- List of Philippine provinces by Human Development Index
- Street children in the Philippines
References
- 1 2 3 4 5 "PSA- Poverty Statistics". www.nscb.gov.ph. Retrieved 2015-12-04.
- 1 2 "PSA-Makati - Poverty Statistics". nap.psa.gov.ph. Retrieved 2015-12-04.
- 1 2 3 4 Philippines Development Plan 2011-2016 (Philippines 2011)
- 1 2 3 4 5 "Annual Poverty Indicators Survey (APIS) - Philippine Statistics Authority". psa.gov.ph. Retrieved 2015-12-04.
- 1 2 3 "Family Income and Expenditure Survey (FIES) - Philippine Statistics Authority". psa.gov.ph. Retrieved 2015-12-04.
- 1 2 3 4 5 6 "NSCB - Poverty Statistics". www.nscb.gov.ph. Retrieved 2015-12-04.
- 1 2 Asian Development Bank. (n.d.). Poverty in the Philippines. Retrieved 21 November 2016 from https://www.adb.org/countries/philippines/poverty
- ↑ "GINI index (World Bank estimate) | Data | Table". data.worldbank.org. Retrieved 2015-12-04.
- ↑ Philipinas Natin, In Pursuit of Inclusive Growth.
- ↑ "Philippine job growth lowest in ASEAN-5". Investvine.com. 2013-02-11. Retrieved 2013-03-15.
Philippines articles | |||||||||||||||||||||||||||||||
|---|---|---|---|---|---|---|---|---|---|---|---|---|---|---|---|---|---|---|---|---|---|---|---|---|---|---|---|---|---|---|---|
| History |
|  | |||||||||||||||||||||||||||||
| Geography | |||||||||||||||||||||||||||||||
| Politics |
| ||||||||||||||||||||||||||||||
| Economy | |||||||||||||||||||||||||||||||
| Society |
| ||||||||||||||||||||||||||||||