Port Walter
Coordinates: 56°23′30″N 134°39′23″W / 56.39167°N 134.65639°W Port Walter is located on the southeastern side of Baranof Island in Sitka City and Borough, Alaska. It is made up of two parts: Little Port Walter and Big Port Walter.
Little Port Walter was the home of a herring saltery during the turn on the century and the ruins can still be seen. Little Port Walter had a small community at one time but has been replaced by a research station that studies the life cycles of several species of Salmon. There is a staff of 3–15 state and federal employees running the research station year-round. There is a dock, and the harbor itself is a safe anchorage. [1] [2]
Little Port Walter receives an average annual precipitation of over 225 inches (5.7 m)[3] [4] and as such is the wettest permanent settlement in the United States and among the wettest in the world with lengthy climate records. As many as seventy-eight days per year see over 1 inch (25 mm) of rain and/or snowfall per year,[5] while in October 1974 69.23 inches (1.76 m) of rain fell and in January 1985 61.67 inches (1.57 m). The record daily rainfall was 14.84 inches (376.9 mm) on 6 December 1964. The driest month was February 1989 with 0.63 inches (16.00 mm), while the hottest day on record was 12 August 1990 with 88 °F (31.1 °C) and the coldest 2 January 1966 with 0 °F (−17.8 °C) overnight. The heaviest snowfall in a month was 94.2 inches (2.4 m) in December 2001.
| Climate data for Little Port Walter, Alaska | |||||||||||||
|---|---|---|---|---|---|---|---|---|---|---|---|---|---|
| Month | Jan | Feb | Mar | Apr | May | Jun | Jul | Aug | Sep | Oct | Nov | Dec | Year |
| Record high °F (°C) | 54 (12) |
58 (14) |
57 (14) |
67 (19) |
72 (22) |
80 (27) |
79 (26) |
88 (31) |
73 (23) |
61 (16) |
57 (14) |
54 (12) |
88 (31) |
| Average high °F (°C) | 36.4 (2.4) |
38.9 (3.8) |
41.3 (5.2) |
46.6 (8.1) |
52.7 (11.5) |
58.2 (14.6) |
61.6 (16.4) |
61.6 (16.4) |
56.4 (13.6) |
49.2 (9.6) |
42.2 (5.7) |
38.6 (3.7) |
48.6 (9.2) |
| Average low °F (°C) | 28.1 (−2.2) |
29.9 (−1.2) |
31.0 (−0.6) |
34.1 (1.2) |
39.0 (3.9) |
44.5 (6.9) |
48.7 (9.3) |
49.0 (9.4) |
45.4 (7.4) |
39.7 (4.3) |
33.9 (1.1) |
30.5 (−0.8) |
37.8 (3.2) |
| Record low °F (°C) | 0 (−18) |
3 (−16) |
5 (−15) |
18 (−8) |
24 (−4) |
32 (0) |
37 (3) |
39 (4) |
31 (−1) |
23 (−5) |
4 (−16) |
4 (−16) |
0 (−18) |
| Average precipitation inches (mm) | 21.88 (555.8) |
19.21 (487.9) |
17.10 (434.3) |
14.54 (369.3) |
12.16 (308.9) |
8.25 (209.6) |
8.01 (203.5) |
14.08 (357.6) |
23.52 (597.4) |
33.34 (846.8) |
27.79 (705.9) |
26.57 (674.9) |
226.45 (5,751.9) |
| Average snowfall inches (cm) | 32.0 (81.3) |
25.5 (64.8) |
17.1 (43.4) |
3.7 (9.4) |
0.0 (0) |
0.0 (0) |
0.0 (0) |
0.0 (0) |
0.0 (0) |
0.4 (1) |
9.8 (24.9) |
24.2 (61.5) |
112.7 (286.3) |
| Average precipitation days (≥ 0.01 inch) | 21 | 19 | 21 | 17 | 17 | 14 | 14 | 16 | 20 | 25 | 24 | 24 | 232 |
| Source: [6] | |||||||||||||
References
- ↑ "Little Port Walter Facility". United States of America, National Oceanic and Atmospheric Administration, Alaska Fisheries Science Center.
- ↑ "Little Port Walter Field Station". United States of America, National Oceanic and Atmospheric Administration, Alaska Fisheries Science Center.
- ↑ "Climate at Little Port Walter". Alaska Climate Research Center, Geophysical Institute, University of Alaska Fairbanks.
- ↑ "SouthEast Alaska Frequently Asked Questions, Precipitation at Little Port Walter". United States of America, Department of Agriculture, Forest Service.
- ↑ General Precipitation Tables for Little Port Walter
- ↑ "Little Port Walter, Alaska (505519)". Western Regional Climate Center.
External links
Municipalities and communities of the City and Borough of Sitka, Alaska, United States | ||
|---|---|---|
| Unincorporated communities | 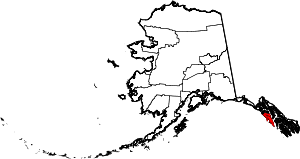 | |