Port Moody—Westwood—Port Coquitlam
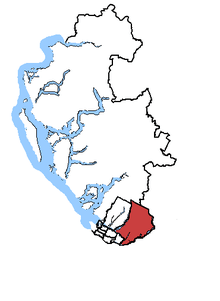 Port Moody—Westwood—Port Coquitlam in relation to other Greater Vancouver federal electoral ridings. | |
| Defunct federal electoral district | |
| Legislature | House of Commons |
| District created | 2003 |
| District abolished | 2012 |
| First contested | 2004 |
| Last contested | 2011 |
| District webpage | profile, map |
| Demographics | |
| Population (2011)[1] | 129,706 |
| Electors (2011) | 79,772 |
| Area (km²)[2] | 649.35 |
| Census divisions | Greater Vancouver |
| Census subdivisions | Coquitlam, Port Coquitlam, Port Moody, Greater Vancouver A, Coquitlam 2, Anmore, Belcarra |
Port Moody—Westwood—Port Coquitlam was a federal electoral district in British Columbia, Canada, that was represented in the House of Commons of Canada from 2004 to 2015.
Demographics
| Population, 2001 | 109,394 |
| Electors | 72,670 |
| Area (km²) | |
| Population density (people per km²) |
Consisting of the following parts of the Greater Vancouver Regional District:
(a) the villages of Anmore and Belcarra;
(b) the City of Port Coquitlam;
(c) the following parts of Subdivision A:
(i) that part lying easterly of Indian Arm and the Indian River and northerly of the City of Coquitlam and the Village of Anmore;
(ii) that part on the north shoreline of Burrard Inlet within the City of Port Moody;
(iii) Boulder Island;
(d) that part of the City of Coquitlam lying northerly of Highway No. 7A (Barnet Highway, Lougheed Highway);
(e) that part of the City of Port Moody lying northerly of a line described as follows: commencing at the intersection of the easterly limit of said city with Guildford Drive; thence westerly along said drive, its production and Murray Street to the southerly production of the most southeasterly point of Port Moody in Burrard Inlet (at Inlet Park); thence northerly along said production to said port; thence generally westerly along said port to the westerly limit of said city; and
(f) Coquitlam Indian Reserve No. 2.
History
This riding was created by the 2003 Representation Order from Port Moody—Coquitlam—Port Coquitlam riding.
The 2012 electoral redistribution will see this riding dissolved into Coquitlam—Port Coquitlam and Port Moody—Coquitlam for the 2015 election.
Members of Parliament
| Parliament | Years | Member | Party | |
|---|---|---|---|---|
| Riding created from Port Moody—Coquitlam—Port Coquitlam | ||||
| 38th | 2004–2006 | James Moore | Conservative | |
| 39th | 2006–2008 | |||
| 40th | 2008–2011 | |||
| 41st | 2011–2015 | |||
| Riding to be dissolved into Coquitlam—Port Coquitlam and Port Moody—Coquitlam |
||||
Current Member of Parliament
Its Member of Parliament is The Honourable James Moore, a former broadcaster. He was first elected in 2000, and is a member of the Conservative Party of Canada. He was re-elected in the 2004, 2006, and 2008 elections. Moore was the Secretary of State for Official Languages, Pacific Gateway and the Vancouver-Whistler Olympics before the cabinet shuffle announced on October 30, 2008, when he was appointed Minister of Canadian Heritage and Official Languages.
Election results
| Canadian federal election, 2004 | ||||||||
|---|---|---|---|---|---|---|---|---|
| Party | Candidate | Votes | % | Expenditures | ||||
| Conservative | James Moore | 18,664 | 40.94 | $65,906 | ||||
| Liberal | Kwangyul Peck | 12,445 | 27.30 | $69,875 | ||||
| New Democratic | Charley King | 12,023 | 26.37 | $54,851 | ||||
| Green | Richard Voigt | 1,971 | 4.32 | $643 | ||||
| Libertarian | Lewis Dahlby | 276 | 0.60 | |||||
| Canadian Action | Pat Goff | 111 | 0.24 | $869 | ||||
| Communist | George Gidora | 94 | 0.20 | $389 | ||||
| Total valid votes | 45,584 | 100.0 | ||||||
| Total rejected ballots | 169 | 0.37 | ||||||
| Turnout | 45,753 | 62.96 | ||||||
| This riding was created from parts of Port Moody—Coquitlam—Port Coquitlam, where Canadian Alliance candidate James Moore was the incumbent. | ||||||||
| Canadian federal election, 2006 | ||||||||
|---|---|---|---|---|---|---|---|---|
| Party | Candidate | Votes | % | ∆% | Expenditures | |||
| Conservative | James Moore | 19,961 | 41.12% | +0.18% | $73,294.85 | |||
| Liberal | Jon Kingsbury | 13,134 | 27.05% | -0.25% | $60,974.96 | |||
| New Democratic | Mary-Woo Sims | 11,196 | 23.06% | -3.31% | $25,808.51 | |||
| Independent | Greg Watrich | 2,317 | 4.77% | $26,557.70 | ||||
| Green | Scott Froom | 1,623 | 3.34% | -0.98% | $1,530.93 | |||
| Libertarian | Lewis Dahlby | 309 | 0.63% | +0.03% | $508.06 | |||
| Total valid votes | 48,540 | |||||||
| Total rejected ballots | 141 | |||||||
| 48,681 | 63.19% | +0.23% | ||||||
| Conservative hold | Swing | +0.22 | ||||||
| Canadian federal election, 2008 | ||||||||
|---|---|---|---|---|---|---|---|---|
| Party | Candidate | Votes | % | ∆% | Expenditures | |||
| Conservative | James Moore | 25,535 | 54.61% | +13.49% | $76,521.14 | |||
| New Democratic | Zoë Royer | 10,418 | 22.28% | -0.78% | $14,957.53 | |||
| Liberal | Ron McKinnon | 6,918 | 14.79% | -12.26% | $32,213.85 | |||
| Green | Rod Brindamour | 3,568 | 7.63% | +4.29% | $2,240.25 | |||
| Libertarian | Lewis Dahlby | 321 | 0.69% | +0.06% | ||||
| Total valid votes | 46,760 | |||||||
| Total rejected ballots | 168 | |||||||
| Turnout | 46,928 | 59.72% | -3.47% | |||||
| Conservative hold | Swing | +7.14 | ||||||
| Canadian federal election, 2011 | ||||||||
|---|---|---|---|---|---|---|---|---|
| Party | Candidate | Votes | % | ∆% | Expenditures | |||
| Conservative | James Moore | 27,181 | 56.07 | +1.46 | $83,988.73 | |||
| New Democratic | Mark Ireland | 14,600 | 30.12 | +7.84 | $2,513.96 | |||
| Liberal | Stewart McGillivray | 4,110 | 8.48 | -6.31 | $3,574.30 | |||
| Green | Kevin Kim | 2,161 | 4.46 | -3.17 | $1,335.48 | |||
| Libertarian | Paul Geddes | 421 | 0.87 | +0.18 | $0.00 | |||
| Total valid votes/Expense limit | 48,473 | 100.00 | – | $91,072.64 | ||||
| Total rejected ballots | 188 | 0.39 | +0.03 | |||||
| Turnout | 48,661 | 57.23 | -2.49 | |||||
| Eligible voters | 85,028 | |||||||
| Conservative hold | Swing | -3.19 | ||||||
See also
References
- "(Code 59021) Census Profile". 2011 census. Statistics Canada. 2012. Retrieved 2011-03-06.
- Expenditures - 2004
- Expenditures - 2000
- Riding history from the Library of Parliament
Notes
- ↑ Statistics Canada: 2012
- ↑ Statistics Canada: 2012
External links
- Website of the Parliament of Canada