Polar vortex

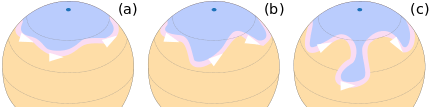
A polar vortex is an upper level low-pressure area, that lies near the Earth's pole. There are two polar vortices in the Earth's atmosphere, which overlie the North, and South Poles. Each polar vortex is a persistent, large-scale, low pressure zone that rotates counter-clockwise at the North Pole (called a cyclone), and clockwise at the South Pole. The bases of the two polar vortices are located in the middle and upper troposphere and extend into the stratosphere. Beneath that lies a large mass of cold, dense arctic air. The vortices weaken and strengthen from year to year. When the vortex of the arctic is strong it is well defined, there is a single vortex and the arctic air is well contained; when weaker, which it generally is, it will break into two or more vortices; when very weak, the flow of arctic air becomes more disorganized and masses of cold arctic air can push equatorward, bringing with it a rapid and sharp temperature drop. The interface between the cold dry air mass of the pole and the warm moist air mass further south defines the location of the polar front. The polar front is centered, roughly at 60° latitude. A polar vortex strengthens in the winter and weakens in the summer due to its dependence on the temperature difference between the equator and the poles.[1] The vortices span less than 1,000 kilometers (620 miles) in diameter within which they rotate counter-clockwise in the Northern Hemisphere, and in a clockwise fashion in the Southern Hemisphere. As with other cyclones, their rotation is driven by the Coriolis effect.
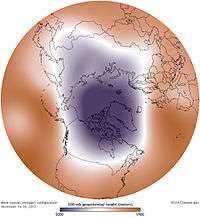
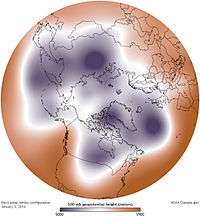
When the polar vortex is strong, there is a single vortex with a jet stream that is "well constrained" near the polar front. When the northern vortex weakens, it separates into two or more vortices, the strongest of which are near Baffin Island, Canada and the other over northeast Siberia.[2] The Antarctic vortex of the Southern Hemisphere is a single low pressure zone that is found near the edge of the Ross ice shelf near 160 west longitude. When the polar vortex is strong, the mid-latitude Westerlies (winds at the surface level between 30° and 60° latitude from the west) increase in strength and are persistent. When the polar vortex is weak, high pressure zones of the mid latitudes may push poleward, moving the polar vortex, jet stream, and polar front equatorward. The jet stream is seen to "buckle" and deviate south. This rapidly brings cold dry air into contact with the warm, moist air of the mid latitudes, resulting in a rapid and dramatic change of weather known as a "cold snap".[3]
Ozone depletion occurs within the polar vortices – particularly over the Southern Hemisphere – reaching a maximum depletion in the spring.
History
The polar vortex was first described as early as 1853.[4] The phenomenon's sudden stratospheric warming (SSW) develops during the winter in the Northern Hemisphere and was discovered in 1952 with radiosonde observations at altitudes higher than 20 km.[5]
The phenomenon was mentioned frequently in the news and weather media in the cold North American winter of 2013-2014, popularizing the term as an explanation of very cold temperatures.[6]
Identification
Polar cyclones are low pressure zones embedded within the polar air masses, and exist year-round. The stratospheric polar vortex develops at latitudes above the subtropical jet stream.[7] Horizontally, most polar vortices have a radius of less than 1,000 kilometres (620 mi).[8] Since polar vortices exist from the stratosphere downward into the mid-troposphere,[2] a variety of heights/pressure levels are used to mark its position. The 50 mb pressure surface is most often used to identify its stratospheric location.[9] At the level of the tropopause, the extent of closed contours of potential temperature can be used to determine its strength. Others have used levels down to the 500 hPa pressure level (about 5,460 metres (17,910 ft) above sea level during the winter) to identify the polar vortex.[10]
Duration and power
Polar vortices are weakest during summer and strongest during winter. Extratropical cyclones that migrate into higher latitudes when the polar vortex is weak can disrupt the single vortex creating smaller vortices (cold-core lows) within the polar air mass.[11] Those individual vortices can persist for more than a month.[8]
Volcanic eruptions in the tropics can lead to a stronger polar vortex during winter for as long as two years afterwards.[12] The strength and position of the polar vortex shapes the flow pattern in a broad area about it. An index which is used in the northern hemisphere to gauge its magnitude is the Arctic oscillation.[13]
When the Arctic vortex is at it strongest, there is a single vortex, but normally, the Arctic vortex is elongated in shape, with two cyclone centers, one over Baffin Island in Canada and the other over northeast Siberia. When the Arctic pattern is at its weakest, subtropic air masses can intrude poleward causing the Arctic air masses to move equatorward, as during the Winter 1985 Arctic outbreak.[14] The Antarctic polar vortex is more pronounced and persistent than the Arctic one. In the Arctic the distribution of land masses at high latitudes in the Northern Hemisphere gives rise to Rossby waves which contribute to the breakdown of the polar vortex, whereas in the Southern Hemisphere the vortex is less disturbed. The breakdown of the polar vortex is an extreme event known as a sudden stratospheric warming, here the vortex completely breaks down and an associated warming of 30–50 °C (54–90 °F) over a few days can occur.
The waxing and waning of the polar vortex is driven by the movement of mass and the transfer of heat in the polar region. In the autumn, the circumpolar winds increase in speed and the polar vortex rises into the stratosphere. The result is the polar air forms a coherent rotating air mass: the polar vortex. As winter approaches, the vortex core cools, the winds decrease, and the vortex energy declines. Once late winter and early spring approach the vortex is at its weakest. As a result, during late winter, large fragments of the vortex air can be diverted into lower latitudes by stronger weather systems intruding from those latitudes. In the lowest level of the stratosphere, strong potential vorticity gradients remain, and the majority of that air remains confined within the polar air mass into December in the Southern Hemisphere and April in the Northern Hemisphere, well after the breakup of the vortex in the mid-stratosphere.[15]
The breakup of the northern polar vortex occurs between mid March to mid May. This event signifies the transition from winter to spring, and has impacts on the hydrological cycle, growing seasons of vegetation, and overall ecosystem productivity. The timing of the transition also influences changes in sea ice, ozone, air temperature, and cloudiness. Early and late polar breakup episodes have occurred, due to variations in the stratospheric flow structure and upward spreading of planetary waves from the troposphere. As a result of increased waves into the vortex, the vortex experiences more rapid warming than normal, resulting in an earlier breakup and spring. When the breakup comes early, it is characterized by with persistent of remnants of the vortex. When the breakup is late, the remnants dissipate rapidly. When the breakup is early, there is one warming period from late February to middle March. When the breakup is late, there are two warming periods, one January, and one in March. Zonal mean temperature, wind, and geopotential height exert varying deviations from their normal values before and after early breakups, while the deviations remain constant before and after late breakups. Scientists are connecting a delay in the Arctic vortex breakup with a reduction of planetary wave activities, few stratospheric sudden warming events, and depletion of ozone.[16][17]
Sudden stratospheric warming events are associated with weaker polar vortices. This warming of stratospheric air can reverse the circulation in the Arctic Polar Vortex from counter-clockwise to clockwise.[18] These changes aloft force changes in the troposphere below.[19] An example of an effect on the troposphere is the change in speed of the Atlantic Ocean circulation pattern. A soft spot just south of Greenland is where the initial step of downwelling occurs, nicknamed the "Achilles Heel of the North Atlantic". Small amounts of heating or cooling traveling from the polar vortex can trigger or delay downwelling, altering the Gulf Stream Current of the Atlantic, and the speed of other ocean currents. Since all other oceans depend on the Atlantic Ocean's movement of heat energy, climates across the planet can be dramatically affected. The weakening or strengthening of the polar vortex can alter the sea circulation more than a mile beneath the waves.[20] Strengthening storm systems within the troposphere that cool the poles, intensify the polar vortex. La Niña–related climate anomalies significantly strengthen the polar vortex.[21] Intensification of the polar vortex produces changes in relative humidity as downward intrusions of dry, stratospheric air enter the vortex core. With a strengthening of the vortex comes a longwave cooling due to a decrease in water vapor concentration near the vortex. The decreased water content is a result of a lower tropopause within the vortex, which places dry stratospheric air above moist tropospheric air.[22] Instability is caused when the vortex tube, the line of concentrated vorticity, is displaced. When this occurs, the vortex rings become more unstable and prone to shifting by planetary waves.The planetary wave activity in both hemispheres varies year-to-year, producing a corresponding response in the strength and temperature of the polar vortex.[23] The number of waves around the perimeter of the vortex are related to the core size; as the vortex core decreases, the number of waves increase.[24]
The degree of the mixing of polar and mid-latitude air depends on the evolution and position of the polar night jet. In general, the mixing is less inside the vortex than outside. Mixing occurs with unstable planetary waves that are characteristic of the middle and upper stratosphere in winter. Prior to vortex breakdown, there is little transport of air out of the Arctic Polar Vortex due to strong barriers above 420 km (261 miles). The polar night jet which exists below this, is weak in the early winter. As a result, it does not deviate any descending polar air, which then mixes with air in the mid-latitudes. In the late winter, air parcels do not descend as much, reducing mixing.[25] After the vortex is broken up, the ex-vortex air is dispersed into the middle latitudes within a month.[26]
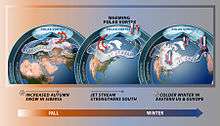
Sometimes, a mass of the polar vortex breaks off before the end of the final warming period. If large enough, the piece can move into Canada and the Midwestern, Central, Southern, and Northeastern United States. This diversion of the polar vortex can occur due to the displacement of the polar jet stream; for example, the significant northwestward direction of the polar jet stream in the western part of the United States during the winters of 2013–2014, and 2014-2015. This caused warm, dry conditions in the west, and cold, snowy conditions in the east.[27] Occasionally, the high-pressure air mass, called the Greenland Block, can cause the polar vortex to divert to the south, rather than follow its normal path over the North Atlantic.[28]
Climate change
A study in 2001 found that stratospheric circulation can have anomalous effects on weather regimes.[29] In the same year researchers found a statistical correlation between weak polar vortex and outbreaks of severe cold in the Northern Hemisphere.[30][31] In more recent years scientists identified interactions with Arctic sea ice decline, reduced snow cover, evapotranspiration patterns, NAO anomalies or weather anomalies which are linked to the polar vortex and jet stream configuration.[29][31][32][33][34][35][36][37] However, because the specific observations are considered short-term observations (starting c. 13 years ago) there is considerable uncertainty in the conclusions. Climatology observations require several decades to definitively distinguish natural variability from climate trends.

The general assumption is that reduced snow cover and sea ice reflect less sunlight and therefore evaporation and transpiration increases, which in turn alters the pressure and temperature gradient of the polar vortex, causing it to weaken or collapse. This becomes apparent when the jet stream amplitude increases (meanders) over the northern hemisphere, causing Rossby waves to propagate farther to the south or north, which in turn transports warmer air to the north pole and polar air into lower latitudes. The jet stream amplitude increases with a weaker polar vortex, hence increases the chance for weather systems to become blocked. A recent blocking event emerged when a high-pressure over Greenland steered Hurricane Sandy into the northern Mid-Atlantic states.[38]
Ozone depletion
The chemistry of the Antarctic polar vortex has created severe ozone depletion. The nitric acid in polar stratospheric clouds reacts with chlorofluorocarbons to form chlorine, which catalyzes the photochemical destruction of ozone.[39] Chlorine concentrations build up during the polar winter, and the consequent ozone destruction is greatest when the sunlight returns in spring.[40] These clouds can only form at temperatures below about −80 °C (−112 °F). Since there is greater air exchange between the Arctic and the mid-latitudes, ozone depletion at the north pole is much less severe than at the south.[41] Accordingly, the seasonal reduction of ozone levels over the Arctic is usually characterized as an "ozone dent", whereas the more severe ozone depletion over the Antarctic is considered an "ozone hole". This said, chemical ozone destruction in the 2011 Arctic polar vortex attained, for the first time, a level clearly identifiable as an Arctic "ozone hole".
Outside Earth

Other astronomical bodies are also known to have polar vortices, including Venus (double vortex—that is, two polar vortices at a pole),[42] Mars, Jupiter, Saturn, and Saturn's moon Titan.
Hot polar vortex
Saturn's south pole is the only known hot polar vortex in the solar system.[43]
See also
- Polar amplification
- Windward Performance Perlan II - will be used to study the polar vortex
![]() Weather portal
Weather portal
References
- ↑ Halldór Björnsson. "Global circulation". Retrieved September 2, 2016.. Veðurstofa Íslands. Retrieved on 2008-06-15.
- 1 2 "Polar vortex". Glossary of Meteorology. American Meteorological Society. June 2000. Retrieved 15 June 2008.
- ↑ "Stratospheric Polar Vortex Influences Winter Cold, Researchers Say" (Press release). American Association for the Advancement of Science. December 3, 2001. Retrieved May 23, 2015.
- ↑ "Air Maps", Littell's Living Age No. 495, 12 November 1853, p. 430.
- ↑ "GEOS-5 Analyses and Forecasts of the Major Stratospheric Sudden Warming of January 2013" (Press release). Goddard Space Flight Center. Retrieved January 8, 2014.
- ↑ http://blog.quarkexpeditions.com/polar-vortex-the-science-myth-media-hype-behind-north-american-weather-phenomenon[][]
- ↑ Hartmann, D; Schoeberl, M (1991). "Mixing of polar vortex air into middle latitudes as revealed by tracer-tracer scatterplots". Journal of Geophysical Research. 102: 13119. Bibcode:1997JGR...10213119W. doi:10.1029/96JD03715.
- 1 2 Cavallo, Steven M.; Hakim, Gregory J. (April 2009). "Potential Vorticity Diagnosis of a Tropopause Polar Cyclone". Monthly Weather Review. 137 (4): 1358–1371. Bibcode:2009MWRv..137.1358C. doi:10.1175/2008MWR2670.1.
- ↑ Kolstad, Erik W.; Breiteig, Tarjei; Scaife, Adam A. (April 2010). "The association between stratospheric weak polar vortex events and cold air outbreaks in the Northern Hemisphere". Quarterly Journal of the Royal Meteorological Society. Royal Meteorological Society. 136: 887. Bibcode:2010EGUGA..12.5739K. doi:10.1002/qj.620.
- ↑ Abdolreza Kashki & Javad Khoshhal (2013-11-22). "Investigation of the Role of Polar Vortex in Iranian First and Last Snowfalls". Journal of Geology and Geography. Canadian Center of Science and Education. 5 (4). ISSN 1916-9779.
- ↑ Erik A. Rasmussen and John Turner (2003). Polar lows: mesoscale weather systems in the polar regions. Cambridge University Press. p. 174. ISBN 978-0-521-62430-5.
- ↑ Robock, Alan (2000). "Volcanic eruptions and climate". Reviews of Geophysics. 38 (2): 191–219. Bibcode:2000RvGeo..38..191R. doi:10.1029/1998RG000054.
- ↑ Todd Mitchell (2004). Arctic Oscillation (AO) time series, 1899 – June 2002. University of Washington. Retrieved on 2009-03-02.
- ↑ Kevin Myatt (2005-01-17). Cold enough for snow, and more's on the way. Roanoke Times. Retrieved on 2012-02-24.
- ↑ Nash, E; Newman, P; Rosenfield, J; Schoeberl, M (2012). "An objective determination of the polar vortex using Ertel's potential vorticity". Journal of Geophysical Research. 101 (D5): 9471–9478. Bibcode:1996JGR...101.9471N. doi:10.1029/96JD00066.
- ↑ Li, L; Li, C; Pan, Y (2012). "On the differences and climate impacts of early and late stratospheric polar vortex breakup". Advances in Atmospheric Sciences. 29 (5): 1119–1128. Bibcode:2012AdAtS..29.1119L. doi:10.1007/s00376-012-1012-4.
- ↑ Wei, K; Chen, W; Huang, R (2007). "Dynamical diagnosis of the breakup of the stratospheric polar vortex in the northern hemisphere". Science in China Series D (Earth Sciences). 50 (9): 1369–1379. doi:10.1007/s11430-007-0100-2.
- ↑ Reichler, Tom; Kim, J; Manzini, E; Kroger, J (2012). "A stratospheric connection to Atlantic climate variability". Nature Geoscience. 5: 783–787. Bibcode:2012NatGe...5..783R. doi:10.1038/ngeo1586.
- ↑ Ripesi, Patrizio; et al. (2012). "The February 2010 Artcic Oscillation Index and its stratospheric connection" (PDF). Quarterly Journal of the Royal Meteorological Society. 138: 1961–1969. Bibcode:2012QJRMS.138.1961R. doi:10.1002/qj.1935.
- ↑ Reichler, Tom; Kim, J; Manzini, E; Kroger, J (2012). "A stratospheric connection to Atlantic climate variability". Nature Geoscience. 5: 783–787. Bibcode:2012NatGe...5..783R. doi:10.1038/ngeo1586.
- ↑ Limpasuvan, Varavut; Hartmann, Dennis L.; Thompson, David W. J.; Jeev, Kumar; Yung, Yuk L. (2005). "Stratosphere-troposphere evolution during polar vortex intensification" (PDF). Journal of Geophysical Research. 110 (D24): 27. Bibcode:2005JGRD..11024101L. doi:10.1029/2005JD006302.
- ↑ Cavallo, S; Hakim, G.J. (2013). "Physical mechanisms of tropopause polar vortex intensity change". Journal of the Atmospheric Sciences. 70 (11): 3359–3373. doi:10.1175/JAS-D-13-088.1.
- ↑ Hartmann, D; Schoeberl, M (1991). "The dynamics of the stratospheric polar vortex and its relation to springtime ozone depletions". Science. 251 (4989): 46–52. Bibcode:1991Sci...251...46S. doi:10.1126/science.251.4989.46. PMID 17778602.
- ↑ Widnall, S; Sullivan, J (1973). "On the stability of vortex rings". Proceedings of the Royal Society of London. Series A, Mathematical and Physical Sciences. 332 (1590): 335–353. Bibcode:1973RSPSA.332..335W. doi:10.1098/rspa.1973.0029.
- ↑ Manney, G; Zurek, R; O'Neill, A; Swinbank, R (1994). "On the motion of air through the stratospheric polar vortex". Journal of the Atmospheric Sciences. 51 (20): 2973–2994. Bibcode:1994JAtS...51.2973M. doi:10.1175/1520-0469(1994)051<2973:otmoat>2.0.co;2.
- ↑ Waugh, D; Plumb, R; Elkins, J; Fahey, D; Boering, K; Dutton, G; Lait, L (2012). "Mixing of polar vortex air into middle latitudes as revealed by tracer-tracer scatterplots". Journal of Geophysical Research: Atmospheres. 102 (D11): 13199–1314. Bibcode:1997JGR...10213119W. doi:10.1029/96JD03715.
- ↑ "Archived copy". Archived from the original on 2015-12-07. Retrieved 2015-11-26.
- ↑ Erdman, Jon (2014). "What's a Polar Vortex?: The Science Behind Arctic Outbreaks". wunderground. Retrieved 25 February 2014.
- 1 2 Baldwin, M. P.; Dunkerton, TJ (2001). "Stratospheric Harbingers of Anomalous Weather Regimes". Science. 294 (5542): 581–4. Bibcode:2001Sci...294..581B. doi:10.1126/science.1063315. PMID 11641495.
- ↑ NASA (December 21, 2001). "Stratospheric Polar Vortex Influences Winter Cold". Earth Observatory. Retrieved January 7, 2014.
- 1 2 Song, Yucheng; Robinson, Walter A. (2004). "Dynamical Mechanisms for Stratospheric Influences on the Troposphere". Journal of the Atmospheric Sciences. 61 (14): 1711–25. Bibcode:2004JAtS...61.1711S. doi:10.1175/1520-0469(2004)061<1711:DMFSIO>2.0.CO;2.
- ↑ Overland, James E. (2013). "Atmospheric science: Long-range linkage". Nature Climate Change. 4: 11–2. Bibcode:2014NatCC...4...11O. doi:10.1038/nclimate2079.
- ↑ Tang, Qiuhong; Zhang, Xuejun; Francis, Jennifer A. (2013). "Extreme summer weather in northern mid-latitudes linked to a vanishing cryosphere". Nature Climate Change. 4: 45–50. Bibcode:2014NatCC...4...45T. doi:10.1038/nclimate2065.
- ↑ Screen, J A (2013). "Influence of Arctic sea ice on European summer precipitation". Environmental Research Letters. 8 (4): 044015. Bibcode:2013ERL.....8d4015S. doi:10.1088/1748-9326/8/4/044015.
- ↑ Francis, Jennifer A.; Vavrus, Stephen J. (2012). "Evidence linking Arctic amplification to extreme weather in mid-latitudes". Geophysical Research Letters. 39 (6): n/a. Bibcode:2012GeoRL..39.6801F. doi:10.1029/2012GL051000.
- ↑ Petoukhov, Vladimir; Semenov, Vladimir A. (2010). "A link between reduced Barents-Kara sea ice and cold winter extremes over northern continents". Journal of Geophysical Research. 115. Bibcode:2010JGRD..11521111P. doi:10.1029/2009JD013568.
- ↑ Masato, Giacomo; Hoskins, Brian J.; Woollings, Tim (2013). "Winter and Summer Northern Hemisphere Blocking in CMIP5 Models". Journal of Climate. 26 (18): 7044–59. doi:10.1175/JCLI-D-12-00466.1.
- ↑ Friedlander, Blaine (March 4, 2013). "Arctic ice loss amplified Superstorm Sandy violence". Cornell Chronicle.
- ↑ J. A. Pyle (1997-04-08). The Arctic and environmental change. CRC Press. pp. 42–44. ISBN 978-90-5699-020-6.
- ↑ Rolf Müller (2010). Tracer-tracer Relations as a Tool for Research on Polar Ozone Loss. Forschungszentrum Jülich. p. 47. ISBN 978-3-89336-614-9.
- ↑ K. Mohanakuma (2008). Stratosphere troposphere interactions: an introduction. Springer. p. 34. ISBN 978-1-4020-8216-0.
- ↑ "Double vortex at Venus South Pole unveiled". European Space Agency. Retrieved June 2006. Check date values in:
|access-date=(help) - ↑ "Saturn's Bull's-Eye Marks Its Hot Spot". NASA. 2005. Retrieved January 8, 2014.
Further reading
- Nash, Eric R.; Newman, Paul A.; Rosenfield, Joan E.; Schoeberl, Mark R. (1996). "An objective determination of the polar vortex using Ertel's potential vorticity". Journal of Geophysical Research. 101: 9471–8. Bibcode:1996JGR...101.9471N. doi:10.1029/96JD00066.
- Butchart, Neal; Remsberg, Ellis E. (1986). "The Area of the Stratospheric Polar Vortex as a Diagnostic for Tracer Transport on an Isentropic Surface". Journal of the Atmospheric Sciences. 43 (13): 1319–39. Bibcode:1986JAtS...43.1319B. doi:10.1175/1520-0469(1986)043<1319:TAOTSP>2.0.CO;2.
- Schoeberl, Mark R.; Lait, Leslie R.; Newman, Paul A.; Rosenfield, Joan E. (1992). "The structure of the polar vortex". Journal of Geophysical Research. 97 (D8): 7859–82. Bibcode:1992JGR....97.7859S. doi:10.1029/91JD02168.
- Coy, Lawrence; Nash, Eric R.; Newman, Paul A. (1997). "Meteorology of the polar vortex: Spring 1997". Geophysical Research Letters. 24 (22): 2693–6. Bibcode:1997GeoRL..24.2693C. doi:10.1029/97GL52832.
- Schoeberl, M. R.; Hartmann, D. L. (1991). "The Dynamics of the Stratospheric Polar Vortex and Its Relation to Springtime Ozone Depletions". Science. 251 (4989): 46–52. Bibcode:1991Sci...251...46S. doi:10.1126/science.251.4989.46. PMID 17778602.
External links
| Wikimedia Commons has media related to Polar Vortex. |
- "Archive of Northern and Southern Hemisphere Blocking Events". Global Climate Change Group. Retrieved January 7, 2014.
- "Polar vortex". European Environment Agency Environmental Terminology and Discovery Service (ETDS). Retrieved January 6, 2014.
- "World temperature gradient". Integrated Publishing: Aerographer/Meteorology. Retrieved January 29, 2005.
- "The Antarctic Polar Vortex". Dynamics in the Ocean and Atmosphere. Retrieved January 29, 2005.
- "The Polar Vortex and Arctic Weather Patterns". Arctic Climatology and Meteorology. National Snow and Ice Data Center. Retrieved January 29, 2005.
- "NASA Sees into the Eye of a Monster Storm on Saturn". Cassini-Huygens: News-Press Releases-2006. Retrieved November 12, 2006.