Plymouth Sutton (UK Parliament constituency)
| Plymouth, Sutton | |
|---|---|
|
Former Borough constituency for the House of Commons | |
|
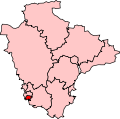
Boundary of Plymouth, Sutton in Devon for the 2005 general election. | |
|
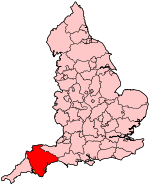
Location of Devon within England. | |
| County | Devon |
| 1918–2010 | |
| Number of members | One |
| Replaced by | Plymouth Moor View, Plymouth Sutton and Devonport |
Plymouth, Sutton was, from 1918 until 2010, a borough constituency represented in the House of Commons of the Parliament of the United Kingdom. It elected one Member of Parliament (MP) by the first past the post system of election.
History
Plymouth Sutton covered parts of the city of Plymouth, in South West England, and was first contested at the 1918 general election. In a by-election in 1919, it became the second constituency in the UK (and the first in Great Britain) to elect a female MP: Nancy Astor became the first woman to take a seat in the House of Commons (the first female MP was the Sinn Féin member Constance Markievicz, who did not take her seat). Three of its MPs have been members of the Astor family. A more recent prominent MP was the flamboyant Conservative Alan Clark, who represented Plymouth Sutton from 1974 until 1992.
Abolition
Following a review of parliamentary representation in Devon by the Boundary Commission for England, constituencies in Plymouth have been reorganised, with both Plymouth Sutton and Plymouth Devonport being replaced by new constituencies of Plymouth Sutton and Devonport and Plymouth Moor View from 2010.[1]
Boundaries
1918-1950: The County Borough of Plymouth wards of Charles, Compton, Friary, Laira, St Andrew, Sutton, and Vintry.
1950-1955: The County Borough of Plymouth wards of Charles, Compton, Crownhill, Drake, Friary, Laira, Mutley, St Andrew, Sutton, Valletort, and Vintry, and in the Rural District of Plympton St Mary the civil parish of Bickleigh.
1955-1974: The County Borough of Plymouth wards of Charles, Compton, Crownhill, Efford, Friary, Mount Gould, Peverell, Sutton, Tamerton, and Trelawney.
1974-1983: The County Borough of Plymouth wards of Crownhill, Efford, Mount Gould, Plympton Erle, Plympton St Mary, Plymstock Dunstone, Plymstock Radford, and Sutton.
1983-1997: The City of Plymouth wards of Efford, Eggbuckland, Mount Gould, Plympton Erle, Plympton St Mary, Plymstock Dunstone, and Plymstock Radford.
1997-2010: The City of Plymouth wards of Compton, Drake, Efford, Mount Gould, St Peter, Stoke, Sutton, and Trelawny.
The 1997 boundary changes were superficially helpful to Labour in this constituency: what had been a safe Conservative seat became a marginal seat. As such the seat from 1997 until 2010 was closer in its wards to the defunct marginal seat of Plymouth Drake.[2]
Members of Parliament
| Election | Member[3] | Party | |
|---|---|---|---|
| 1918 | Waldorf Astor | Conservative | |
| 1919 by-election | Nancy Astor | Conservative | |
| 1945 | Lucy Middleton | Labour | |
| 1951 | Jakie Astor | Conservative | |
| 1959 | Ian Fraser | Conservative | |
| 1966 | David Owen | Labour | |
| Feb 1974 | Alan Clark | Conservative | |
| 1992 | Gary Streeter | Conservative | |
| 1997 | Linda Gilroy | Labour | |
| 2010 | constituency abolished: see Plymouth Moor View & Plymouth Sutton and Devonport | ||
Elections
Elections in the 1910s

| Party | Candidate | Votes | % | ± | |
|---|---|---|---|---|---|
| Unionist | 17,091 | 65.9 | N/A | ||
| Labour | William Thomas Gay | 5,334 | 20.6 | N/A | |
| Liberal | Capt. Sidney Ransom | 3,488 | 13.5 | N/A | |
| Majority | 11,757 | 45.3 | |||
| Turnout | 59.6 | N/A | |||
| Unionist hold | Swing | N/A | |||
- endorsed by the Coalition Government
| Party | Candidate | Votes | % | ± | |
|---|---|---|---|---|---|
| Coalition Unionist | Lady Nancy Witcher Langhorne Astor | 14,495 | 51.9 | ||
| Labour | William Thomas Gay | 9,292 | 33.3 | ||
| Liberal | Isaac Foot | 4,139 | 14.8 | ||
| Majority | 5,203 | 18.6 | |||
| Turnout | |||||
| Coalition Unionist hold | Swing | ||||
Elections in the 1920s
| Party | Candidate | Votes | % | ± | |
|---|---|---|---|---|---|
| Unionist | Lady Nancy Witcher Langhorne Astor | 13,924 | 47.4 | ||
| Labour | Frederick George Woulfe-Brenan | 10,831 | 36.8 | ||
| Independent Unionist | Hugh Wansey Bayly | 4,643 | 15.8 | ||
| Majority | 3,093 | 10.6 | |||
| Turnout | 78.0 | ||||
| Unionist hold | Swing | ||||
| Party | Candidate | Votes | % | ± | |
|---|---|---|---|---|---|
| Unionist | Lady Nancy Witcher Langhorne Astor | 16,114 | 54.5 | +7.1 | |
| Labour | Frederick George Woulfe-Brenan | 13,438 | 45.5 | +8.7 | |
| Majority | 2,676 | 9.0 | -1.6 | ||
| Turnout | 77.9 | -0.1 | |||
| Unionist hold | Swing | -0.8 | |||
| Party | Candidate | Votes | % | ± | |
|---|---|---|---|---|---|
| Unionist | Lady Nancy Witcher Langhorne Astor | 18,174 | 58.1 | ||
| Labour | Frederick George Woulfe-Brenan | 13,095 | 41.9 | ||
| Majority | 5,079 | 16.2 | |||
| Turnout | 81.6 | ||||
| Unionist hold | Swing | ||||
| Party | Candidate | Votes | % | ± | |
|---|---|---|---|---|---|
| Unionist | Lady Nancy Witcher Langhorne Astor | 16,625 | 43.2 | -15.9 | |
| Labour | William Westwood | 16,414 | 42.7 | +0.8 | |
| Liberal | Thomas Henry Aggett | 5,430 | 14.1 | n/a | |
| Majority | 211 | 0.5 | -15.7 | ||
| Turnout | 81.1 | -0.5 | |||
| Unionist hold | Swing | -7.8 | |||
Elections in the 1930s
| Party | Candidate | Votes | % | ± | |
|---|---|---|---|---|---|
| Conservative | Lady Nancy Witcher Langhorne Astor | 24,277 | 63.3 | ||
| Labour | George Ward | 14,073 | 36.7 | ||
| Majority | 10,204 | 26.6 | |||
| Turnout | 80.1 | ||||
| Conservative hold | Swing | ||||
| Party | Candidate | Votes | % | ± | |
|---|---|---|---|---|---|
| Conservative | Lady Nancy Witcher Langhorne Astor | 21,491 | 58.3 | ||
| Labour | George Ward | 15,394 | 41.7 | ||
| Majority | 6,097 | 16.6 | |||
| Turnout | 77.6 | ||||
| Conservative hold | Swing | ||||
General Election 1939/40: Another General Election was required to take place before the end of 1940. The political parties had been making preparations for an election to take place and by the Autumn of 1939, the following candidates had been selected;
- Conservative: Lady Nancy Witcher Langhorne Astor
- Labour: Lucy Annie Middleton[5]
Elections in the 1940s
| Party | Candidate | Votes | % | ± | |
|---|---|---|---|---|---|
| Labour | Lucy Annie Middleton | 15,417 | 51.6 | ||
| Conservative | Brig. Laurence Douglas Grand | 10,738 | 36.0 | ||
| Liberal | Joan Arundell Gaved | 3,695 | 12.4 | ||
| Majority | 4,679 | 15.6 | |||
| Turnout | 71.9 | ||||
| Labour gain from Conservative | Swing | ||||
Elections in the 1950s
| Party | Candidate | Votes | % | ± | |
|---|---|---|---|---|---|
| Labour | Lucy Annie Middleton | 27,512 | 47.73 | ||
| Conservative | John Jacob Astor | 26,588 | 46.13 | ||
| Liberal | Kenneth Henry B Major | 3,541 | 6.14 | ||
| Majority | 924 | 1.60 | |||
| Turnout | 86.40 | ||||
| Labour hold | Swing | ||||
| Party | Candidate | Votes | % | ± | |
|---|---|---|---|---|---|
| Conservative | John Jacob Astor | 28,908 | 50.62 | ||
| Labour | Lucy Annie Middleton | 28,198 | 49.38 | ||
| Majority | 710 | 1.24 | |||
| Turnout | 85.37 | ||||
| Conservative gain from Labour | Swing | ||||
| Party | Candidate | Votes | % | ± | |
|---|---|---|---|---|---|
| Conservative | John Jacob Astor | 30,051 | 53.38 | ||
| Labour | Lucy Annie Middleton | 26,241 | 46.62 | ||
| Majority | 3,810 | 6.77 | |||
| Turnout | 78.88 | ||||
| Conservative hold | Swing | ||||
| Party | Candidate | Votes | % | ± | |
|---|---|---|---|---|---|
| Conservative | Ian Montagu Fraser | 32,752 | 55.75 | ||
| Labour | Julian D. Richards | 25,991 | 44.52 | ||
| Majority | 6,761 | 11.51 | |||
| Turnout | 79.30 | ||||
| Conservative hold | Swing | ||||
Elections in the 1960s
| Party | Candidate | Votes | % | ± | |
|---|---|---|---|---|---|
| Conservative | Ian Montagu Fraser | 24,722 | 43.82 | ||
| Labour | John Elliot Orr Dunwoody | 24,312 | 43.09 | ||
| Liberal | Graham Cocks | 7,383 | 13.09 | ||
| Majority | 410 | 0.73 | |||
| Turnout | 76.66 | ||||
| Conservative hold | Swing | ||||
| Party | Candidate | Votes | % | ± | |
|---|---|---|---|---|---|
| Labour | David Anthony Llewellyn Owen | 31,567 | 54.51 | ||
| Conservative | Ian Montagu Fraser | 26,345 | 45.49 | ||
| Majority | 5,222 | 9.02 | |||
| Turnout | 78.90 | ||||
| Labour gain from Conservative | Swing | ||||
Elections in the 1970s
| Party | Candidate | Votes | % | ± | |
|---|---|---|---|---|---|
| Labour | David Anthony Llewellyn Owen | 29,383 | 50.64 | ||
| Conservative | John M. Goss | 28,636 | 49.36 | ||
| Majority | 747 | 1.29 | |||
| Turnout | 72.27 | ||||
| Labour hold | Swing | ||||
New constituency boundaries came into effect in time for the following election in February 1974.
| Party | Candidate | Votes | % | ± | |
|---|---|---|---|---|---|
| Conservative | Alan Kenneth Mackenzie Clark | 21,649 | 45.22 | ||
| Labour | BW Fletcher | 13,545 | 28.29 | ||
| Liberal | Simon Godfrey Banks | 12,683 | 26.49 | ||
| Majority | 8,104 | 16.93 | |||
| Turnout | 47,876 | 79.07 | |||
| Conservative gain from Labour | Swing | ||||
| Party | Candidate | Votes | % | ± | |
|---|---|---|---|---|---|
| Conservative | Alan Kenneth Mackenzie Clark | 20,457 | 44.61 | ||
| Labour | Julian Gordon Priestley | 15,269 | 33.3 | ||
| Liberal | Simon Godfrey Banks | 10,131 | 22.09 | ||
| Majority | 5,188 | 11.31 | |||
| Turnout | 45,858 | 75.17 | |||
| Conservative hold | Swing | ||||
| Party | Candidate | Votes | % | ± | |
|---|---|---|---|---|---|
| Conservative | Alan Kenneth Mackenzie Clark | 28,892 | 54.8 | ||
| Labour | Julian Gordon Priestley | 17,605 | 33.39 | ||
| Liberal | J Scannell | 6,226 | 11.81 | ||
| Majority | 11,287 | 21.41 | |||
| Turnout | 52,723 | 76.95 | |||
| Conservative hold | Swing | ||||
Elections in the 1980s
| Party | Candidate | Votes | % | ± | |
|---|---|---|---|---|---|
| Conservative | Alan Clark | 25,203 | 55.12 | ||
| Liberal | A Puttick | 13,516 | 29.56 | ||
| Labour | Frances Holland | 6,358 | 14.3 | ||
| Ecology | S Shaw | 470 | 1.03 | ||
| Majority | 11,687 | 25.56 | |||
| Turnout | 45,726 | 76.35 | |||
| Conservative hold | Swing | ||||
| Party | Candidate | Votes | % | ± | |
|---|---|---|---|---|---|
| Conservative | Alan Clark | 23,187 | 45.76 | ||
| Liberal | Bruce Malcolm Tidy | 19,174 | 37.84 | ||
| Labour | Ralph Donald Maddern | 8,310 | 16.4 | ||
| Majority | 4,013 | 7.92 | |||
| Turnout | 50,674 | 79.03 | |||
| Conservative hold | Swing | −3.8 | |||
Elections in the 1990s
| Party | Candidate | Votes | % | ± | |
|---|---|---|---|---|---|
| Conservative | Gary Streeter | 27,070 | 49.5 | +3.7 | |
| Labour | Andrew Pawley | 15,120 | 27.6 | +11.2 | |
| Liberal Democrat | Julian P. Brett-Freeman | 12,291 | 22.5 | −15.4 | |
| Natural Law | Jeremy J. Bowler | 256 | 0.5 | +0.5 | |
| Majority | 11,950 | 21.8 | +13.9 | ||
| Turnout | 54,737 | 81.2 | +2.2 | ||
| Conservative hold | Swing | −3.8 | |||
| Party | Candidate | Votes | % | ± | |
|---|---|---|---|---|---|
| Labour Co-op | Linda Gilroy | 23,881 | 50.1 | +11.3 | |
| Conservative | Andrew Crisp | 14,441 | 30.3 | −11.5 | |
| Liberal Democrat | Steve Melia | 6,613 | 13.9 | +0.7 | |
| Referendum | Tim Hanbury | 1,654 | 3.5 | ||
| UKIP | Roger Bullock | 499 | 1.1 | ||
| Plymouth First Group | Kevin Kelway | 396 | 0.8 | ||
| Natural Law | Frank Lyons | 168 | 0.4 | −0.1 | |
| Majority | 9,440 | 19.8 | +17.8 | ||
| Turnout | 47,650 | 67.4 | |||
| Labour gain from Conservative | Swing | 11.4 | |||
Elections in the 2000s
| Party | Candidate | Votes | % | ± | |
|---|---|---|---|---|---|
| Labour Co-op | Linda Gilroy | 19,827 | 50.7 | +0.6 | |
| Conservative | Oliver Colvile[13] | 12,310 | 31.5 | +1.2 | |
| Liberal Democrat | Alan Connett | 5,605 | 14.3 | +0.5 | |
| UKIP | Alan Whitton | 970 | 2.5 | +1.4 | |
| Socialist Labour | Henry Leary | 361 | 0.9 | N/A | |
| Majority | 7,517 | 19.2 | −0.6 | ||
| Turnout | 39,073 | 57.1 | −10.3 | ||
| Labour Co-op hold | Swing | −0.3 | |||
| Party | Candidate | Votes | % | ± | |
|---|---|---|---|---|---|
| Labour Co-op | Linda Gilroy | 15,497 | 40.6 | −10.1 | |
| Conservative | Oliver Colvile[13] | 11,388 | 29.8 | −1.7 | |
| Liberal Democrat | Karen Gillard | 8,685 | 22.7 | +8.4 | |
| UKIP | Robert Cumming | 2,392 | 6.3 | +3.8 | |
| Socialist Labour | Rob Hawkins | 230 | 0.6 | −0.3 | |
| Majority | 4,109 | 10.8 | −8.4 | ||
| Turnout | 38,192 | 56.8 | −0.3 | ||
| Labour Co-op hold | Swing | −4.2 | |||
See also
Notes and references
- ↑ "Final recommendations for Parliamentary constituencies in the counties of Devon, Plymouth and Torbay". Boundary Commission for England. 24 November 2004. Retrieved 25 April 2010.
- ↑ C. Rallings & M. Thrasher, The Media Guide to the New Parliamentary Constituencies, pp.133, 244 (Plymouth: LGC Elections Centre, 1995).
- ↑ Leigh Rayment's Historical List of MPs – Constituencies beginning with "P" (part 2)
- 1 2 3 4 5 6 7 8 British Parliamentary Election Results 1918-1949, FWS Craig
- ↑ Report of the Annual Conference of the Labour Party, 1939
- ↑ "UK General Election results: May 1979". Politicsresources.net. 1979-05-28. Retrieved 2016-07-23.
- ↑ "UK General Election results: June 1983". Politicsresources.net. 1983-06-09. Retrieved 2016-07-23.
- ↑ "Politics Resources". Election 1992. Politics Resources. 9 April 1992. Retrieved 6 December 2010.
- ↑ "Politics Resources". Election 1997. Politics Resources. 1 May 1997. Retrieved 7 January 2011.
- ↑ C. Rallings & M. Thrasher, The Media Guide to the New Parliamentary Constituencies, p.133 (Plymouth: LGC Elections Centre, 1995)
- ↑ The 1997 election result has swings relative to the notional, not the actual, 1992 result.
- ↑ "Plymouth Sutton". ElectionWeb Project. Cognitive Computing Limited. Archived from the original on 2 June 2016. Retrieved 19 May 2016.
- 1 2 Oliver Colvile, Official PPC Website
Sources
- Craig, F. W. S. (1983) [1969]. British parliamentary election results 1918–1949 (3rd ed.). Chichester: Parliamentary Research Services. ISBN 0-900178-06-X.
Coordinates: 50°22′N 4°08′W / 50.37°N 4.14°W