Pivot table
In data processing, a pivot table is a data summarization tool found in data visualization programs such as spreadsheets or business intelligence software. Among other functions, a pivot table can automatically sort, count, total or give the average of the data stored in one table or spreadsheet, displaying the results in a second table showing the summarized data. Pivot tables are also useful for quickly creating unweighted cross tabulations. The user sets up and changes the summary's structure by dragging and dropping fields graphically. This "rotation" or pivoting of the summary table gives the concept its name.
The term pivot table is a generic phrase used by multiple vendors. In the United States, Microsoft Corporation has trademarked the specific compound word form, PivotTable.[1]
Pivot tables can be seen as a simplification of the more complete and complex online analytical processing concepts (OLAP).
History
In their book Pivot Table Data Crunching,[2] Bill Jelen and Mike Alexander refer to Pito Salas as the "father of pivot tables". While working on a concept for a new program that would eventually become Lotus Improv, Salas noted that spreadsheets have patterns of data. A tool that could help the user recognize these patterns would help to build advanced data models quickly. With Improv, users could define and store sets of categories, then change views by dragging category names with the mouse. This core functionality would provide the model for pivot tables.
Lotus Development released Improv in 1991 on the NeXT platform. A few months after the release of Improv, Brio Technology published a standalone Macintosh implementation, called DataPivot (with technology eventually patented in 1999[3]). Borland purchased the DataPivot technology in 1992 and implemented it in their own spreadsheet application, Quattro Pro.
In 1993 the Microsoft Windows version of Improv appeared. Early in 1994 Microsoft Excel 5 [4] brought a new functionality called a "PivotTable" to market. Microsoft further improved this feature in later versions of Excel:
- Excel 97 included a new and improved PivotTable Wizard, the ability to create calculated fields, and new pivot cache objects that allow developers to write Visual Basic for Applications macros to create and modify pivot tables
- Excel 2000 introduced "Pivot Charts" to represent pivot-table data graphically
In 2007 Oracle Corporation made PIVOT and UNPIVOT operators available in Oracle Database 11g.[5]
Mechanics
For typical data entry and storage, data usually appear in flat tables, meaning that they consist of only columns and rows, as in the following example showing data on shirt types:
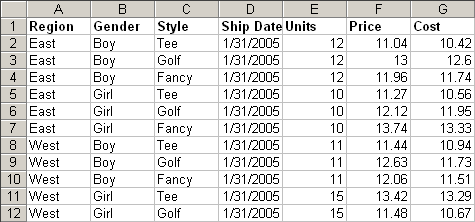
While tables such as these can contain many data items, it can be difficult to get summarized information from them. A pivot table can help quickly summarize the data and highlight the desired information. The usage of a pivot table is extremely broad and depends on the situation. The first question to ask is, "What am I seeking?" In the example here, let us ask, "How many Units did we sell in each Region for every Ship Date?":

A pivot table usually consists of row, column and data (or fact) fields. In this case, the column is Ship Date, the row is Region and the datum we would like to see is (sum of) Units. These fields allow several kinds of aggregations, including: sum, average, standard deviation, count, etc. In this case, the total number of units shipped is displayed here using a sum aggregation.
Implementation
Using the example above, software will find all distinct values for Region. In this case, they are: North, South, East, West. Furthermore, it will find all distinct values for Ship Date. Based on the aggregation type, sum, it will summarize the fact and display them in a multidimensional chart. In the example above, the first datum is 66. This number was obtained by finding all records where both Region was East and Ship Date was 1/31/2005, and adding the Units of that collection of records (i.e., cells E2 to E7) together to get a final result.
Pivot tables are not created automatically. For example, in Microsoft Excel one must first select the entire data in the original table and then go to the Insert tab and select "Pivot Table" (or "Pivot Chart"). The user then has the option of either inserting the pivot table into an existing sheet or creating a new sheet to house the pivot table.[6] A pivot table field list is provided to the user which lists all the column headers present in the data. For instance, if a table represents sales data of a company, it might include Date of sale, Sales person, Item sold, Color of item, Units sold, Per unit price, and Total price. This makes the data more readily accessible.
| Date of sale | Sales person | Item sold | Color of item | Units sold | Per unit price | Total price |
|---|---|---|---|---|---|---|
| 10/01/13 | Jones | Notebook | Black | 8 | 25000 | 200000 |
| 10/02/13 | Prince | Laptop | Red | 4 | 35000 | 140000 |
| 10/03/13 | George | Mouse | Red | 6 | 850 | 5100 |
| 10/04/13 | Larry | Notebook | White | 10 | 27000 | 270000 |
| 10/05/13 | Jones | Mouse | Black | 4 | 700 | 3200 |
The fields that would be created will be visible on the right hand side of the worksheet. By default, the pivot table layout design will appear below this list.
Each of the fields from the list can be dragged on to this layout, which has four options :
- Report filter
- Column labels
- Row labels
- Summation values
Report filter
Report filter is used to apply a filter to an entire table. For example, if the "Color of Item" field is dragged to this area, then the table constructed will have a report filter inserted above the table. This report filter will have drop-down options (Black, Red, and White in the example above). When an option is chosen from this drop-down list ("Black" in this example), then the table that would be visible will contain only the data from those rows that have the "Color of Item = Black".
Column labels
Column labels are used to apply a filter to one or more columns that have to be shown in the pivot table. For instance if the "Sales person" field is dragged to this area, then the table constructed will have values from the column "Sales Person", i.e., one will have number of columns equal to the number of "Sales person". There will also be one added column of Total. In the example above, this instruction will create five columns in the table — one for each sales person, and Grand Total. There will be a filter above the data — column labels — from which one can select or deselect a particular sales person for the pivot table.
This table will not have any numerical values as no numerical field is selected but when it is selected, the values will automatically get updated in the column of "Grand total".
Row labels
Row labels are used to apply a filter to one or more rows that have to be shown in the pivot table. For instance if the "Sales person" field is dragged on this area then the other output table constructed will have values from the column "Sales person", i.e., one will have number of rows equal to the number of "Sales Person". There will also be one added row of "Grand Total". In the example above, this instruction will create five rows in the table — one for each sales person, and Grand Total. There will be a filter above the data — row labels — from which one can select or deselect a particular sales person for the Pivot table.
This table will not have any numerical values, as no numerical field is selected, but when it is selected, the values will automatically get updated in the Row of "Grand Total".
Summation values
This usually takes a field that has numerical values that can be used for different types of calculations. However, using text values would also not be wrong; instead of Sum it will give a count. So, in the example above, if the "Units sold" field is dragged to this area along with row label of "Sales person", then the instruction will add a new column, "Sum of units sold", which will have values against each sales person.
| Row labels | Sum of units sold |
|---|---|
| Jones | 12 |
| Prince | 4 |
| George | 6 |
| Larry | 10 |
| Grand total | 32 |
Application support
Pivot tables are an integral part of a spreadsheet application. In addition to Microsoft Excel, competing software programs such as Apache OpenOffice Calc provide similar functionality; the implementation in Apache OpenOffice and LibreOffice up to release 3.3 is called DataPilot. In version 3.4 of both LibreOffice and OpenOffice, DataPilot is renamed "Pivot Table".
Pivot functionality can also be found in other data visualization tools, including business intelligence packages.
Google Docs initially allowed the creation of basic pivot tables via the pivot table gadget from Panorama called Panorama Analytics, but as of 2011 this gadget provided limited functionality and was extremely slow with large data sets. In May 2011, Google announced the roll-out of a natively hosted pivot table feature in the Google spreadsheets editor.[7]
ZK, an Ajax framework, also allows the embedding of pivot tables in Web applications.
PostgreSQL, an object-relational database management system, allows the creation of pivot tables using the tablefunc module.[8]
MariaDB, a MySQL fork, allows pivot tables using the CONNECT storage engine.[9]
Online analytical processing
Excel pivot tables include the feature to directly query an OLAP server for retrieving data instead of getting the data from an Excel spreadsheet. On this configuration a pivot table is a simple client of an OLAP server. Excel's PivotTable not only allows for connecting to Microsoft's Analysis Service, but to any XML for Analysis (XMLA) OLAP standard-compliant server.
Other OLAP clients are JPivot, Dundas, IcCube (Client Library).
See also
- Aggregate function
- Business reporting
- Comparison of office suites
- Comparison of OLAP Servers
- Contingency table
- Data drilling
- Data mining
- Data warehouse
- Drill down
- Extract, transform, load
- Fold (higher-order function)
- Group by (SQL)
- OLAP cube
- Relational algebra
References
- ↑ "United States Trademark Serial Number 74472929". 1994-12-27. Retrieved 2013-02-17.
- ↑ Jelen, Bill; Alexander, Michael (2006). Pivot table data crunching. Indianapolis: Que. p. 274. ISBN 0-7897-3435-4.
- ↑ Gartung, Daniel L.; Edholm, Yorgen H.; Edholm, Kay-Martin; McNall, Kristen N.; Lew, Karl M., Patent #5915257, retrieved 2010-02-16
- ↑ Darlington, Keith (2012-08-06). VBA For Excel Made Simple. Routledge (published 2012). p. 19. ISBN 9781136349775. Retrieved 2014-09-10.
[...] Excel 5, released in early 1994, included the first version of VBA.
- ↑ Shah, Sharanam; Shah, Vaishali (2008). Oracle for Professionals - Covers Oracle 9i, 10g and 11g. Shroff Publishing Series. Navi Mumbai: Shroff Publishers (published July 2008). p. 549. ISBN 9788184045260. Retrieved 2014-09-10.
One of the most useful new features of the Oracle Database 11g from the SQL perspective is the introduction of Pivot and Unpivot operators.
- ↑ "Make an Excel Pivot Table in 2 Steps". The Desktop School. Retrieved 27 July 2015.
- ↑ Docs Blog: Summarize your data with pivot tables
- ↑ "PostgreSQL: Documentation: 9.2: tablefunc". postgresql.org.
- ↑ "CONNECT Table Types - PIVOT Table Type". mariadb.com.
Further reading
- A Complete Guide to PivotTables: A Visual Approach (ISBN 1-59059-432-0) (in-depth review at slashdot.org)
- Excel 2007 PivotTables and PivotCharts: Visual blueprint (ISBN 978-0-470-13231-9)
- Pivot Table Data Crunching (Business Solutions) (ISBN 0-7897-3435-4)
- Beginning Pivot Tables in Excel 2007 (ISBN 1-59059-890-3)