Pike County, Missouri
| Pike County, Missouri | |
|---|---|
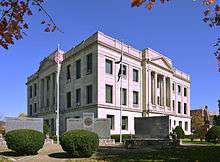 Pike County Courthouse in Bowling Green | |
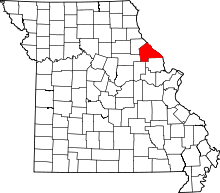 Location in the U.S. state of Missouri | |
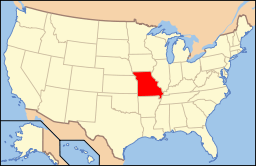 Missouri's location in the U.S. | |
| Founded | December 4, 1818 |
| Named for | Zebulon M. Pike |
| Seat | Bowling Green |
| Largest city | Bowling Green |
| Area | |
| • Total | 685 sq mi (1,774 km2) |
| • Land | 670 sq mi (1,735 km2) |
| • Water | 14 sq mi (36 km2), 2.1% |
| Population (est.) | |
| • (2015) | 18,348 |
| • Density | 28/sq mi (11/km²) |
| Congressional district | 6th |
| Time zone | Central: UTC-6/-5 |
| Website |
www |
Pike County is a county in the eastern part of the U.S. state of Missouri. As of the 2010 census, the population was 18,516.[1] Its county seat is Bowling Green.[2] The county was organized December 4, 1818, and named for explorer Zebulon M. Pike. The folksong Sweet Betsy from Pike is generally thought to refer to Pike County, Missouri.
Pike County is said to be the home of Momo (The Missouri Monster), with the first reported sightings in the 1970s dating back to various locations throughout the county.
Geography
According to the U.S. Census Bureau, the county has a total area of 685 square miles (1,770 km2), of which 670 square miles (1,700 km2) is land and 14 square miles (36 km2) (2.1%) is water.[3]
Adjacent counties
- Ralls County (northwest)
- Pike County, Illinois (northeast)
- Calhoun County, Illinois (east)
- Lincoln County (south)
- Montgomery County (southwest)
- Audrain County (west)
Pike County in Missouri and Illinois are two of twenty-two counties or parishes in the United States with the same name to border each other across state lines. The others are Union Parish, Louisiana and Union County, Arkansas, Big Horn County, Montana and Big Horn County, Wyoming, Sabine County, Texas and Sabine Parish, Louisiana, Bristol County, Massachusetts and Bristol County, Rhode Island, Kent County, Delaware and Kent County, Maryland, Escambia County, Alabama and Escambia County, Florida, Teton County, Idaho and Teton County, Wyoming, Park County, Montana and Park County, Wyoming, San Juan County, New Mexico and San Juan County, Utah, and Vermilion County, Illinois and Vermillion County, Indiana. respectively. (Note, despite the different spellings, the source of the name is the same for Vermilion County, Illinois and Vermillion County, Indiana—the Vermillion River which flows through both counties.)
Major highways
National protected area
Demographics
| Historical population | |||
|---|---|---|---|
| Census | Pop. | %± | |
| 1820 | 3,747 | — | |
| 1830 | 6,129 | 63.6% | |
| 1840 | 10,646 | 73.7% | |
| 1850 | 13,609 | 27.8% | |
| 1860 | 18,417 | 35.3% | |
| 1870 | 23,076 | 25.3% | |
| 1880 | 26,715 | 15.8% | |
| 1890 | 26,321 | −1.5% | |
| 1900 | 25,744 | −2.2% | |
| 1910 | 22,556 | −12.4% | |
| 1920 | 20,345 | −9.8% | |
| 1930 | 18,001 | −11.5% | |
| 1940 | 18,327 | 1.8% | |
| 1950 | 16,844 | −8.1% | |
| 1960 | 16,706 | −0.8% | |
| 1970 | 16,928 | 1.3% | |
| 1980 | 17,568 | 3.8% | |
| 1990 | 15,969 | −9.1% | |
| 2000 | 18,351 | 14.9% | |
| 2010 | 18,516 | 0.9% | |
| Est. 2015 | 18,348 | [4] | −0.9% |
| U.S. Decennial Census[5] 1790-1960[6] 1900-1990[7] 1990-2000[8] 2010-2015[1] | |||
As of the census[9] of 2010, there were 18,516 people, 6,451 households, and 4,476 families residing in the county. The population density was 27 people per square mile (11/km²). There were 7,493 housing units at an average density of 11 per square mile (4/km²). The racial makeup of the county was 88.44% White, 9.17% Black or African American, 0.24% Native American, 0.15% Asian, 0.04% Pacific Islander, 0.92% from other races, and 1.04% from two or more races. Approximately 1.61% of the population were Hispanic or Latino of any race. 24.6% were of American, 24.5% German, 8.9% English and 8.5% Irish ancestry.
There were 6,451 households out of which 31.30% had children under the age of 18 living with them, 55.70% were married couples living together, 9.60% had a female householder with no husband present, and 30.60% were non-families. 26.70% of all households were made up of individuals and 12.90% had someone living alone who was 65 years of age or older. The average household size was 2.50 and the average family size was 3.01.
In the county the population was spread out with 23.40% under the age of 18, 9.10% from 18 to 24, 29.80% from 25 to 44, 22.80% from 45 to 64, and 15.00% who were 65 years of age or older. The median age was 38 years. For every 100 females there were 119.20 males. For every 100 females age 18 and over, there were 123.80 males.
The median income for a household in the county was $32,373, and the median income for a family was $39,059. Males had a median income of $28,528 versus $19,426 for females. The per capita income for the county was $14,462. 15.50% of the population and 11.90% of families were below the poverty line. 20.20% of those under the age of 18 and 15.20% of those 65 and older were living below the poverty line.
Education
Public schools
- Boncl R-X School District – Louisiana
- Boncl Elementary School (PK-08)
- Bowling Green R-I School District – Bowling Green
- Bowling Green Elementary School (PK-05)
- Frankford Elementary School (K-05)
- Bowling Green Middle School (06-08)
- Bowling Green High School (09-12)
- Louisiana R-II School District – Louisiana
- Louisiana Elementary School (PK-05)
- Louisiana Middle School (06-08)
- Louisiana High School (09-12)
- Pike County R-III School District – Clarksville
- Clopton Elementary School (PK-06)
- Clopton High School (07-12)
Private schools
- Pike County Christian School – Curryville (K-11) – Baptist
- St. Clement School – Bowling Green (K-09) – Roman Catholic
Politics
Local
The Democratic Party predominantly controls politics at the local level in Pike County. Democrats hold all but one of the elected positions in the county.
| Pike County, Missouri | ||||
|---|---|---|---|---|
| Elected countywide officials | ||||
| Assessor | Donna Prior | Democratic | ||
| Circuit Clerk | Jerri Harrelson | Democratic | ||
| County Clerk | Melissa Kempke | Democratic | ||
| Collector | Marty J. Morrison | Democratic | ||
| Commissioner (Presiding) |
Dan Miller | Democratic | ||
| Commissioner (District 1) |
Curt Mitchell | Democratic | ||
| Commissioner (District 2) |
Jim Luebrecht | Democratic | ||
| Coroner | Jim Turner | Democratic | ||
| Prosecuting Attorney | Mark Fisher | Democratic | ||
| Public Administrator | Nina K. Long | Democratic | ||
| Recorder | Sherry McCarty | Democratic | ||
| Sheriff | Stephen Korte | Republican | ||
| Surveyor | Marty Wasson | Democratic | ||
| Treasurer | Patti Crane | Democratic | ||
State
| Year | Republican | Democratic | Third Parties |
|---|---|---|---|
| 2012 | 47.66% 3,482 | 50.03% 3,655 | 2.31% 169 |
| 2008 | 49.09% 3,850 | 49.19% 3,858 | 1.73% 135 |
| 2004 | 55.32% 4,416 | 43.02% 3,434 | 1.65% 132 |
| 2000 | 46.74% 3,427 | 50.70% 3,717 | 2.56% 188 |
| 1996 | 30.30% 2,027 | 67.65% 4,525 | 2.05% 137 |
Pike County is a part of Missouri’s 40th District in the Missouri House of Representatives and is represented by Jim Hansen (R-Frankford).
| Party | Candidate | Votes | % | ± | |
|---|---|---|---|---|---|
| Republican | Jim Hansen | 3,091 | 76.00 | +18.88 | |
| Democratic | Lowell Jackson | 976 | 24.00 | -18.88 | |
| Party | Candidate | Votes | % | ± | |
|---|---|---|---|---|---|
| Republican | Jim Hansen | 4,121 | 57.12 | ||
| Democratic | Paul Quinn | 3,094 | 42.88 | ||
Pike County is a part of Missouri’s 18th District in the Missouri Senate and is currently represented by Brian Munzlinger (R-Williamstown).
| Party | Candidate | Votes | % | ± | |
|---|---|---|---|---|---|
| Republican | Brian Munzlinger | 3,287 | 100.00 | ||
Federal
| Party | Candidate | Votes | % | ± | |
|---|---|---|---|---|---|
| Republican | Todd Akin | 3,381 | 46.34 | ||
| Democratic | Claire McCaskill | 3,449 | 47.27 | ||
| Libertarian | Jonathan Dine | 466 | 6.39 | ||
Pike County is included in Missouri’s 6th Congressional District and is currently represented by Sam Graves (R-Tarkio) in the U.S. House of Representatives.
| Party | Candidate | Votes | % | ± | |
|---|---|---|---|---|---|
| Republican | Sam Graves | 2,696 | 68.25 | +8.22 | |
| Democratic | Bill Hedge | 1,125 | 28.48 | -8.83 | |
| Libertarian | Russ Lee Monchil | 129 | 3.27 | +0.61 | |
| Party | Candidate | Votes | % | ± | |
|---|---|---|---|---|---|
| Republican | Sam Graves | 4,151 | 60.03 | ||
| Democratic | Kyle Yarber | 2,580 | 37.31 | ||
| Libertarian | Russ Lee Monchil | 184 | 2.66 | ||
Political culture
| Year | Republican | Democratic | Third Parties |
|---|---|---|---|
| 2012 | 62.52% 4,577 | 35.27% 2,582 | 2.21% 162 |
| 2008 | 53.97% 4,268 | 44.09% 3,487 | 1.94% 153 |
| 2004 | 53.66% 4,314 | 45.65% 3,670 | 0.70% 56 |
| 2000 | 49.63% 3,648 | 48.39% 3,557 | 1.98% 146 |
| 1996 | 33.00% 2,209 | 52.22% 3,495 | 14.78% 989 |
Missouri Presidential Preference Primary (2008)
- Former U.S. Senator Hillary Clinton (D-New York) received more votes, a total of 1,447, than any candidate from either party in Pike County during the 2008 presidential primary. She also received more votes individually than the entire number of votes cast in the Republican Primary in Pike County.
| Pike County, Missouri | ||
|---|---|---|
| 2008 Republican primary in Missouri | ||
| John McCain | 463 (32.58%) | |
| Mike Huckabee | 461 (32.44%) | |
| Mitt Romney | 388 (27.30%) | |
| Ron Paul | 84 (5.91%) | |
| Pike County, Missouri | ||
|---|---|---|
| 2008 Democratic primary in Missouri | ||
| Hillary Clinton | 1,447 (62.67%) | |
| Barack Obama | 767 (33.22%) | |
| John Edwards (withdrawn) | 82 (3.55%) | |
Communities
See also
References
- 1 2 "State & County QuickFacts". United States Census Bureau. Retrieved September 12, 2013.
- ↑ "Find a County". National Association of Counties. Retrieved 2011-06-07.
- ↑ "2010 Census Gazetteer Files". United States Census Bureau. August 22, 2012. Retrieved November 18, 2014.
- ↑ "County Totals Dataset: Population, Population Change and Estimated Components of Population Change: April 1, 2010 to July 1, 2015". Retrieved July 2, 2016.
- ↑ "U.S. Decennial Census". United States Census Bureau. Retrieved November 18, 2014.
- ↑ "Historical Census Browser". University of Virginia Library. Retrieved November 18, 2014.
- ↑ "Population of Counties by Decennial Census: 1900 to 1990". United States Census Bureau. Retrieved November 18, 2014.
- ↑ "Census 2000 PHC-T-4. Ranking Tables for Counties: 1990 and 2000" (PDF). United States Census Bureau. Retrieved November 18, 2014.
- ↑ "American FactFinder". United States Census Bureau. Retrieved 2008-01-31.
External links
- Digitized 1930 Plat Book of Pike County from University of Missouri Division of Special Collections, Archives, and Rare Books
- [www.pikecountymo.org/ Pike County Development Authority]
 |
Ralls County | Pike County, Illinois | | |
| Audrain County | |
Calhoun County, Illinois | ||
| ||||
| | ||||
| Montgomery County | Lincoln County |
Municipalities and communities of Pike County, Missouri, United States | ||
|---|---|---|
| Cities | | |
| Villages | ||
| Townships |
| |
| CDPs | ||
| Unincorporated communities |
| |
| Ghost towns |
| |
Coordinates: 39°20′N 91°10′W / 39.34°N 91.17°W