Petroleum in the United States


Petroleum in the United States has been a major industry since shortly after the oil discovery in the Oil Creek area of Titusville, Pennsylvania in 1859. The petroleum industry includes exploration for, production, processing (refining), transportation, and marketing of natural gas and petroleum products.[1] As of 2008, the U.S. was the world's third-largest oil producer (after Saudi Arabia and Russia), producing 8.5 million barrels of oil and natural gas liquids per day.[2] The leading oil-producing area in the United States in 2014 was Texas (3.17 million barrels (504,000 m3) per day), followed by the federal zone of the Gulf of Mexico (1.40 million barrels (223,000 m3) per day, followed by North Dakota (1.09 million barrels (173,000 m3) per day) and California (0.50 million barrels (79,000 m3) per day).[3]
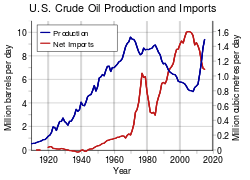
In 2015, US production of crude oil rose to 9.48 million barrels per day, the highest annual rate since 1972, and an increase of 90% from the 2008 production of 5.00 million barrels per day. On a monthly basis, however, US production peaked in April 2015 at 9.63 million barrels per day, then declined due to lower oil prices to 8.74 million barrels per day in August 2016.[4] US Natural gas production achieved new record highs for each year from 2011 through 2014.
Marketed natural gas production in 2014 was 74.7 billion cubic feet per day, a 44% increase over the rate of 51.9 billion cubic feet per day in 2005. Over the same time period, production of natural gas liquids increased 70%, from 1.74 million barrels per day in 2005 to 2.96 million barrels per day in 2014. In April 2015, natural gas was produced at the rate of 79.4 billion cubic feet per day.[5]
In 2014, petroleum and natural gas were the two largest sources of energy in the U.S., together providing 63 percent of the energy consumed (oil provided 35 percent and gas 28 percent).[6] In 2008 the United States consumed 19.5 million barrels (3,100,000 m3) per day of petroleum products, of which 46 percent was gasoline, 20 percent diesel fuel and heating oil, and 10 percent liquefied petroleum gas.[7] In 2015, the U.S. imported 24% of the petroleum it used, the lowest since 1970.[8] The largest sources of U.S. imported oil were: Canada (40%), Saudi Arabia (11%), Venezuela (9%), Mexico (8%), and Colombia (4%).[9]
According to the American Petroleum Institute, the oil and natural gas industry supports nine million U.S. jobs and makes up seven percent of the nation's gross domestic product.[10]
Industry structure
The U.S.A oil industry is made up of thousands of companies, engaged in exploration and production, transportation, refining, distribution, and marketing of oil. The industry is often informally divided into "upstream" (exploration and production), "midstream" (transportation and refining), and "downstream" (distribution and marketing). The industry sector involved in oil exploration and production is for all practical purposes identical with the sector exploring and producing natural gas, but oil and natural gas have different midstream and downstream sectors (see: Natural gas in the United States).
Majors
The term major oil company has no formal definition, but usually refers to a large vertically integrated company, with operations in all or most of the industry phases, from exploration to marketing. Many majors have international operations.
The largest of the majors are sometimes called supermajors. This term is often applied to BP, Shell, Exxon Mobil, Chevron, and Total, all of which operate in the US.
Independents
An independent is a company which has all or almost all of its operations in a limited segment of the industry, such as exploration and production, refining, or marketing. Although most independents are small compared to the majors, there are some very large companies which are not vertically integrated, and so are classed as independents.
Service companies
Service companies contract to oil companies to perform specialized services. Examples are companies that do well logging (Schlumberger), seismic surveys (WesternGeco, CGG (company)), drilling (Nabors Industries, Helmerich & Payne), or well completion (Baker Hughes, Halliburton).
Top oil producers in the United States, 2009
| Rank | Company | Million Bbl/Year |
|---|---|---|
| 1 | BP | 237.0 |
| 2 | Chevron | 177.0 |
| 3 | ConocoPhillips | 153.0 |
| 4 | Exxon Mobil | 112.0 |
| 5 | Occidental Petroleum | 99.0 |
| 6 | Shell Oil | 71.0 |
| 7 | Anadarko Petroleum | 63.0 |
| 8 | Apache Corporation | 34.8 |
| 9 | XTO Energy | 31.7 |
| 10 | Amerada Hess | 26.0 |
| Annual owned production, 2009. Source:[11] | ||
In 2009, the production owned by the top ten companies was 52% of total US oil production.[12]
Exploration

Each year, tens of thousands of wells are drilled in search of oil and gas in the U.S. In 2009, 36,243 wells were drilled.
Top Oil Fields in the U.S.
Top producing oil fields in the United States, 2013
| Rank | Field | State | Discovery Year | Million Bbl/Year |
|---|---|---|---|---|
| 1 | Eagle Ford Formation | Texas | 1962 | 308.3 |
| 2 | Bakken formation | North Dakota and Montana | 1953 | 123.8 |
| 3 | Spraberry Trend | Texas | 1949 | 99.8 |
| 4 | Prudhoe Bay Oil Field | Alaska | 1967 | 79.1 |
| 5 | Wattenberg Gas Field | Colorado | 1970 | 47.3 |
| 6 | Shenzi | Federal Gulf of Mexico | 2002 | 35.3 |
| 7 | Kuparuk River oil field | Alaska | 1969 | 29.5 |
| 8 | Midway-Sunset Oil Field | California | 1901 | 28.8 |
| 9 | Atlantis Oil Field | Federal Gulf of Mexico | 1998 | 27.3 |
| 10 | Sugarkane | Texas | 2009 | 25.8 |
| Annual production 2013. Source:[13] | ||||
Produced water
Oil and gas wells commonly produce water along with the oil and gas. Known as produced water, the water is usually highly saline, and must be disposed of by injecting it into EPA-permitted Class II water disposal wells.
Some produced water contains sufficient iodine to be recovered as a byproduct.
Crude oil transportation
The product extracted at the wellhead, usually a mixture of oil/condensate, gas, and water, goes through equipment on the lease to separate the three components. The oil and produced water are in most cases stored in separate tanks at the site, and periodically removed by truck. Over the decade 2005-2014, the volume of oil carried to the refinery by tanker ship has decreased. The oil volumes delivered to US refineries by all other modes has increased.
Pipeline
Most crude oil shipped long distances in the US goes by oil pipeline. In 2014, 58 percent of the petroleum arriving at refineries came by pipeline, up from 48 percent in 2005. In 2014, the United States had 161 thousand miles of interstate oil pipelines, an increase of 29 thousand miles since 2005. The interstate pipelines are connected to 4.2 million miles of trunk oil pipelines. The top US oil pipeline companies in 2014 were, in order of decreasing interstate pipeline mileage: Magellan Pipeline Company, Mid-America Pipeline Company, and Plains All American Pipeline.[14]
Water
Petroleum can be transported cheaply for long distances by oceangoing oil tankers. Tankers supplied 31 percent of the oil arriving at US refineries in 2014, down from 48 percent in 2005; the decline reflects decreased oil imports since 2005.
For shorter-distance water transport, oil is shipped by barge, which accounted for 5.7 percent of oil arriving at refineries in 2014, up from 2.9 percent in 2005.
Truck
Most oil is initially carried off the site by tanker truck. The truck may take the oil directly to a nearby refinery. In 2014, 2.6 percent of oil arrived at refineries by truck, up from 2.6 percent in 2005. If the refinery is not close, the tanker truck will take the crude oil to a pipeline, barge, or railroad for long-distance transport.
Railroad

Before the common availability of long-distance pipelines, most crude oil was shipped by rail. It is for this historical reason that in Texas, oil and gas production came to be regulated by the Texas Railroad Commission. Rail transport of crude oil has made a resurgence since 2005, largely due to the lack of pipeline capacity to transport the increased oil volumes from North Dakota. In 2014, 2.7 percent of crude oil arriving at refineries came by rail, up from 0.1 percent in 2005.
Since 2012, oil shipped by rail from the Bakken fields in North Dakota has progressively replaced overseas (non-Canadian) imported oil used by East Coast US refineries. In February 2015, railroads supplied 52 percent of all crude oil delivered to US refineries on the East Coast.[15]
Refining

The United States petroleum refining industry, the world’s largest, is most heavily concentrated along the Gulf Coast of Texas and Louisiana. In 2012, US refiners produced 18.5 million barrels per day of refined petroleum products.[16] Of this amount, 15 percent was exported.[17] As of 2012 the US was the world’s second largest net exporter of refined petroleum products.[18]
Petroleum product distribution and marketing
Refined petroleum products destined for retail consumption is transferred to bulk terminals by pipeline, barge, or rail. From the bulk terminal, the product is usually trucked to the retail outlets.
As of February 2014, there were 153,000 service stations selling motor fuel in the US, including garages, truck stops, convenience stores, and marinas. Although many stations carry the brands of major integrated oil companies, only 2% of US stations are owned by major oil companies; most stations labeled with major brands are operated under franchise agreements. A total of 58% of the service stations are single-store operations run by an individual or family.[19]
History

Although some oil was produced commercially before 1859 as a byproduct from salt brine wells, the American oil industry started on a major scale with the discovery of oil at the Drake Well in western Pennsylvania in 1859.
U.S. crude oil production peaked in 1970 at 9.64 million barrels (1,533,000 m3) per day. 2013 production was 7.44 million barrels (1,183,000 m3) per day of crude oil (not including natural gas liquids).[20]
- Pennsylvanian oil rush
- Office of Naval Petroleum and Oil Shale Reserves
- Petroleum Administration for Defense District
- Texas wildcatters
Statistics
The Energy Information Administration of the United States Department of Energy publishes extensive statistics on the production, importation, and uses of petroleum in the United States.[21]
In 1913 the United States was extracting 65 percent of the world's petroleum.
In 1989 the U.S. contained 5 percent of the world's oil reserves.
Politics
In 2007, state severance taxes amounted to $10.7 billion, mostly from oil, gas, and coal. States also received 50 percent of federal onshore oil and gas lease revenues within their borders, and 27 percent of federal offshore oil and gas revenues adjacent to their shorelines; the state share of federal revenues totalled $2.0 billion in 2007.[22]
Environmental issues
Organizations
See also
- Energy conservation in the United States
- Energy in the United States
- History of the petroleum industry in the United States
- Natural gas in the United States
- Offshore oil and gas in the United States
- The Petroleum Dictionary (book)
- Shale gas in the United States
By State:
References
- ↑ American Petroleum Institute, , accessed 20 February 2010.
- ↑ US Energy Information Administration
- ↑ US Energy Information Administration
- ↑ US Energy Information Administration, Crude oil production in 2015 was the highest since 1972, but has since declined, 7 Nov. 2016.
- ↑ US EIA, Natural gas wellhead value and marketed production, accessed 30 July 2015.
- ↑ US Energy Information Administration,Overview, accessed 19 February 2010.
- ↑ US Energy Information Administration,Product supplied, accessed 19 February 2010.
- ↑ http://www.eia.gov/tools/faqs/faq.cfm?id=32&t=6
- ↑ http://www.eia.gov/tools/faqs/faq.cfm?id=727&t=6
- ↑ American Petroleum Institute, Energy works, accessed 30 July 2015.
- ↑ US Energy Information Administration, Top 100 Operators, 2009, accessed 2 August 2015.
- ↑ US Energy Information Administration, Top 100 Operators, 2009, accessed 2 August 2015.
- ↑ US Energy Information Administration, Top 100 U.S. oil and gas fields, Mar. 2015
- ↑ Christopher E. Smith, "Oil pipelines lead way in strong 2014," Oil & Gas Jolurnal, 7 September 2015, p.110-128.
- ↑ Crude by rail accounts for more than half of East Coast refinery supply in February, Today in Energy, US EIA, 5 May 2015.
- ↑ OPEC, “World production of petroleum products by country.” Table 3.14, accessed 7 Mar. 2014.
- ↑ OPEC, “World exports of petroleum products by country,” Table 3.20, accessed 7 Mar 2014.
- ↑ OPEC, “World imports of petroleum products by country, (Figure from Table 3.20, minus figure from Table 3.24) accessed 7 Mar. 2014.
- ↑ American Petroleum Institute, Service station FAQs, accessed 2 August 2015.
- ↑ US crude oil production by year, 1861 to 2013
- ↑ "Petroleum and Other Liquids". Energy Information Administration, United States Department of Energy. Retrieved 2011-09-08.
- ↑ Judy Zelio and Lisa Houlihan, State Energy Revenues Update, National Conference of State Legislatures, June 2008.
External links
| Wikimedia Commons has media related to Petroleum in the United States. |