Pemiscot County, Missouri
| Pemiscot County, Missouri | |
|---|---|
 Location in the U.S. state of Missouri | |
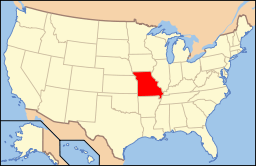 Missouri's location in the U.S. | |
| Founded | February 19, 1851 |
| Named for | A Native American word meaning "liquid mud" |
| Seat | Caruthersville |
| Largest city | Caruthersville |
| Area | |
| • Total | 513 sq mi (1,329 km2) |
| • Land | 493 sq mi (1,277 km2) |
| • Water | 21 sq mi (54 km2), 4.1% |
| Population (est.) | |
| • (2015) | 17,482 |
| • Density | 37/sq mi (14/km²) |
| Congressional district | 8th |
| Time zone | Central: UTC-6/-5 |
Pemiscot County is a county located in the southeastern corner in the Bootheel in the U.S. state of Missouri. As of the 2010 census, the population was 18,296.[1] The largest city and county seat is Caruthersville.[2] The county was officially organized on February 19, 1851,[3] and is named for the local bayou, taken from the Fox dialect word, pem-eskaw, meaning "liquid mud".[4] Bordering the Mississippi River and floodplain, the county has been devoted to agricultural development and commodity crops. With mechanization of agriculture, its population has declined since a peak in 1940.
Murphy Mound Archeological Site has one of the largest platform mounds in Missouri; it is a major earthwork of the Late Mississippian culture, which had settlement sites throughout the Mississippi Valley and tributaries. The site is privately owned and is not open to the public. The site may have been occupied from as early as 1200 CE and continuing to about 1541.[5]
Geography
According to the U.S. Census Bureau, the county has a total area of 513 square miles (1,330 km2), of which 493 square miles (1,280 km2) is land and 21 square miles (54 km2) (4.1%) is water.[6] Fishing is a popular activity among residents in the area.
Adjacent counties
- New Madrid County (north)
- Lake County, Tennessee (northeast across the Mississippi River)
- Dyer County, Tennessee (southeast across the river)
- Mississippi County, Arkansas (south)
- Dunklin County (west)
Major highways
Demographics
| Historical population | |||
|---|---|---|---|
| Census | Pop. | %± | |
| 1860 | 2,962 | — | |
| 1870 | 2,059 | −30.5% | |
| 1880 | 4,299 | 108.8% | |
| 1890 | 5,975 | 39.0% | |
| 1900 | 12,115 | 102.8% | |
| 1910 | 19,559 | 61.4% | |
| 1920 | 26,634 | 36.2% | |
| 1930 | 37,284 | 40.0% | |
| 1940 | 46,857 | 25.7% | |
| 1950 | 45,624 | −2.6% | |
| 1960 | 38,095 | −16.5% | |
| 1970 | 26,373 | −30.8% | |
| 1980 | 24,987 | −5.3% | |
| 1990 | 21,921 | −12.3% | |
| 2000 | 20,047 | −8.5% | |
| 2010 | 18,296 | −8.7% | |
| Est. 2015 | 17,482 | [7] | −4.4% |
| U.S. Decennial Census[8] 1790-1960[9] 1900-1990[10] 1990-2000[11] 2010-2015[1] | |||
As of the census[12] of 2000, there were 20,047 people, 7,855 households, and 5,317 families residing in the county. The population density was 41 people per square mile (16/km²). There were 8,793 housing units at an average density of 18 per square mile (7/km²). The racial makeup of the county was 71.76% White, 26.23% Black or African American, 0.25% Native American, 0.27% Asian, 0.01% Pacific Islander, 0.62% from other races, and 0.85% from two or more races. Approximately 1.57% of the population were Hispanic or Latino of any race. Among the major first ancestries reported in Pemiscot County were 31.9% American, 7.8% Irish, 5.6% English, and 5.5% German ancestry.
There were 7,855 households out of which 33.60% had children under the age of 18 living with them, 45.00% were married couples living together, 18.50% had a female householder with no husband present, and 32.30% were non-families. 28.80% of all households were made up of individuals and 14.30% had someone living alone who was 65 years of age or older. The average household size was 2.52 and the average family size was 3.10.
In the county the population was spread out with 30.00% under the age of 18, 9.10% from 18 to 24, 25.00% from 25 to 44, 21.10% from 45 to 64, and 14.90% who were 65 years of age or older. The median age was 34 years. For every 100 females there were 88.50 males. For every 100 females age 18 and over, there were 83.30 males.
The median income for a household in the county was $26,992, and the median income for a family was $33,945. Males had a median income of $27,476 versus $17,358 for females. The per capita income for the county was $15,599. About 24.80% of families and 30.40% of the population were below the poverty line, including 43.20% of those under age 18 and 23.20% of those age 65 or over.
Religion
According to the Association of Religion Data Archives County Membership Report (2000), Pemiscot County is a part of the Bible Belt with evangelical Protestantism being the majority religion. The most predominant denominations among residents in Pemiscot County who adhere to a religion are Southern Baptists (69.98%), Methodists (7.56%), and Churches of Christ (4.76%).
Politics
Local
The Democratic Party completely controls politics at the local level in Pemiscot County. Democrats hold every elected position in the county.
| Pemiscot County, Missouri | ||||
|---|---|---|---|---|
| Elected countywide officials | ||||
| Assessor | Patsy Hinklin | Democratic | ||
| Circuit Clerk | Kelly Cagle Maners | Democratic | ||
| County Clerk | Pam Treece | Democratic | ||
| Collector | Rhonda Parkinson Price | Democratic | ||
| Commissioner (Presiding) |
Mark Cartee | Democratic | ||
| Commissioner (District 1) |
Steve Watkins | Democratic | ||
| Commissioner (District 2) |
Ben Baker | Democratic | ||
| Coroner | James Brimhall | Democratic | ||
| Emergency Management Director | Jim Atchison | Democratic | ||
| Prosecuting Attorney | Jereme Lytle | Democratic | ||
| Public Administrator | Carol DeRousse Miller | Democratic | ||
| Recorder | Pam Strawbridge | Democratic | ||
| Sheriff | Tommy Greenwell | Democratic | ||
| Surveyor | Darrall Hirtz | Democratic | ||
| Treasurer | Frankie R. Stewart | Democratic | ||
State
All of Pemiscot County is a part of Missouri’s 162nd District in the Missouri House of Representatives and is currently represented by Terry Swinger (D-Caruthersville).
| Party | Candidate | Votes | % | ± | |
|---|---|---|---|---|---|
| Democratic | Terry Swinger* | 2,851 | 100.00 | 0 | |
All of Pemiscot County is a part of Missouri's 25th District in the Missouri Senate and is currently represented by State Senator Rob Mayer (R-Dexter). In 2008, Mayer defeated Democrat M. Shane Stoelting 65.32-34.68 percent in the district. The 25th Senatorial District consists of Butler, Dunklin, New Madrid, Pemiscot, Ripley, Stoddard, and Wayne counties.
| Party | Candidate | Votes | % | ± | |
|---|---|---|---|---|---|
| Republican | Rob Mayer | 3,586 | 55.61 | ||
| Democratic | M. Shane Stoelting | 2,862 | 44.39 | ||
Federal
Pemiscot County is included in Missouri’s 8th Congressional District and is currently represented by Jason T. Smith (R-Salem) in the U.S. House of Representatives. Smith won a special election on Tuesday, June 4, 2013, to finish out the remaining term of U.S. Representative Jo Ann Emerson (R-Cape Girardeau). Emerson announced her resignation a month after being reelected with over 70 percent of the vote in the district. She resigned to become CEO of the National Rural Electric Cooperative.
| Party | Candidate | Votes | % | ± | |
|---|---|---|---|---|---|
| Republican | Jo Ann Emerson | 3,782 | 62.57 | -0.25 | |
| Democratic | Jack Rushin | 2,184 | 36.14 | +0.95 | |
| Libertarian | Rick Vandeven | 78 | 1.29 | +0.51 | |
| Party | Candidate | Votes | % | ± | |
|---|---|---|---|---|---|
| Republican | Jason T. Smith | 506 | 58.36 | ||
| Democratic | Steve Hodges | 338 | 38.99 | ||
| Constitution | Doug Enyart | 13 | 1.50 | ||
| Libertarian | Bill Slantz | 10 | 1.15 | ||
| Year | Republican | Democratic | Third Parties |
|---|---|---|---|
| 2012 | 38.64% 2,338 | 58.83% 3,559 | 2.53% 153 |
| 2008 | 37.26% 2,491 | 60.50% 4,045 | 2.24% 150 |
| 2004 | 44.93% 2,965 | 53.46% 3,528 | 1.61% 106 |
| 2000 | 34.61% 2,053 | 63.80% 3,784 | 1.59% 94 |
| 1996 | 26.24% 1,461 | 72.31% 4,026 | 1.45% 81 |
| 1992 | 34.78% 2,275 | 65.22% 4,267 | 0.00% 0 |
| 1988 | 48.65% 3,033 | 50.87% 3,171 | 0.48% 30 |
| 1984 | 46.17% 3,112 | 53.83% 3,629 | 0.00% 0 |
| 1980 | 42.25% 3,067 | 57.60% 4,181 | 0.15% 11 |
| 1976 | 40.99% 2,743 | 58.86% 3,939 | 0.15% 10 |
Political culture
| Year | Republican | Democratic | Third Parties |
|---|---|---|---|
| 2012 | 56.80% 3,598 | 42.16% 2,671 | 1.05% 66 |
| 2008 | 56.11% 3,954 | 42.98% 3,029 | 0.91% 64 |
| 2004 | 49.93% 3,398 | 49.68% 3,381 | 0.39% 27 |
| 2000 | 45.38% 2,750 | 53.55% 3,245 | 1.07% 65 |
| 1996 | 32.06% 1,820 | 59.38% 3,371 | 8.56% 486 |
| 1992 | 31.93% 2,161 | 57.98% 3,924 | 9.90% 670 |
| 1988 | 48.18% 3,066 | 51.67% 3,288 | 0.16% 10 |
| 1984 | 53.13% 3,733 | 46.87% 3,293 | 0.00% 0 |
| 1980 | 45.51% 3,519 | 53.54% 4,140 | 0.94% 73 |
| 1976 | 35.12% 2,541 | 64.69% 4,681 | 0.19% 14 |
At the presidential level, Pemiscot County is a fairly independent-leaning or battleground county although, like many counties in the impoverished Bootheel with a large African American population, it has a significant tendency to vote Democratic. While George W. Bush carried Pemiscot County by just 17 votes in 2004, Al Gore won the county in 2000, although both times the margin of victory was significantly closer than in many other rural areas. Bill Clinton also carried Pemiscot County in both 1992 and 1996 by double-digit margins. As was the case in many of the other rural counties in Missouri, Pemiscot County favored John McCain over Barack Obama in 2008, although the margin of victory was smaller than in many of the other rural areas.
In 1968, Pemiscot County was the only county in Missouri to be won by George Wallace, the former Governor of Alabama who ran as a pro-segregationist presidential candidate. In 2008, Pemiscot County swung the most Republican of all counties in the state, despite the state swinging Democratic as a whole.
As in most rural areas throughout Missouri, voters in Pemiscot County generally adhere to socially and culturally conservative principles, but are more moderate or populist on economic issues, typical of the Dixiecrat philosophy. In 2004, Missourians voted on a constitutional amendment to define marriage as the union between a man and a woman—it passed Pemiscot County with 84.73 percent of the vote. The initiative passed the state with 71 percent of support from voters, as Missouri became the first state to ban same-sex marriage. In 2006, Missourians voted on a constitutional amendment to fund and legalize embryonic stem cell research in the state—it failed in Pemiscot County, with 52.41 percent voting against the measure. The initiative narrowly passed the state with 51 percent of support from voters, as Missouri became one of the first states in the nation to approve embryonic stem cell research. Despite Pemiscot County’s longstanding tradition of supporting socially conservative platforms, voters in the county have a penchant for advancing populist causes, such as increasing the minimum wage. In 2006, Missourians voted on a proposition (Proposition B) to increase the minimum wage in the state to $6.50 an hour—it passed Pemiscot County with 78.01 percent of the vote. The proposition strongly passed every single county in Missouri with 78.99 percent voting in favor as the minimum wage was increased to $6.50 an hour in the state. During the same election, voters in five other states strongly approved increases in the minimum wage.
Missouri Presidential Preference Primary (2008)
In the 2008 Missouri Presidential Preference Primary, voters in Pemiscot County from both political parties supported candidates who finished in second place in the state at large and nationally.
- Former U.S. Senator Hillary Clinton (D-New York) received more votes, a total of 1,270, than any candidate from either party in Pemiscot County during the 2008 Missouri Presidential Preference Primary. She also received more votes than the total number of votes cast in the entire Republican Primary in Pemiscot County.
| Pemiscot County, Missouri | ||
|---|---|---|
| 2008 Republican primary in Missouri | ||
| John McCain | 233 (23.75%) | |
| Mike Huckabee | 565 (57.59%) | |
| Mitt Romney | 149 (15.19%) | |
| Ron Paul | 20 (2.04%) | |
| Pemiscot County, Missouri | ||
|---|---|---|
| 2008 Democratic primary in Missouri | ||
| Hillary Clinton | 1,270 (70.83%) | |
| Barack Obama | 466 (25.99%) | |
| John Edwards (withdrawn) | 34 (1.90%) | |
| Uncommitted | 19 (1.06%) | |
Education
Of adults 25 years of age and older in Pemiscot County, 58.2% possess a high school diploma or higher, while 8.4% hold a bachelor's degree or higher as their greatest educational attainment.
Public schools
- Caruthersville School District 18 - Caruthersville
- Caruthersville Elementary School (PK-05)
- Caruthersville Middle School (06-08)
- Caruthersville High School (09-12)
- Cooter R-IV School District - Cooter
- Cooter Elementary School (K-06)
- Cooter High School (07-12)
- Delta C-7 School District - Deering
- Delta Elementary School (K-06)
- Delta High School (07-12)
- Hayti R-II School District - Hayti
- Mathis Elementary School (PK-03)
- Wallace Elementary School (04-06)
- Hayti High School (07-12)
- North Pemiscot County R-I School District - Wardell
- Ross Elementary School - Portageville - (K-05)
- North Pemiscot County High School - (06-12)
- South Pemiscot County R-V School District - Steele
- South Pemiscot County Elementary School (K-06)
- South Pemiscot County High School (07-12)
Alternative/vocational schools
- Diagnostic Center - Hayti - (K-12) - Special education
- External Locations - Hayti - (K-12) - Special education
- Oak View Learning Center - Hayti - (K-12) - Special education
- Pemiscot County Vocational School - Hayti - (11-12) - Vocational/technical
Communities
See also
References
- 1 2 "State & County QuickFacts". United States Census Bureau. Retrieved September 12, 2013.
- ↑ "Find a County". National Association of Counties. Retrieved 2011-06-07.
- ↑ Douglass, Robert Sidney. History of Southeast Missouri. I. Chicago and New York: Lewis Publishing. p. 313.
- ↑ Eaton, David Wolfe (1917). How Missouri Counties, Towns and Streams Were Named. The State Historical Society of Missouri. p. 338.
- ↑ O'Brien, Michael J. and Robert C. Dunnell. (1998) 1998 Changing Perspectives on the Archaeology of the Central Mississippi Valley. University of Missouri Press, Columbia
- ↑ "2010 Census Gazetteer Files". United States Census Bureau. August 22, 2012. Retrieved November 18, 2014.
- ↑ "County Totals Dataset: Population, Population Change and Estimated Components of Population Change: April 1, 2010 to July 1, 2015". Retrieved July 2, 2016.
- ↑ "U.S. Decennial Census". United States Census Bureau. Retrieved November 18, 2014.
- ↑ "Historical Census Browser". University of Virginia Library. Retrieved November 18, 2014.
- ↑ "Population of Counties by Decennial Census: 1900 to 1990". United States Census Bureau. Retrieved November 18, 2014.
- ↑ "Census 2000 PHC-T-4. Ranking Tables for Counties: 1990 and 2000" (PDF). United States Census Bureau. Retrieved November 18, 2014.
- ↑ "American FactFinder". United States Census Bureau. Retrieved 2008-01-31.
External links
- Digitized 1930 Plat Book of Pemiscot County from University of Missouri Division of Special Collections, Archives, and Rare Books
 |
New Madrid County | Lake County, Tennessee | | |
| Dunklin County | |
|||
| ||||
| | ||||
| Mississippi County, Arkansas | Dyer County, Tennessee |
Municipalities and communities of Pemiscot County, Missouri, United States | ||
|---|---|---|
| Cities | | |
| Villages | ||
| Townships | ||
| CDP | ||
| Other unincorporated communities | ||
| Ghost towns | ||
| Footnotes | ‡This populated place also has portions in an adjacent county or counties | |
Coordinates: 36°13′N 89°47′W / 36.21°N 89.78°W