Peak gas
According to M. King Hubbert's Hubbert peak theory, Peak gas is the point in time at which the maximum global natural gas (fossil gas) production rate will be reached, after which the rate of production will enter its terminal decline.[1] Natural gas is a fossil fuel formed from plant matter over the course of millions of years. It is a finite resource and thus considered to be a non-renewable energy source.
The concept of peak gas follows from Hubbert peak theory, which is most commonly associated with peak oil. Hubbert saw gas, coal and oil as natural resources, each of which would peak in production and eventually run out for a region, a country, or the world. Since Hubbert's initial predictions in 1956, "the proper application of ever more powerful statistical techniques has reduced much of the uncertainty about the supply of oil and natural gas". One view in 1997 was that Hubbert's use of an exponential decline model was statistically adequate in explaining real world data.[2] However, longer-term experience has shown the predictions to be incorrect.
Gas demand

The world gets almost one quarter of its energy from natural gas. The consumption of natural gas has nearly doubled in the last 30 years. The most important energy agencies in the world are forecasting increases in natural gas demand in the next 20 years.[3] The largest increments in future gas demand are expected to come from developing countries.
Gas supply

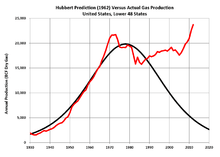
Hubbert’s original peak theory predicts that natural gas will experience three equally spaced events: first, the rate of discoveries will peak, then X years later reserves will peak, and finally X years after peak reserves, gas production will peak at the same rate as the previous peak of discoveries. For the United States, for instance, Hubbert projected that the natural gas discovery rate was peaking in 1962 at about 20 trillion cubic feet (TCF) per year. From his curves, he predicted that proved reserves would peak eight years later, in 1970, and that production would peak after another eight years, in 1978, at 20 trillion cubic feet per year, about equal to the rate of peak discoveries.[4]
Of the three peaks, Hubbert found the peak in discoveries most difficult to define, because of large year-to-year scatter, and the phenomenon of “reserve growth.” Initial estimates of a discovery are usually much lower than ultimate recovery, especially if the conservative estimate of proven reserves is the measure. As the discovery is drilled out, estimates rise. Sometimes estimates of recoverable oil and gas in a discovery continue to rise for many years after the discovery. To find the peak in discoveries, Hubbert backdated reserve growth to the date of field discovery.[5]
New gas discoveries

According to David L. Goodstein, the worldwide rate of discovery peaked around 1960 and has been declining ever since.[6] Exxon Mobil Vice President, Harry J. Longwell places the peak of global gas discovery around 1970 and has observed a sharp decline in natural gas discovery rates since then.[7] The rate of discovery has fallen below the rate of consumption in 1980.[6] The gap has been widening ever since. Declining gas discovery rates foreshadow future production decline rates because gas production can only follow gas discoveries.
Despite the reported fall in new-field discoveries, world proved reserves of natural gas have continued to grow, from 19 billion cubic meters (bcm) in 1960, 45 bcm in 1970 and 84 bcm in 1980, to a record high 200 bcm in 2012.[8] A researcher for the US Energy Information Administration pointed out that after the first wave of discoveries in an area, most oil and natural gas reserve growth comes not from discoveries of new fields, but from extensions and additional gas found within existing fields.[9]
Dr. Anthony Hayward CCMI, chief executive of BP stated in October 2009 that proven natural gas reserves around the world have risen to 1.2 trillion barrels (190 km3) of oil equivalent, enough for 60 years' supply if consumption is non-increasing, and that gas reserves are trending upward.[10] A similar situation exists with oil reserves in that they have increased despite the actual declines of worldwide discoveries for decades and despite increases in consumption. BP’s former Chief Petroleum Engineer Jeremy Gilbert stated in 2007 that the growth in oil reserves "results largely from distortions created by the..reporting rules of the US Securities and Exchange Commission" that force companies to be overly conservative in their calculation of reserves, but that "even this illusory growth is unlikely to last," because fewer oil reserves are coming under the control of SEC-regulated companies.[11] However, since Gilbert's statement, proven reserves of both oil and gas have continued to rise, proven oil reserves increasing 23%, from 1.20 trillion barrels in 2007, to 1.48 trillion barrels in 2012.[8]
Production

Reserves

Peak gas for individual nations
Italy
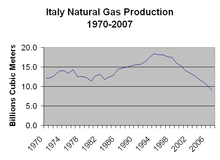
Italy's gas consumption is presently third-highest in Europe, behind only Germany and the United Kingdom. Gas consumption is growing at a steady rate, and gas consumption in 2001 was 50% greater than it was in 1990.[12]
Italy’s major oil and gas company is Eni. Formerly state-owned, it was privatized during the 1990s, but the government still retains around one-third of the shares. Natural gas reserves in Italy were 164 billion m3 at the beginning of 2007. Natural gas production in 2005 was 11.5 billion m3, while consumption was 82.6 billion m3. The difference was imported. The primary sources of imported gas are Algeria, Russia and the Netherlands. Among European countries, Italy is the fourth largest oil consumer after Germany, the UK and France, and the third largest natural gas consumer after Germany and the UK.[13]
Netherlands

The Netherlands government has stated that peak gas occurred in 2007-2008 and the country will have become a net importer of natural gas by 2025.[14]
Romania
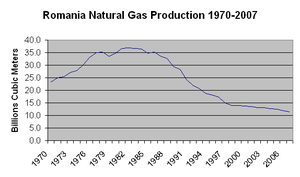
Natural gas in Romania was discovered in 1909 in the Sărmăşel area.[15] In 1917, Turda became the first European town lit up with natural gas. Maximum production of 29.8 billion m3 was achieved in 1976.[16] Today, gas provides about 40% of the country's energy needs.
Russia

Gazprom, Russia's state-controlled gas monopoly, is a firm which holds 25% of the world's gas reserves. Gazprom produces the bulk of Russia's gas and exports more than 25% of West Europe's gas needs. According to Gazprom CEO Alexei Miller on 4 July 2008 Russian gas output was no longer growing but would remain flat for the years 2007 through 2009. Russia produced 556 BCM in 2006 and 548.5 BCM in 2007.[17] However, gas production resumed an upward trend in 2010, and 2012 Russian gas production was higher than it had been in 30 years.[18]
United Kingdom

UK gets its natural gas almost entirely from the North Sea. The North Sea gas field peaked in 2000 and has been falling quickly since. Production in 2004 was 12% down from the peak.[19]
United States


Steidle, 1952
In 1952, Dr. Edward Steidle, Dean of the School of Mineral Industries at Pennsylvania State College, predicted that gas production would soon decline significantly from 1952 rates, so that gas would cease to be a significant energy source by 2002, and possibly as early as 1975.[20]
M. King Hubbert
In 1956, Hubbert used an estimated ultimate recovery (EUR) of 850 trillion cubic feet (24,000 km3) (an amount postulated by geologist Wallace Pratt) to predict a US production peak of about 14 trillion cubic feet (400 km3) per year to occur "approximately 1970".[21] Pratt, in his EUR estimate (p. 96), explicitly included what he called the "phenomenal discovery rate" that the industry was then experiencing in the offshore Gulf of Mexico.[22]
In 1962, Hubbert pushed his predicted peak back a few years based on a more optimistic estimation of 1,000 trillion cubic feet of total original reserves. His new peak gas curve predicted a peak in 1978 at slightly more than 20 tcf per year.[23]
US gas production reached a peak in 1973 at about 24.1 trillion cubic feet (680 km3), and declined overall for the next decade. But even greater new discoveries in the offshore Gulf of Mexico than anticipated, and development of "unconventional reserves",[24] proved Pratt's EUR estimate to be too low as US gas production rose again.
In 1971, Hubbert revised his peak gas estimate based on updated reserve information. He revised his estimated ultimate recovery upward to 1,075 trillion cubic feet (30,400 km3) for the lower 48 states only, and predicted: "For natural gas, the peak of production will probably be reached between 1975 and 1980."[25] Gas production for the lower 48 states did peak in 1979, and declined for several years, but rose again, and once more Hubbert's assumed EUR of 1,075×1012 cu ft (30,400 km3) proved to be too low, as actual lower 48 state production from 1936 through 2012 has already exceeded 1,265×1012 cu ft (35,800 km3), 18% higher than the estimated EUR of 1,075.[26]
Recent US peak predictions
Economist Doug Reynolds predicted in 2005 that the North American gas peak would occur in 2007[27] Reynolds revised his forecast in 2009 to include Southern Canada; he predicted that the combined US Lower 48-Southern Canadian gas production would peak in 2013.[28]
Although Hubbert had acknowledged multiple peaks in oil production in Illinois, he used single peak models for oil and gas production in the US as a whole. In 2008, Tad Patzek of the University of California rejected the single-peak model, and showed the multiple peaks of past US gas production as the sum of five different Hubbert curves. He concluded that new technology has more than doubled gas reserves. His figure 15 shows gas production declining steeply after a probable peak in known cycles in 2008. However, he refrained from predicting a date after which gas production would begin terminal decline, but noted: "The actual future of US natural gas production will be the sum of known Hubbert cycles, shown in this paper, and future Hubbert cycles." and warned: "The current drilling effort in the US cannot be sustained without major new advances to increase the productivity of tight formations."[29]
In 2005 Exxon's CEO Lee Raymond said to Reuters that "Gas production has peaked in North America."[30] The Reuters article continues to say "While the number of U.S. rigs drilling for natural gas has climbed about 20 percent over the last year and prices are at record highs, producers have been struggling to raise output." North American natural gas production indeed peaked in 2001 at 27.5×10¹² cu ft (780 km3) per year, and declined to 26.1×10¹² cu ft (740 km3) by 2005, but then rose again in 2006 and 2007 to a new high of 27.9×10¹² cu ft (790 km3)in 2007[31] This would make the 2007 figure 1.45% higher than the 2001 figure, for an average annual increase of 0.24% per year during 2001-2007.
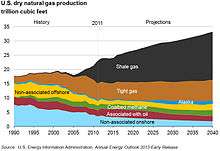
In December 2009 the US Energy Information Administration (EIA) projected US marketed gas production will have reached a first peak at 20.60×10¹² cu ft (583 km3) in 2009, decline to 18.90×10¹² cu ft (535 km3) in 2013, then rise again to 23.27×10¹² cu ft (659 km3) in 2035, the final year of their projection, for an average annual rate of increase of 0.47% per year during 2009-2035[32] In its Annual Energy Outlook 2010 released in May 2010, EIA projected growth from 20.6×10¹² cu ft (580 km3) in 2008 (same amount as 2009) to 23.3 trillion cubic feet (660 km3) in 2035 in the Reference case, with Alternative case estimates ranging 17.4 to 25.9×10¹² cu ft (730 km3) in 2035. These represent productions of average annual growth rates between -0.63% (net decline) and 0.85% in the alternate cases, and 0.46% in the reference case.[33]
North American natural gas crisis, 2000-2008

The natural gas crisis is typically described by upward price spikes of natural gas in North America from 2000 to 2008,[34] due to the decline in production and the increase in demand for electricity generation. Gas production in the U.S. fell from 20,570,295×106 cu ft (5.824859×10¹¹ m3) in 2001 to 18,950,734×106 cu ft (5.366250×10¹¹ m3) in 2005, before rising again in 2006 and 2007.[35]
The anticipated gas shortage in North America led some, such as former Federal Reserve Chairman Alan Greenspan to advocate increased imports of liquefied natural gas (LNG).[36] However, record high natural gas production rates and proved reserves in the US have put LNG imports on hold, and even spawned projects for LNG exports from North America. As of April 2015, ten LNG export terminals had been approved and six are under construction in the US and Canada.[37]
Estimates of total reserve base
The Potential Gas Committee, a non-profit group at the Colorado School of Mines, estimated US natural gas resources to be 1,525 trillion cubic feet (43,200 km3) in 2007 (86 times current annual consumption) and in 2009 raised their estimate again to 2,247 trillion cubic feet (63,600 km3) (almost 100 times current annual consumption). The large increase over previous years' estimates was attributed to a surge in natural gas drilling and exploration spurred by a rise in prices and new technology allowing production from once uneconomic formations, such as shale and coal seams.[38][39]
World peak gas
In 2002, R.W. Bentley (p. 189) predicted a global "decline in conventional gas production from about 2020."[40]
The US Energy Information Administration predicts that world gas production will continue to increase through 2030, with a total increase of almost 50%, and an average annual rate of increase of 1.6% per year, for the 2006-2030 period.[41]
In their March 2013 report, "Fossil and Nuclear Fuels - The Supply Outlook", the Energy Watch Group predict global natural gas production "will peak around or even before the year 2020". [42]
See also
- 2004 Argentine energy crisis - an example of the effects of a gas shortage
- Hubbert peak theory
- Methane, the principal constituent of natural gas.
Resource peaks
References
- ↑ Bulls now talking up "Peak Gas" as new cause for long-term concern, Natural Gas Week, 03-06-06
- ↑ Cleveland, C.; Kaufmann, R. (1997). "Natural Gas in the US: How Far Can Technology Stretch the Resource Base?" (PDF). Energy Journal-Cambridge Ma then Cleveland Oh-. ENERGY ECONOMICS EDUCATIONAL FOUNDATION INC. 18: 89–108.
- ↑ "Natural Gas Market". United Nations Conference on Trade and Development. Retrieved 20 September 2008.
- ↑ M. King Hubbert, “Energy Resources,” National Academy of Sciences, Publication 1000-D, 1962, p.82.
- ↑ M. King Hubbert, “Degree of advancement of petroleum exploration in the United States,” AAPG Bulletin, Nov. 1967, v.51 n.11, p.2214.
- 1 2 David L. Goodstein (2004). Out Of Gas: The end of age of oil. W. W. Norton & Company. p. 128. ISBN 978-0-393-05857-4. Retrieved 30 September 2008.
- ↑ Harry J. Longwell (December 2002). "The future of the oil and gas industry: past approaches, new challenges" (PDF). 5 (3). World Energy. Retrieved 30 September 2008.
- 1 2 OPEC, Annual statistical bulletin 2013.
- ↑ David F. Morehouse, The intricate puzzle of oil and gas reserve growth, US Energy Information Administration, Natural Gas Monthly, July 1997.
- ↑ Evans-Pritchard, Ambrose (11 October 2009). "Energy crisis is postponed as new gas rescues the world". The Daily Telegraph. London. Retrieved 22 May 2010.
- ↑ David Strahan, The limits to reserves growth, 18 Dec. 2007.
- ↑ "Country Review Italy". EU GeoCapacity. Retrieved 21 September 2008.
- ↑ "Italy needs to face up to the future". Power Engineering.
- ↑ "Energie Rapport 2008" (in Dutch). Ministrie van Economische Zaken. June 2008. p. 41. Retrieved 2 October 2008.
- ↑ Gheorghe Stephan. "Outlining the Role of Romania in the European Gas Transit Chain: Current Status and Prospective" (PDF). International Energy Agency. Retrieved 20 September 2008.
- ↑ Andrei Viforeanu; Wayne Wells; Jay W. Hodny (2003). "Passive surface geochemical survey leads to dry gas discoveries". World Oil. Retrieved 20 September 2008.
- ↑ "The Russian Oil & Gas Producers - Gazprom.". APS Review Gas Market Trends. 18 August 2008. Retrieved 6 October 2008.
- ↑ US EIA, International energy statistics, accessed 21 Sept. 2013.
- ↑ Chris Vernon (26 August 2005). "UK gas and electricity crisis looming". Energy Bulletin. Retrieved 19 September 2008.
- ↑ Edward Steidle, Mineral Forecast, 2000 A.D. (State College, Penn.: Pennsylvania State College, 1952) 74.
- ↑ M. King Hubbert (June 1956). "Nuclear Energy and the Fossil Fuels 'Drilling and Production Practice'" (PDF). API. p. figure 22 and p.25,36. Retrieved 18 April 2008.
- ↑ Wallace E. Pratt (1956) "The impact of the peaceful uses of atomic energy on the petroleum industry," in Peaceful Uses of Atomic Energy, US Congress Joint Committee on Atomic Energy, p.89-103.
- ↑ M. King Hubbert (1962) Energy Resources, National Academy of Sciences, Publication 1000-D, p.81.
- ↑ "British author says world may be close to peak natural gas output". The Oil Daily. 15 November 2007.
- ↑ M. King Hubbert, 1971, The energy resources of the earth in Energy and Power", p.35. Retrieved on 8 September 2008.
- ↑ US Energy Information Agency: Annual U.S. Natural Gas Gross Withdrawals(nationwide minus Alaska production) Retrieved 7 December 2008.
- ↑ Bill White (17 December 2005). "State's consultant says nation is primed for using Alaska gas". Energy Bulletin. Archived from the original on 23 June 2008. Retrieved 2 October 2008.
- ↑ Douglas B. Reynolds & Marek Kolodziej (25 May 2009). "North American Natural Gas Supply Forecast: The Hubbert Method Including the Effects of Institutions". MDPI. Retrieved 25 May 2009.
- ↑ Tad W. Patzek (2008). "Exponential growth, energetic Hubbert cycles, and the advancement of technology" (PDF). pp. 14–15. Retrieved 10 September 2008.
- ↑ "Exxon says N. America gas production has peaked". Reuters. 21 June 2005. Retrieved 4 October 2008.
- ↑ US Energy Information Administration: World dry natural gas production Retrieved 7 December 2008.
- ↑ US Energy Information Administration: Table 13. Natural gas supply, disposition, and prices Retrieved 7 December 2008
- ↑ Annual Energy Outlook 2010
- ↑ Wiser, R.; Bolinger, M.; St Clair, M. (2004). "Easing the natural gas crisis: Reducing natural gas prices through increased deployment of renewable". doi:10.2172/838985.
- ↑ "U.S. Natural Gas Marketed Production 1900 - 2005 (MMcf)". U.S. Department of Energy. Retrieved 16 July 2007.
- ↑ California Energy Commission Frequently Asked Questions About LNG
- ↑ US Federal Energy Regulatory Commission, , 14 April March 2015.
- ↑ Ben Casselman (17 June 2009). "US Has Almost 100-Year Supply of Natural Gas". The Wall Street Journal. Rigzone.com. Retrieved 18 June 2009.
- ↑ "Potential Gas Committee Report Shows Unprecedented Increase in U.S. Natural Gas Resources". IHS. 19 September 2007. Retrieved 18 June 2009.
- ↑ R.W. Bentley (2002). "Global oil & gas depletion: an overview" (PDF). Energy Policy. pp. 189–205. Retrieved 2 October 2008.
- ↑ US Energy Information Administration: Table 5. World natural gas production by region and country, 2005-2030 Retrieved 7 December 2008.
- ↑ "Fossil and Nuclear Fuels - The Supply Outlook" (PDF). Energy Watch Group. March 2013. p. 91. Retrieved 1 March 2014.
External links
- "Peak Gas". HubbertPeak.com. Retrieved 1 July 2008.
- "Energy Export Databrowser". Mazama Science. Retrieved 25 March 2010.
- Jean Laherrere. "Future of Natural Gas Supply". ASPO. Retrieved 30 September 2008.
- Andrew McKillop (13 December 2006). "Peak Natural Gas is On the Way". Raise the Hammer. Retrieved 1 July 2008.
- Michael J. Radzicki. "Introduction to System Dynamics". US Department of Energy, Office of Policy and International Affair. Retrieved 30 September 2008.