Pairs trade

The pairs trade or pair trading is a market neutral trading strategy enabling traders to profit from virtually any market conditions: uptrend, downtrend, or sideways movement. This strategy is categorized as a statistical arbitrage and convergence trading strategy.[1] The pair trading was pioneered by Gerry Bamberger and later led by Nunzio Tartaglia’s quantitative group at Morgan Stanley in the 1980s.[2]
Overview
The strategy monitors performance of two historically correlated securities. When the correlation between the two securities temporarily weakens, i.e. one stock moves up while the other moves down, the pairs trade would be to short the outperforming stock and to long the underperforming one, betting that the "spread" between the two would eventually converge.[3] The divergence within a pair can be caused by temporary supply/demand changes, large buy/sell orders for one security, reaction for important news about one of the companies, and so on.
Pairs trading strategy demands good position sizing, market timing, and decision making skill. Although the strategy does not have much downside risk, there is a scarcity of opportunities, and, for profiting, the trader must be one of the first to capitalize on the opportunity.
A notable pairs trader was hedge fund Long-Term Capital Management.[4]
A simplified example
Pepsi (PEP) and Coca Cola (KO) are different companies that create a similar product, soda pop. Historically, the two companies have shared similar dips and highs, depending on the soda pop market. If the price of Coca Cola were to go up a significant amount while Pepsi stayed the same, a pairs trader would buy Pepsi stock and sell Coca Cola stock, assuming that the two companies would later return to their historical balance point. If the price of Pepsi rose to close that gap in price, the trader would make money on the Pepsi stock, while if the price of Coca Cola fell, he would make money on having shorted the Coca Cola stock.
Examples of potentially correlated pairs
- Coca-Cola (KO) and Pepsi (PEP)
- Renault (RNL) and PSA Peugeot Citroen (UG)
- Wal-Mart (WMT) and Target Corporation (TGT)[5]
- Exxon Mobil (XOM) and Chevron Corporation (CVX)
- Alliance and Leicester (AL.L) and Royal Bank of Scotland (RBS.L)
- Portugal Telecom (PTC.LS) and Telefonica (TEF.MC)
- Banco Comercial Português (MBC.LS) and Banco Português de Investimento (BPI.LS)
- RWE (RWE.DE) and E.ON (EOAN.DE)
- BHP Billiton Limited (BHP) and BHP Billiton plc (BBL)
Model-based pairs trading
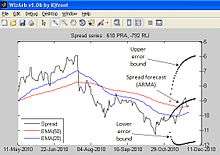
While it is commonly agreed that individual stock prices are difficult to forecast, there is evidence suggesting that it may be possible to forecast the price—the spread series—of certain stock portfolios. A common way to attempt this is by constructing the portfolio such that the spread series is a stationary process. To achieve spread stationarity in the context of pairs trading, where the portfolios only consist of two stocks, one can attempt to find a cointegration irregularities between the two stock price series who generally show stationary correlation. This irregularity is assumed to be bridged soon and forecasts are made in the opposite nature of the irregularity.[6][7] This would then allow for combining them into a portfolio with a stationary spread series.[8] Regardless of how the portfolio is constructed, if the spread series is a stationary processes, then it can be modeled, and subsequently forecast, using techniques of time series analysis. Among those suitable for pairs trading are Ornstein-Uhlenbeck models,[5][9] autoregressive moving average (ARMA) models[10] and (vector) error correction models.[8] Forecastability of the portfolio spread series is useful for traders because:
- The spread can be directly traded by buying and selling the stocks in the portfolio, and
- The forecast and its error bounds (given by the model) yield an estimate of the return and risk associated with the trade.
The success of pairs trading depends heavily on the modeling and forecasting of the spread time series.[11] Comprehensive empirical studies on pairs trading have investigated its profitability over the long-term in the US market using the distance method, co-integration, and copulas. They have found that the distance and co-integration methods result in significant alphas and similar performance, but their profits have decreased over time. Copula pairs trading strategies result in more stable but smaller profits.[12]
Market neutrality
- The pairs trade helps to hedge sector- and market-risk. For example, if the whole market crashes, and the two stocks plummet along with it, the trade should result in a gain on the short position and a negating loss on the long position, leaving the profit close to zero in spite of the large move.
- Pairs trade is a mean-reverting strategy, betting that the prices will eventually revert to their historical trends.
- Pairs trade is a substantially self-funding strategy, since the short sale proceeds may be used to create the long position.
Algorithmic pairs trading
Today, pairs trading is often conducted using algorithmic trading strategies on an execution management system. These strategies are typically built around models that define the spread based on historical data mining and analysis. The algorithm monitors for deviations in price, automatically buying and selling to capitalize on market inefficiencies. The advantage in terms of reaction time allows traders to take advantage of tighter spreads.
Drift and risk management
Trading pairs is not a risk-free strategy. The difficulty comes when prices of the two securities begin to drift apart, i.e. the spread begins to trend instead of reverting to the original mean. Dealing with such adverse situations requires strict risk management rules, which have the trader exit an unprofitable trade as soon as the original setup—a bet for reversion to the mean—has been invalidated. This can be achieved, for example, by forecasting the spread and exiting at forecast error bounds. A common way to model, and forecast, the spread for risk management purposes is by using autoregressive moving average models.
Some other risks include:
- In ‘market-neutral’ strategies, you are assuming that the CAPM model is valid and that beta is a correct estimate of systematic risk—if this is not the case, your hedge may not properly protect you in the event of a shift in the markets. Note there are other theories on how to estimate market risk—such as the Fama-French Factors.
- Measures of market risk, such as beta, are historical and could be very different in the future than they have been in the past.
- If you are implementing a mean reversion strategy, you are assuming that the mean will remain the same in the future as it has been in the past. When the means change, it is sometimes referred to as ‘drift’.
References
- ↑ Kanamura, Takashi; Rachev, Svetlozar; Fabozzi, FranK (5 July 2008). "The Application of Pairs Trading to Energy Futures Markets" (PDF). Karlsruhe Institute of Technology. Retrieved 20 January 2015.
- ↑ Bookstaber, Richard. A Demon Of Our Own Design, p. 186. Wiley, 2006.
- ↑ Lecture 23: Pairs Trading
- ↑ Lowenstein, Roger (2000). When genius failed : the rise and fall of Long-Term Capital Management (1 ed.). New York: Random House. ISBN 0-375-50317-X.
- 1 2 Mahdavi Damghani, Babak (2013). "The Non-Misleading Value of Inferred Correlation: An Introduction to the Cointelation Model". Wilmott. 2013 (1): 50–61. doi:10.1002/wilm.10252.
- ↑ C. Alexander: "Market Models: A Guide to Financial Data Analysis". Wiley, 2001.
- ↑ "Co-integration Trading Strategy". Bullmen Binary. Retrieved 20 January 2015.
- 1 2 A. D. Schmidt: "Pairs Trading - A Cointegration Approach". University of Sydney, 2008. http://ses.library.usyd.edu.au/bitstream/2123/4072/1/Thesis_Schmidt.pdf
- ↑ S. Mudchanatongsuk, J. A. Primbs and W. Wong: "Optimal Pairs Trading: A Stochastic Control Approach". Proceedings of the American Control Conference, 2008. http://www.nt.ntnu.no/users/skoge/prost/proceedings/acc08/data/papers/0479.pdf
- ↑ G. Vidyamurthy: "Pairs trading: quantitative methods and analysis". Wiley, 2004.
- ↑ "A New Approach to Modeling and Estimation for Pairs Trading". Monash University, Working Paper. http://www.finanzaonline.com/forum/attachments/econometria-e-modelli-di-trading-operativo/1048428d1238757908-spread-e-pair-trading-pairstrading_binhdo.pdf
- ↑ Rad, Hossein; Low, Rand Kwong Yew; Faff, Robert (2016-04-27). "The profitability of pairs trading strategies: distance, cointegration and copula methods". Quantitative Finance. 0 (0): 1–18. doi:10.1080/14697688.2016.1164337. ISSN 1469-7688.