PI curve
The PI (photosynthesis-irradiance) curve is a graphical representation of the empirical relationship between solar irradiance and photosynthesis. A derivation of the Michaelis–Menten curve, it shows the generally positive correlation between light intensity and photosynthetic rate. Plotted along the x-axis is the independent variable, light intensity (irradiance), while the y-axis is reserved for the dependent variable, photosynthetic rate.

Introduction
The PI curve can be applied to terrestrial and marine reactions but is most commonly used to explain ocean-dwelling phytoplankton’s photosynthetic response to changes in light intensity. Using this tool to approximate biological productivity is important because phytoplankton contribute ~50%[1] of total global carbon fixation and are important suppliers to the marine food web.
Within the scientific community, the curve can be referred to as the PI, PE or Light Response Curve. While individual researchers may have their own preferences, all are readily acceptable for use in the literature. Regardless of nomenclature, the photosynthetic rate in question can be described in terms of carbon (C) fixed per unit per time. Since individuals vary in size, it is also useful to normalise C concentration to Chlorophyll a (an important photosynthetic pigment) to account for specific biomass.
History
As far back as 1905, marine researchers attempted to develop an equation to be used as the standard in establishing the relationship between solar irradiance and photosynthetic production. Several groups had relative success, but in 1976 a comparison study conducted by Alan Jassby and Trevor Platt, researchers at the Bedford Institute of Oceanography in Dartmouth, Nova Scotia, reached a conclusion that solidified the way in which a PI curve is developed. After evaluating the eight most-used equations, Jassby and Platt revealed that an adaptation of the Michaelis-Menten equation, previously used in enzyme kinetics, best served the relationship demonstration. Their findings were so conclusive that the Michaelis–Menten equation remains the standard for PI curve generation.
Equations
There are two simple derivations of the equation that are commonly used to generate the hyperbolic curve. The first assumes photosynthetic rate increases with increasing light intensity until Pmax is reached and continues to photosynthesise at the maximum rate thereafter.
- P = Pmax[I] / (KI + [I])
- P = photosynthetic rate at a given light intensity
- Commonly denoted in units such as (mg C m-3 h-1) or (µg C µg Chl-a-1 h-1)
- Pmax = the maximum potential photosynthetic rate per individual
- [I] = a given light intensity
- Commonly denoted in units such as (µMol photons m-2 s-1 or (Watts m-2 h-1)
- KI = half-saturation constant; the light intensity at which the photosynthetic rate proceeds at ½ Pmax
- Units reflect those used for [I]
- P = photosynthetic rate at a given light intensity
Both Pmax and the initial slope of the curve, ΔP/ΔI, are species-specific, and are influenced by a variety of factors, such as nutrient concentration, temperature and the physiological capabilities of the individual. Light intensity is influenced by latitudinal position and undergo daily and seasonal fluxes which will also affect the overall photosynthetic capacity of the individual. These three parameters are predictable and can be used to predetermine the general PI curve a population should follow.
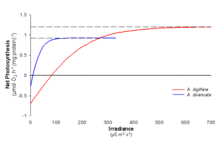
As can be seen in the graph, two species can have different responses to the same incremental changes in light intensity. Population A (in blue) has an initial rate higher than that of Population B (in red) and also exhibits a stronger rate change to increased light intensities at lower irradiance. Therefore, Population A will dominate in an environment with lower light availability. Although Population B has a slower photosynthetic response to increases in light intensity its Pmax is higher than that of Population A. This allows for eventual population dominance at greater light intensities. There are many determining factors influencing population success; using the PI curve to elicit predictions of rate flux to environmental changes is useful for monitoring phytoplankton bloom dynamics and ecosystem stability.
The second equation accounts for the phenomenon of photoinhibition. In the upper few meters of the ocean, phytoplankton may be subjected to irradiance levels that damage the chlorophyll-a pigment inside the cell, subsequently decreasing photosynthetic rate. The response curve depicts photoinhibition as a decrease in photosynthetic rate at light intensities stronger than those necessary for achievement of Pmax.

Terms not included in the above equation are:
- βI = light intensity at the start of photoinhibition
- αI = a given light intensity
Examples
Data sets showing interspecific differences and population dynamics.
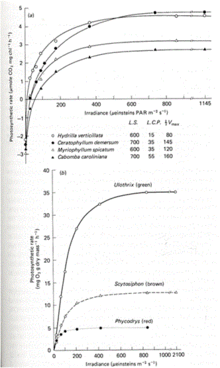
The hyperbolic response between photosynthesis and irradiance, depicted by the PI curve, is important for assessing phytoplankton population dynamics, which influence many aspects of the marine environment.
References
- Chalker B.E., Dunlap W.C. and Oliver J.K., 1983. Bathymetric adaptations of reef building corals at Davies Reef, Great Barrier Reef, Australia. II. Light saturation curves for photosynthesis and respiration. J Exp Mar Biol Ecol 73:37–87.
- Lalli C.M. and Parsons T.R., 1997. Biological Oceanography: An Introduction, 2nd edn. Butterworth–Heinemann, Oxford.
- Marra J., Heinemann K. and Landriau G. Jr., 1985. Observed and predicted measurements of photosynthesis in a phytoplankton culture exposed to natural irradiance. Mar. Ecol. 24:43–50.
- Miller C.B., 2004. Biological Oceanography, Blackwell.
- Jasby A.D. and Platt T., 1976. Mathematical formulation of the relationship between photosynthesis and light for phytoplankton. Limnol. Oceanogr. 21:540–547.
- Platt T. and Jasby, A.D., 1976. The relationship between photosynthesis and light for natural assemblages of coastal marine phytoplankton. J. Phycol. 12:421–430.
Notes
- ↑ Field et al. 1998