Optimality model
In biology, optimality models are a tool used to evaluate the costs and benefits of different organismal features, traits, and characteristics, including behavior, in the natural world. This evaluation allows researchers to make predictions about an organisms’s optimal behavior or other aspects of its phenotype. Optimality modeling is the modeling aspect of optimization theory. It allows for the calculation and visualization of the costs and benefits that influence the outcome of a decision, and contributes to an understanding of adaptations.
Optimal behavior is defined as an action that maximizes the difference between the costs and benefits of that decision. Three primary variables are used in optimality models of behavior: decisions, currency, and constraints.[1] Decision involves evolutionary considerations of the costs and benefits of their actions. Currency is defined as the variable that is intended to be maximized (ex. food per unit of energy expenditure). It is the driving factor behind an action and usually involves food or other items essential to an organism’s survival. Constraints refer to the limitations placed on behavior, such as time and energy used to conduct that behavior, or possibly limitations inherent to their sensory abilities.
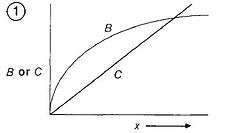
Optimality models are used to predict optimal behavior (ex. time spent foraging). To make predictions about optimal behavior, cost-benefit graphs are used to visualize the optimality model (see Fig 1). Optimality occurs at the point in which the difference between benefits and costs for obtaining a currency via a particular behavior is maximized.
Constructing the Optimality Model
To construct an optimality model, the behavior must first be clearly defined. Then, descriptions of how the costs and benefits vary with the way the behavior is performed must be obtained.[2] Examples of benefits and costs include direct fitness measures like offspring produced, change in lifespan, time spent or gained, or energy spent and gained.
Each time an organism displays a certain behavior, it must weigh the costs and benefits to make a decision. For example, given X amount of time traveling, after catching one bug, would it be better for a bird to continue foraging or to quickly return to its nest to feed chicks? [3] Better understanding of the relationships between the values in a model leads to better predictions of organism behavior.
To determine the optimum time spent on a behavior, one can make a graph showing how benefits and costs change with behavior. Optimality is defined as the point where the difference between benefits and costs for a behavior is maximized, which can be done by graphing the benefits and costs on the y-axis and a measure of the behavior on the x-axis.
A currency must also be identified. A test of the predictions generated by the optimality model can be performed to determine which currency the organism maximizes at any given time. For example, when constructing an optimality model for bee foraging time, researchers looked at whether energetic efficiency(energy gained/energy spent) or net rate of gain ((energy gained - energy spent)/time) was optimized. It was found that the bees maximized energetic efficiency when foraging for nectar.[4]
Examples
Starlings
One common use of the optimality model is in optimal foraging theory. For example, the foraging behavior in starlings can be predicted using an optimality model, specifically a marginal value theorem model. Researchers compared the amount of time a bird forages to the distance the bird travels to the foraging ground.[5] Birds try to maximize the amount of food they take back to their offspring. Starlings mostly feed their offspring leatherjackets. As starlings gather more leatherjackets, it becomes increasingly difficult and time-consuming to find subsequent leatherjackets with the additional prey in their mouths. Thus at some point, it benefits them to stop expending extra energy to find additional food and return to their nests instead. A graph of this phenomenon, called a loading curve, compares foraging time to the number of prey captured. Alex Kacelnik predicted that the curve would fluctuate depending on the starling’s travel time. He predicted that starlings traveling further would spend more time at the foraging site to achieve optimal foraging behavior. It’s important that these starlings spend extra time at the foraging ground because it takes a lot of energy to travel back and forth from its nest. On the other hand, he predicted starlings traveling shorter distances to foraging grounds should spend less time foraging, making more frequent trips in order to optimize their behavior. Since these starlings have a shorter distance to travel, they don’t need to put as much energy into searching for leatherjackets because it is easier for them to return to the foraging ground. His results were consistent with his predictions.
Dung Flies
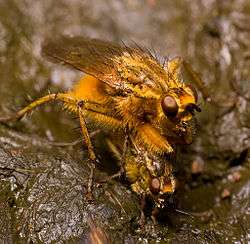
Dung flies are a polygamous species that mate on cowpats. The copulation behavior of this species can also be modeled using the marginal value theorem. It has been discovered that in cases where two male dung flies copulate with the same female in relatively rapid succession, the second male will fertilize 80% of the eggs, while the first male will only fertilize 20%. This creates a dilemma for male dung flies. The longer they remain with a female after copulation, the better they are able to guard her from copulating with other males, hence increasing the likelihood of passing his genes to her offspring. However, the longer the male remains with an individual female, the smaller chance he has of finding other mates. Geoff Parker predicted that an optimality model comparing these two behaviors would be affected by the travel time between two patches.[6] For example, short distances between cowpats should widen the pool of available mates in a specific geographic location. Parker predicted that under this condition, dung flies would be more likely to leave their current mate sooner to find additional mates. But if cowpats are few and far between, it would benefit a male dung fly to spend more time guarding a mate, ensuring his genes are passed on, because he may have difficulty finding an additional mate. The results from Parker’s experiment agree with this model.
Crows and Whelks
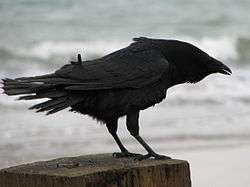
On the Pacific coast of Canada, crows forage on whelks, a species of mollusk. To break the shell of the mollusk, the crows fly and drop the whelks on rocks. Reto Zach constructed an optimality model to predict the optimal height at which crows drop the whelks.[7] The benefit in this model is the success rate of cracking the whelk’s shell, while the primary cost is the energy spent flying. If the crows did not fly high enough, they would have little success in breaking the whelks’ shells. However, the crows could waste valuable energy if they climb too high. In his model, Zach predicted the optimal height for crows to drop the whelks. To do this, Zach calculated the total distance each whelk was dropped before it was successfully broken. Whelks dropped from 3 meters and lower actually had traveled high total distances because they had to be dropped numerous times in order to be broken. On the other hand, whelks dropped from 5 meters and 15 meters were dropped approximately the same number of times to initiate a break; however, the crows would obviously have to climb higher to break a whelk at 15 meters than at 5 meters. Zach predicted 5 meters to be the optimal dropping height. The results indicated that the crows do follow this model, as the average dropping height was 5.2 meters.
Criticisms and Limitations
Several inherent limitations of optimality models have led to criticism of their usefulness, including: (a) the optimality of an organism’s behaviour cannot actually be tested, (b) organisms are not adapted to optimize.[8]
Optimality models may not predict or may be insufficient in explaining an organism’s behaviour. For example, even when choosing the “best” currency, organisms will likely not perfectly match the optimality model generated, but that does not necessarily mean the organism is acting non-optimally. In addition, optimality models assume that characteristics are at an optimum; however, there are several reasons why this assumption cannot always be made. Many behavioural traits may only be approaching optima, and there may be explanations unaccounted for in the optimality model for the development of certain characteristics.[9] The ability of natural selection to optimize behaviour depends on the rate at which selection can alter genetic structure, which is affected by the amount of additive variance present at the time of selection, gene flow, rate of environmental change, and random effects such as genetic drift. Maximization requires both genetic and environmental stability, but real populations have discontinuous phenotypes and fluctuations in payoff.[10] Strict optima may not be reachable due to genetic and environmental changes.[11]
Genetic factors that may limit the attainment of optimality include mutations and genetic linkage. Mutations can push populations away from the optimum. Additionally, beneficial and detrimental alleles sometimes stay together due to genetic linkage, inherently preventing an “optimal” state. This situation illustrates the broader perspective of genes as interacting together, as opposed to producing a combined result of independently arising characteristics. Environmental factors include graded responses to the environment, environmental heterogeneity, and evolutionary lag. All individuals are different and display different responses to the environment, and all environments are heterogeneous. These differences make it difficult to identify a precisely “optimal” state for any particular individual in any specific environment. Similarly, if an environment or microenvironment fluctuates rapidly, organisms cannot respond to selection quickly enough to present a well-adapted, optimal form of their species.
Some alternative or complementary strategies to describing and analyzing organism behaviour include phylogenetic comparative methods and quantitative genetics.[2] By comparing different species and possible explanations, one can utilize the comparative method as a complement to optimality models and/or quantitative genetics. Quantitative genetics considers genetic variance and covariance and can facilitate identifying the constraints needed for a satisfactory optimization model.
References
- ↑ Lucas, J. (1983). The role of foraging time constraints and variable prey encounter in optimal diet choice. The American Naturalist, 122(2), 191-209.
- 1 2 Parker, G., & Smith, J. (1990). Optimality theory in evolutionary biology. Nature, 348.
- ↑ Davies, N., Krebs, J., & West, S. (2012). Introduction to behavioural ecology. (4 ed.). Hoboken, NJ: John Wiley & Sons.
- ↑ Schmid-Hempel, P. (1987). Efficient nectar-collecting by honeybees i. economic models. Journal of Animal Ecology, 56(1), 209-218. Retrieved from http://www.tb1.ethz.ch/PublicationsEO/PDFpapers/SCHMIDHEMPEL_JOURNAL_OF_ANIMAL_ECOLOGY_1987_56_209-218.pdf
- ↑ Bautista, L., Tinbergen, J., Wiersma, P., & Kacelnik, A. (1998). Optimal foraging and beyond: how starlings cope with changes in food availability. American Naturalist, 152(4), 543-61.
- ↑ Parker, G., Simmons, L., Stockley, P., McChristie, D., & Charnov, E. (1999). Optimal copula duration in yellow dung flies: effects of female size and egg content. Animal Behavior, 57(4), 795-805.
- ↑ Zach, R. (1978). Selection and dropping of whelks by northwestern crows. Behaviour, 67(2), 134-148.
- ↑ Davies, N., Krebs, J., & West, S. (2012). Introduction to Behavioural Ecology. (4 ed.). (pp. 432-433). Hoboken, NJ: John Wiley & Sons.
- ↑ Orzack, S. H., & Sober, E. (2001). Adaptationism and optimality. (1 ed.). Cambridge University Press.
- ↑ Frank, S. A. (1998). Foundations of social evolution. Princeton, NJ: Princeton University Press. 4 Prestwich, K. (2007). Notes on optimality theory. Retrieved from http://college.holycross.edu/faculty/kprestwi/behavior/e&be_notes/e&be_07_Optimality.pdf
- ↑ Prestwich, K. (2007). Notes on optimality theory. Retrieved from http://college.holycross.edu/faculty/kprestwi/behavior/e&be_notes/e&be_07_Optimality.pdf