Opinion polling for the United Kingdom European Union membership referendum

| Part of a series of articles on the |
| United Kingdom in the European Union |
|---|
 |
|
Membership
Legislation |
|
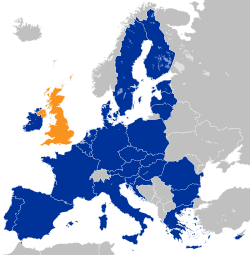
The referendum on EU membership took place on 23 June 2016. Opinion polling for the United Kingdom European Union membership referendum was ongoing in the months between the announcement of a referendum and the referendum polling day. Polls on the general principle of Britain's membership of the European Union were carried out for a number of years prior to the referendum. Opinion polls of voters in general tended to show roughly equal proportions in favour of remaining and leaving. Polls of business leaders, scientists, and lawyers showed majorities in favour of remaining. Among non-British citizens in other EU member states, polling suggested that a majority were in favour of the UK remaining in the EU in principle, but that a similarly sized majority believed that if the UK were only able to remain in the EU on renegotiated terms then it should leave.
Analysis
Demographics
Younger voters tended to support remaining in the EU (but are generally less likely to vote[1]) whereas older people tended to support leaving. There was no significant difference in attitudes between the genders. According to two out of three pollsters, managerial, professional and administrative workers were most likely to favour staying in the EU, while semi-skilled and unskilled workers, plus those reliant on benefits, were the largest demographic supporting leave. University graduates are generally more likely to vote remain compared to those with no qualifications.[2] White voters were evenly split, and all ethnic minority groups leant towards backing Remain, but registration is lower and turnout can be up to 25% lower in this demographic.[3] Support for remaining in the EU was known to be significantly higher in Scotland than it is in Great Britain as a whole, with Scottish voters saying they are generally more likely to vote.[4]
Polling methods
The way voters are polled is known to affect the outcome. Telephone polls have consistently found more support for remaining in the EU than online polls.[5] YouGov, which uses online polling, has criticised telephone polls because they "have too high a percentage of graduates", skewing the results.[6] Ipsos MORI and ComRes, and Peter Kellner, the former president of YouGov, have said telephone polls are more reliable.[7][8][9] ICM has said "as good a guess as any is that the right answer lies somewhere in between".[10] A joint study by Populus and Number Cruncher Politics in March 2016 concluded that telephone polls were likely to better reflect the state of public opinion on the issue.[11]
The results of the Referendum, as with the results of the 2015 General Election, show that there is still a problem with the polling methodology. Overall, however, online polls seem to have had a better performance than phone polls. Online polls, on average, predicted a "leave" win with a 1.2% margin, whereas phone polls had "remain" win with a 2.6% margin.[12]
Polls of polls
Several different groups have calculated polls of polls, which collect and average the results of opinion polls across different companies. They have different methodologies; for example, some give more weight to recent polls than others, some deal with undecided voters differently, and some attempt to adjust for the consistent gap between telephone and online polling. As a result, the polls of polls give a spread of results.
| Conducted by | To date | Remain | Leave | Undecided | Lead | Notes |
|---|---|---|---|---|---|---|
| What UK Thinks: EU[13] | 23 June | 52% | 48% | N/A | 4% | Six most recent polls. |
| Elections Etc.[14] | 23 June | 50.6% | 49.4% | N/A | 1.2% | Twelve most recent polls. Telephone polls are adjusted in favour of Leave and online polls in favour of Remain. |
| HuffPost Pollster[15] | 23 June | 45.8% | 45.3% | 9% | 0.5% | |
| Number Cruncher Politics[16] | 22 June | 46% | 44% | 10% | 2% | Equal weighting to phone and online polls. |
| Financial Times[17] | 23 June | 48% | 46% | 6% | 2% | Five most recent polls.[18] |
| The Telegraph[19] | 22 June | 51% | 49% | N/A | 2% | Six most recent polls. |
| The Economist[20] | 23 June | 44% | 44% | 9% | 0% | Excludes polls with fewer than 900 participants. |
Standard polling on EU membership
The tables show polling on whether the UK should be in or out of the EU. Polling generally weights the sample to be nationally representative. Polls were usually conducted within Great Britain, with Northern Ireland and Gibraltar normally omitted from the sample.[21] This has historically been the case in British opinion polling because Northern Ireland has a different set of political parties from the rest of the UK, reflecting the political divide between unionism and nationalism or republicanism.[21] Similarly, Gibraltar was not included in standard polls because it has its own local legislature and does not take part in British parliamentary elections, although Gibraltar does take part in elections to the European Parliament and took part in the referendum.
Most of the polls shown here were carried out by members of the British Polling Council (BPC) who fully disclose their findings, methodology and the client who commissioned the poll.[22] As non-members, Qriously, Greenberg Quinlan Rosner Research, Pew Research Center and Lord Ashcroft Polls are not bound by the standards of the BPC,[23] and their polls should be treated with caution.[24]
The percentages who "would not vote" or who refused to answer are not shown below, although some pollsters have excluded these in any case.
2016
| Date(s) conducted | Remain | Leave | Undecided | Lead | Sample | Conducted by | Polling type | Notes |
|---|---|---|---|---|---|---|---|---|
| 23 June 2016 | 48.1% | 51.9% | N/A | 3.78% | 33,577,342 | Results of the United Kingdom European Union membership referendum, 2016 | UK-wide referendum | |
| 22 June | 55% | 45% | N/A | 10% | 4,700 | Populus | Online | |
| 20–22 June | 51% | 49% | N/A | 2% | 3,766 | YouGov | Online | Includes Northern Ireland (turnout weighted) |
| 20–22 June | 49% | 46% | 1% | 3% | 1,592 | Ipsos MORI | Telephone | |
| 20–22 June | 44% | 45% | 9% | 1% | 3,011 | Opinium | Online | |
| 17–22 June | 54% | 46% | N/A | 8% | 1,032 | ComRes | Telephone | Those expressing a voting intention (turnout weighted) |
| 48% | 42% | 11% | 6% | All UK adults (turnout weighted) | ||||
| 16–22 June | 41% | 43% | 16% | 2% | 2,320 | TNS | Online | |
| 20 June | 45% | 44% | 11% | 1% | 1,003 | Survation/IG Group | Telephone | |
| 18–19 June | 42% | 44% | 13% | 2% | 1,652 | YouGov | Online | |
| 16–19 June | 53% | 46% | 2% | 7% | 800 | ORB/Telegraph | Telephone | Definite voters only |
| 17–18 June | 45% | 42% | 13% | 3% | 1,004 | Survation | Telephone | |
| 16–17 June | 44% | 43% | 9% | 1% | 1,694 | YouGov | Online | |
| 14–17 June | 44% | 44% | 12% | N/A | 2,006 | Opinium | Online | Most fieldwork conducted before the death of Jo Cox. |
| 16 June | All official campaigning suspended until 19 June after the fatal shooting of Jo Cox MP.[25] | |||||||
| 15–16 June | 42% | 44% | 9% | 2% | 1,734 | YouGov | Online | |
| 15 June | 42% | 45% | 13% | 3% | 1,104 | Survation | Telephone | |
| 10–15 June | 53% | 47% | N/A | 6% | 1,064 | BMG Research | Telephone | Assumes "Don't knows" will break 2:1 in favour of Remain |
| 45% | 55% | 10% | 1,468 | Online | Excluding "Don't knows" | |||
| 11–14 June | 43% | 49% | 3% | 6% | 1,257 | Ipsos MORI | Telephone | |
| 12–13 June | 39% | 46% | 15% | 7% | 1,905 | YouGov | Online | |
| 10–13 June | 45% | 50% | 5% | 5% | 1,000 | ICM | Telephone | Final ICM polls.[26] Only include those "definite" to vote. Paired telephone/online polls by otherwise identical methodology |
| 44% | 49% | 7% | 5% | 2,001 | Online | |||
| 9–13 June | 46% | 45% | 9% | 1% | 1,002 | ComRes | Telephone | |
| 7–13 June | 40% | 47% | 13% | 7% | 2,497 | TNS | Online | |
| 9–12 June | 48% | 49% | 3% | 1% | 800 | ORB | Telephone | Measures only those "definite" to vote |
| 16 May–12 June | 53% | 47% | N/A | 6% | N/A | NATCEN | Online/Telephone | Primarily online, those who failed to respond were followed up by phone |
| 9–10 June | 42% | 43% | 11% | 1% | 1,671 | YouGov | Online | |
| 7–10 June | 44% | 42% | 13% | 2% | 2,009 | Opinium | Online | |
| 8–9 June | 45% | 55% | N/A | 10% | 2,052 | ORB | Online | Weighted according to "definite" voters |
| 5–6 June | 43% | 42% | 11% | 1% | 2,001 | YouGov | Online | Remainder "won't vote" |
| 3–5 June | 43% | 48% | 9% | 5% | 2,047 | ICM | Online | |
| 2–5 June | 48% | 47% | 5% | 1% | 800 | ORB | Telephone | Weighted according to "definite" to vote |
| 1–3 June | 41% | 45% | 11% | 4% | 3,405 | YouGov | Online | |
| 31 May–3 June | 43% | 41% | 16% | 2% | 2,007 | Opinium | Online | Weighted by new methodology[27] |
| 40% | 43% | 16% | 3% | Weighted by previous methodology[28] | ||||
| 30–31 May | 41% | 41% | 13% | N/A | 1,735 | YouGov | Online | |
| 27–29 May | 42% | 45% | 15% | 3% | 1,004 | ICM | Telephone | Paired telephone/online polls by otherwise identical methodology |
| 44% | 47% | 9% | 3% | 2,052 | Online | |||
| 25–29 May | 51% | 46% | 3% | 5% | 800 | ORB | Telephone | |
| 20–25 May | 44% | 45% | 12% | 1% | 1,638 | BMG Research | Online | |
| 24 May | 44% | 38% | 18% | 6% | 1,013 | Survation | Telephone | |
| 23–24 May | 41% | 41% | 13% | N/A | 1,756 | YouGov | Online | |
| 19–23 May | 41% | 43% | 16% | 2% | 1,213 | TNS | Online | |
| 20–22 May | 45% | 45% | 10% | N/A | 2,003 | ICM | Online | |
| 18–22 May | 55% | 42% | 3% | 13% | 800 | ORB | Telephone | Poll was said to reflect the private polling conducted for the government[29] |
| 17–19 May | 44% | 40% | 14% | 4% | 2,008 | Opinium | Online | |
| 16–17 May | 44% | 40% | 12% | 4% | 1,648 | YouGov | Online | |
| 14–17 May | 52% | 41% | 7% | 11% | 1,000 | ComRes | Telephone | |
| 14–16 May | 55% | 37% | 5% | 18% | 1,002 | Ipsos MORI | Telephone | |
| 13–15 May | 47% | 39% | 14% | 8% | 1,002 | ICM | Telephone | Paired telephone/online polls by otherwise identical methodology |
| 43% | 47% | 10% | 4% | 2,048 | Online | |||
| 11–15 May | 55% | 40% | 5% | 15% | 800 | ORB | Telephone | |
| 10–12 May | 38% | 41% | 21% | 3% | 1,222 | TNS | Online | |
| 29 Apr–12 May | 36% | 39% | 22% | 3% | 996 | YouGov | Telephone | |
| 29 Apr–12 May | 38% | 40% | 16% | 2% | 1,973 | YouGov | Online | |
| 6–8 May | 44% | 46% | 11% | 2% | 2,005 | ICM | Online | |
| 4–6 May | 42% | 40% | 13% | 2% | 3,378 | YouGov | Online | Remainder "won't vote" |
| 29 Apr–3 May | 44% | 45% | 11% | 1% | 2,040 | ICM | Online | |
| 27–29 Apr | 43% | 46% | 11% | 3% | 2,029 | ICM | Online | |
| 26–29 Apr | 42% | 41% | 14% | 1% | 2,005 | Opinium | Online | 24% of respondents preferred not to say; the stated percentages are of the other 76% |
| 27–29 Apr | 49% | 51% | N/A | 2% | 2,000 | ORB | Online | |
| 26–28 Apr | 39% | 36% | 26% | 3% | 1,221 | TNS | Online | |
| 25–26 Apr | 41% | 42% | 13% | 1% | 1,650 | YouGov | Online | Remainder "won't vote" |
| 25–26 Apr | 45% | 38% | 17% | 7% | 1,003 | Survation | Telephone | |
| 22–26 Apr | 43% | 45% | 13% | 2% | 2,001 | BMG Research | Online | |
| 22–24 Apr | 44% | 46% | 10% | 2% | 2,001 | ICM | Online | |
| 20–24 Apr | 51% | 43% | 6% | 8% | 800 | ORB | Telephone | |
| 16–19 Apr | 51% | 40% | 9% | 9% | 1,002 | ComRes | Telephone | |
| 16–18 Apr | 49% | 39% | 8% | 10% | 1,026 | Ipsos MORI | Telephone | |
| 15–17 Apr | 48% | 41% | 11% | 7% | 1,003 | ICM | Telephone | Paired telephone/online polls by otherwise identical methodology |
| 43% | 44% | 13% | 1% | 2,008 | Online | |||
| 13–17 Apr | 53% | 41% | 6% | 12% | 800 | ORB | Telephone | |
| 15 April | The EU referendum campaign officially begins.[30] | |||||||
| 12–14 Apr | 38% | 34% | 28% | 4% | 1,198 | TNS | Online | |
| 12–14 Apr | 40% | 39% | 16% | 1% | 3,371 | YouGov | Online | Remainder "won't vote" |
| 11–12 Apr | 39% | 39% | 17% | N/A | 1,693 | YouGov | Online | Remainder "won't vote" |
| 7–11 Apr | 35% | 35% | 30% | N/A | 1,198 | TNS | Online | |
| 8–10 Apr | 45% | 38% | 17% | 7% | 1,002 | ComRes | Telephone | |
| 8–10 Apr | 42% | 45% | 12% | 3% | 2,030 | ICM | Online | |
| 7 April | HM Government starts sending a pro-Remain pamphlet to 27 million UK households and begins a pro-Remain digital advertising campaign.[31][32] | |||||||
| 6–7 Apr | 40% | 38% | 16% | 2% | 1,612 | YouGov | Online | Remainder "won't vote" |
| 29 Mar–4 Apr | 39% | 38% | 18% | 1% | 3,754 | YouGov | Online | Remainder "won't vote" |
| 1–3 Apr | 44% | 43% | 13% | 1% | 2,007 | ICM | Online | |
| 29 Mar–3 Apr | 51% | 44% | 5% | 7% | 800 | ORB | Telephone | |
| 29 Mar–1 Apr | 39% | 43% | 18% | 4% | 1,966 | Opinium | Online | |
| 24–29 Mar | 35% | 35% | 30% | N/A | 1,193 | TNS | Online | |
| 24–29 Mar | 41% | 45% | 14% | 4% | 1,518 | BMG Research | Online | Includes Northern Ireland |
| 24–28 Mar | 51% | 49% | N/A | 2% | 2,002 | ORB | Online | |
| 22–24 Mar | 45% | 43% | 12% | 2% | 1,970 | ICM | Online | Original poll is no longer available on ICM Unlimted |
| 19–22 Mar | 49% | 41% | 10% | 8% | 1,023 | Ipsos MORI | Telephone | |
| 17–22 Mar | 40% | 37% | 19% | 3% | 1,688 | YouGov | Online | Remainder "won't vote" |
| 18–20 Mar | 48% | 41% | 11% | 7% | 1,002 | ComRes | Telephone | |
| 18–20 Mar | 41% | 43% | 17% | 2% | 2,000 | ICM | Online | |
| 17–19 Mar | 46% | 35% | 19% | 11% | 1,006 | Survation | Telephone | Includes Northern Ireland |
| 11–14 Mar | 47% | 49% | 4% | 2% | 823 | ORB | Telephone | |
| 11–13 Mar | 43% | 41% | 16% | 2% | 2,031 | ICM | Online | |
| 4–11 Mar | 45% | 40% | 16% | 5% | 2,282 | Greenberg Quinlan Rosner Research | Online | |
| 2–10 Mar | 48% | 45% | 7% | 3% | 4,047 | Populus/Number Cruncher Politics | Online | |
| 4–6 Mar | 49% | 35% | 15% | 14% | 966 | Populus/Number Cruncher Politics | Telephone | |
| 4–6 Mar | 40% | 41% | 19% | 1% | 2,051 | ICM | Online | |
| 2–3 Mar | 40% | 37% | 18% | 3% | 1,695 | YouGov | Online | |
| 1–2 Mar | 40% | 35% | 19% | 5% | 1,705 | YouGov | Online | |
| 29 Feb–1 Mar | 39% | 37% | 19% | 2% | 2,233 | YouGov | Online | |
| 26–29 Feb | 41% | 41% | 18% | N/A | 2,003 | ICM | Online | |
| 26–28 Feb | 39% | 45% | 18% | 6% | 2,071 | Populus/Number Cruncher Politics | Online | |
| 26–28 Feb | 48% | 37% | 15% | 11% | 1,002 | Populus/Number Cruncher Politics | Telephone | |
| 24–25 Feb | 48% | 52% | N/A | 4% | 2,014 | ORB | Online | |
| 21–23 Feb | 37% | 38% | 25% | 1% | 3,482 | YouGov | Online | |
| 20 Feb | David Cameron announces the date of UK's In/Out EU referendum after an EU summit in Brussels.[33] | |||||||
| 17–23 Feb | 38% | 36% | 25% | 2% | 1,517 | BMG Research | Online | Includes Northern Ireland |
| 19–22 Feb | 42% | 40% | 17% | 2% | 2,021 | ICM | Online | |
| 19–22 Feb | 51% | 39% | 10% | 12% | 1,000 | ComRes | Telephone | |
| 13–20 Feb | 45% | 32% | 23% | 13% | 938 | Survation | Telephone | |
| 18–19 Feb | 40% | 41% | 19% | 1% | 1,033 | Opinium | Online | Conducted before the conclusion of the negotiations; exact time frame was not communicated |
| 13–16 Feb | 54% | 36% | 10% | 18% | 497 | Ipsos MORI | Telephone | |
| 11–15 Feb | 36% | 39% | 25% | 3% | 1,079 | TNS | Online | |
| 12–14 Feb | 43% | 39% | 18% | 4% | 2,001 | ICM | Online | Original poll is no longer available on ICM Unlimted |
| 11–14 Feb | 49% | 41% | 10% | 8% | 1,105 | ComRes | Telephone | |
| 5–7 Feb | 41% | 42% | 17% | 1% | 2,018 | ICM | Online | |
| 3–4 Feb | 36% | 45% | 19% | 9% | 1,675 | YouGov/The Times | Online | |
| 29–31 Jan | 42% | 39% | 19% | 3% | 2,002 | ICM | Online | |
| 27–28 Jan | 38% | 42% | 20% | 4% | 1,735 | YouGov | Online | |
| 23–25 Jan | 55% | 36% | 9% | 19% | 513 | Ipsos MORI | Telephone | |
| 21–25 Jan | 44% | 42% | 14% | 2% | 1,511 | BMG Research | Online | Includes Northern Ireland |
| 22–24 Jan | 54% | 36% | 10% | 18% | 1,006 | ComRes | Telephone | |
| 22–24 Jan | 41% | 41% | 18% | N/A | 2,010 | ICM | Online | |
| 20–21 Jan | 52% | 48% | N/A | 4% | 2,015 | ORB | Online | |
| 15–17 Jan | 42% | 40% | 17% | 2% | 2,023 | ICM | Online | |
| 15–16 Jan | 38% | 40% | 22% | 2% | 1,017 | Survation | Online | Includes Northern Ireland |
| 8–14 Jan | 42% | 45% | 12% | 3% | 2,087 | Panelbase | Online | |
| 8–10 Jan | 44% | 38% | 18% | 6% | 2,055 | ICM | Online | |
2015
| Date(s) conducted | Remain | Leave | Undecided | Sample | Conducted by | Notes | ||
|---|---|---|---|---|---|---|---|---|
| 17–18 Dec | 41% | 42% | 17% | 1,598 | YouGov | |||
| 12–14 Dec | 58% | 32% | 10% | 529 | Ipsos MORI | |||
| 11–13 Dec | 56% | 35% | 8% | 1,001 | ComRes | |||
| 11–13 Dec | 42% | 41% | 17% | 2,053 | ICM | |||
| 4–6 Dec | 43% | 39% | 17% | 2,022 | ICM | |||
| 2–3 Dec | 36% | 43% | 21% | 1,001 | ORB | |||
| 30 Nov–3 Dec | 40% | 42% | 18% | 10,015 | Survation | Includes Northern Ireland | ||
| 20–24 Nov | 41% | 41% | 18% | 4,317 | YouGov | |||
| 19–24 Nov | 40% | 38% | 22% | 1,699 | YouGov | |||
| 20–22 Nov | 45% | 38% | 17% | 2,002 | ICM | |||
| 17–19 Nov | 48% | 52% | N/A | 2,067 | ORB | |||
| 16–17 Nov | 43% | 40% | 18% | 1,546 | Survation | Includes Northern Ireland | ||
| 11–17 Nov | 39% | 39% | 22% | 1,528 | BMG Research | Includes Northern Ireland | ||
| 13–15 Nov | 43% | 38% | 19% | 2,000 | ICM | |||
| 9–11 Nov | 38% | 41% | 21% | 2,007 | Survation | Includes Northern Ireland | ||
| 6–8 Nov | 46% | 38% | 16% | 2,024 | ICM | |||
| 30 Oct–1 Nov | 44% | 38% | 18% | 2,060 | ICM | |||
| 28–29 Oct | 39% | 41% | 19% | 1,664 | YouGov | |||
| 22–27 Oct | 40% | 40% | 20% | 1,738 | YouGov | |||
| 23–25 Oct | 45% | 38% | 17% | 2,049 | ICM | |||
| 23–25 Oct | 53% | 47% | N/A | 2,015 | ORB | |||
| 22–23 Oct | 42% | 39% | 16% | 1,625 | YouGov | |||
| 19–20 Oct | 42% | 40% | 17% | 1,690 | YouGov | |||
| 17–19 Oct | 52% | 36% | 12% | 498 | Ipsos MORI | |||
| 14–19 Oct | 42% | 39% | 19% | 2,372 | GQRR | |||
| 16–18 Oct | 44% | 38% | 18% | 2,023 | ICM | |||
| 7 Oct | 44% | 39% | 17% | 1,947 | ICM | |||
| 25–28 Sep | 55% | 36% | 8% | 1,009 | ComRes | |||
| 25–27 Sep | 45% | 38% | 17% | 2,005 | ICM | |||
| 17–22 Sep | 38% | 41% | 21% | 2,781 | YouGov | |||
| 10–17 Sep | 38% | 40% | 22% | 11,171 | YouGov | |||
| 11–13 Sep | 43% | 40% | 17% | 2,006 | ICM | |||
| 12 Sep | Jeremy Corbyn is elected leader of the Labour Party | |||||||
| 3–4 Sep | 40% | 40% | 20% | 1,004 | Survation | |||
| 18–19 Aug | 44% | 37% | 20% | 1,676 | YouGov | |||
| 13–17 Aug | 50% | 40% | 10% | 3,402 | YouGov | |||
| 23–29 Jul | 45% | 37% | 19% | 1,708 | YouGov | |||
| 16 Jul | Tim Farron is elected leader of the Liberal Democrats | |||||||
| 29 Jun–6 Jul | 45% | 37% | 18% | 5,008 | Survation | Includes Northern Ireland | ||
| 19–24 Jun | 44% | 38% | 18% | 1,653 | YouGov | |||
| 19–21 Jun | 55% | 45% | N/A | 2,000 | ORB | |||
| 14–16 Jun | 66% | 22% | 12% | 501 | Ipsos MORI | |||
| 8–11 Jun | 43% | 36% | 21% | 2,381 | YouGov | |||
| 1–2 Jun | 44% | 34% | 21% | 1,063 | YouGov | |||
| 27 May–2 Jun | 42% | 35% | 22% | 2,956 | YouGov | |||
| 29–31 May | 58% | 31% | 11% | 500 | ComRes | |||
| 28–31 May | 47% | 33% | 20% | 680 | ICM | |||
| 21–22 May | 44% | 36% | 20% | 1,532 | YouGov | |||
| 8–15 May | 47% | 40% | 13% | 3,977 | Survation | |||
| 7 Apr–13 May | 55% | 36% | 9% | 999 | Pew Research Center | |||
| 8–9 May | 45% | 36% | 19% | 1,302 | YouGov | |||
| 8–9 May | 45% | 38% | 18% | 1,027 | Survation | |||
| 7 May | United Kingdom general election, 2015 | |||||||
| 3–5 May | 56% | 34% | 10% | 1,011 | ComRes | |||
| 3–4 May | 45% | 33% | 21% | 1,664 | YouGov | |||
| 28–29 Apr | 52% | 32% | 16% | 1,823 | YouGov | |||
| 23–28 Apr | 47% | 33% | 20% | 1,834 | YouGov | |||
| 19–20 Apr | 45% | 35% | 20% | 2,078 | YouGov | |||
| 10–12 Apr | 40% | 39% | 21% | 2,036 | Populus | |||
| 8–9 Apr | 45% | 41% | 15% | 1,750 | Opinium | |||
| 26–30 Mar | 35% | 34% | 31% | 1,197 | TNS-BMRB | |||
| 24–26 Mar | 49% | 44% | 7% | 1,007 | Panelbase | Includes Northern Ireland | ||
| 18–25 Mar | 41% | 38% | 21% | 2,006 | YouGov | |||
| 22–23 Mar | 46% | 36% | 18% | 1,641 | YouGov | |||
| 18–23 Mar | 42% | 34% | 23% | 8,271 | YouGov | |||
| 23–24 Feb | 45% | 37% | 18% | 1,520 | YouGov | |||
| 22–23 Feb | 45% | 35% | 20% | 1,772 | YouGov | |||
| 17–20 Feb | 41% | 44% | 15% | 1,975 | Opinium | |||
| 25–26 Jan | 43% | 37% | 20% | 1,656 | YouGov | |||
| 18–19 Jan | 43% | 38% | 18% | 1,747 | YouGov | |||
| 15–19 Jan | 38% | 34% | 28% | 1,188 | TNS-BMRB | |||
| 6–8 Jan | 37% | 40% | 23% | 1,201 | TNS-BMRB | |||
2014
| Date(s) conducted | Remain | Leave | Undecided | Sample | Conducted by | Notes | ||
|---|---|---|---|---|---|---|---|---|
| 14–15 Dec | 40% | 39% | 21% | 1,648 | YouGov | |||
| 30 Nov–1 Dec | 42% | 39% | 20% | 1,763 | YouGov | |||
| 20–26 Nov | 38% | 43% | 19% | 1,641 | YouGov | |||
| 21–23 Nov | 32% | 48% | 20% | 2,049 | ComRes | |||
| 20–21 Nov | 40% | 41% | 19% | 1,970 | YouGov | |||
| 19–21 Nov | 40% | 41% | 19% | 2,314 | YouGov | |||
| 16–17 Nov | 39% | 39% | 21% | 1,589 | YouGov | |||
| 7 Nov | 31% | 54% | 15% | 1,020 | Survation | |||
| 2–3 Nov | 38% | 41% | 21% | 1,652 | YouGov | |||
| 31 Oct–2 Nov | 35% | 49% | 17% | 2,012 | Survation | |||
| 30–31 Oct | 37% | 43% | 20% | 1,808 | YouGov | |||
| 27–28 Oct | 35% | 44% | 21% | 2,052 | YouGov | |||
| 23–24 Oct | 41% | 40% | 19% | 2,069 | YouGov | |||
| 19–20 Oct | 40% | 39% | 21% | 1,727 | YouGov | |||
| 11–14 Oct | 56% | 36% | 8% | 1,002 | Ipsos MORI | |||
| 21–22 Sep | 42% | 38% | 19% | 1,671 | YouGov | |||
| 18 Sep | Scottish independence referendum, 2014 | |||||||
| 25–26 Aug | 41% | 40% | 19% | 2,021 | YouGov | |||
| 10–11 Aug | 40% | 38% | 22% | 1,676 | YouGov | |||
| 13–14 Jul | 41% | 38% | 21% | 1,745 | YouGov | |||
| 29–30 Jun | 40% | 39% | 21% | 1,729 | YouGov | |||
| 27–29 Jun | 36% | 43% | 21% | 2,049 | ComRes | |||
| 27–28 Jun | 39% | 47% | 14% | 1,000 | Survation | |||
| 26–27 Jun | 39% | 37% | 24% | 1,936 | YouGov | |||
| 19–20 Jun | 39% | 39% | 21% | 2,016 | YouGov | |||
| 17–19 Jun | 37% | 48% | 15% | 1,946 | Opinium | |||
| 15–16 Jun | 44% | 36% | 20% | 1,696 | YouGov | |||
| 30 May–1 Jun | 40% | 42% | 18% | 2,062 | ComRes | |||
| 29–30 May | 41% | 39% | 20% | 2,090 | YouGov | |||
| 22 May | European Parliament election, 2014 | |||||||
| 20–21 May | 42% | 37% | 21% | 6,124 | YouGov | |||
| 18–19 May | 43% | 37% | 20% | 1,740 | YouGov | |||
| 10–12 May | 54% | 37% | 10% | 1,003 | Ipsos MORI | |||
| 28 Apr–6 May | 39% | 38% | 23% | 1,805 | YouGov | |||
| 2–3 May | 39% | 46% | 15% | 1,005 | Survation | |||
| 24–28 Apr | 41% | 49% | 10% | 1,199 | TNS-BMRB | |||
| 24–25 Apr | 40% | 37% | 23% | 1,835 | YouGov | |||
| 21–22 Apr | 40% | 38% | 23% | 2,190 | YouGov | |||
| 3–4 Apr | 42% | 37% | 21% | 1,998 | YouGov | |||
| 27–28 Mar | 42% | 36% | 21% | 1,916 | YouGov | |||
| 23–24 Mar | 42% | 36% | 22% | 1,558 | YouGov | |||
| 9–10 Mar | 41% | 39% | 20% | 3,195 | YouGov | |||
| 9–10 Feb | 36% | 39% | 25% | 1,685 | YouGov | |||
| 7–20 Jan | 41% | 41% | 18% | 20,058 | Lord Ashcroft Polls | |||
| 12–13 Jan | 33% | 43% | 24% | 1,762 | YouGov | |||
2013
| Date(s) conducted | Remain | Leave | Undecided | Sample | Conducted by | Notes |
|---|---|---|---|---|---|---|
| 1–9 Dec | 37% | 43% | 20% | Unknown | YouGov | |
| 10–11 Nov | 39% | 39% | 22% | Unknown | YouGov[34] | |
| 13–14 Oct | 42% | 37% | 20% | Unknown | YouGov[34] | |
| 23–27 Sep | 36% | 44% | 20% | 1,922 | YouGov | |
| 15–16 Sep | 42% | 39% | 20% | Unknown | YouGov[34] | |
| 18–19 Aug | 46% | 34% | 20% | Unknown | YouGov[34] | |
| 6–8 Aug | 32% | 53% | 15% | 1,945 | Opinium | |
| 4–5 Aug | 43% | 35% | 22% | Unknown | YouGov[34] | |
| 18–24 Jul | 35% | 45% | 21% | 1,968 | YouGov | |
| 22–23 Jul | 45% | 35% | 21% | Unknown | YouGov[34] | |
| 7–8 Jul | 43% | 36% | 21% | Unknown | YouGov[34] | |
| 4–5 Jul | 36% | 46% | 19% | 1,022 | YouGov | |
| 23–24 Jun | 45% | 31% | 24% | Unknown | YouGov[34] | |
| 9–10 Jun | 43% | 35% | 22% | Unknown | YouGov[34] | |
| 1–3 Jun | 44% | 45% | 11% | 1,566 | Survation | |
| 28–29 May | 43% | 35% | 22% | Unknown | YouGov[34] | |
| 21–28 May | 41% | 38% | 20% | 1,512 | YouGov | |
| 17–18 May | 36% | 50% | 14% | 1,000 | Survation | |
| 16–17 May | 36% | 45% | 19% | 1,809 | YouGov | |
| 15–16 May | 24% | 46% | 30% | 2,017 | ComRes/Sunday Mirror/Independent | Northern Ireland not sampled |
| 15–16 May | 30% | 46% | 24% | 2,017 | ICM/The Telegraph | |
| 12–13 May | 34% | 44% | 22% | 1,748 | YouGov/The Sun | Northern Ireland not sampled |
| 10–12 May | 40% | 43% | 17% | 1,001 | ICM/The Guardian | |
| 9–10 May | 30% | 47% | 23% | 1,945 | YouGov/The Sun | Northern Ireland not sampled |
| 7 May | 35% | 46% | 20% | 719 | YouGov/The Times | Northern Ireland not sampled |
| 7–8 April | 36% | 43% | 21% | 1,765 | YouGov/The Sun | Northern Ireland not sampled |
| 4–27 March | 46% | 46% | 8% | 1,012 | Pew Research Center | Includes Northern Ireland |
| 17–18 February | 38% | 41% | 21% | 1,713 | YouGov/The Sun | Northern Ireland not sampled |
| 5 February | 30% | 41% | 22% | 1,237 | TNS BMRB | |
| 29 Jan – 6 Feb | 33% | 50% | 17% | 2,114 | Financial Times/Harris | |
| 25 January | 36% | 50% | 16% | 1,005 | Survation/Mail on Sunday | Northern Ireland not sampled |
| 24–25 January | 37% | 39% | 24% | 1,943 | YouGov/Sunday Times | Northern Ireland not sampled |
| 23 January | 37% | 40% | 23% | 2,000 | Populus/The Times | |
| 20–21 January | 37% | 40% | 24% | Unknown | YouGov/The Sun | Northern Ireland not sampled |
| 17–18 January | 34% | 25% | 40% | 1,912 | YouGov/Sunday Times | Northern Ireland not sampled |
| 10–11 January | 36% | 42% | 21% | 1,995 | YouGov/Sunday Times | Northern Ireland not sampled |
| 6 January | 36% | 54% | 10% | 1,002 | Survation/Mail on Sunday | Northern Ireland not sampled |
| 2–3 January | 31% | 46% | 22% | Unknown | YouGov/The Sun | Northern Ireland not sampled |
2012
| Date(s) conducted | Remain | Leave | Undecided | Sample | Conducted by | Notes |
|---|---|---|---|---|---|---|
| 27–28 November | 30% | 51% | 9% | Unknown | YouGov/The Sun | Northern Ireland not sampled |
| 13–15 November | 30% | 56% | 14% | 1,957 | Opinium/Observer | Northern Ireland not sampled |
2011
| Date(s) conducted | Remain | Leave | Undecided | Sample | Conducted by | Notes |
|---|---|---|---|---|---|---|
| 15–16 December | 41% | 41% | 19% | Unknown | YouGov/The Sun | Northern Ireland not sampled |
| 8–9 December | 35% | 44% | 20% | Unknown | YouGov/The Sun | Northern Ireland not sampled |
| 7–8 August | 30% | 52% | 19% | Unknown | YouGov/The Sun | Northern Ireland not sampled |
2010
| Date(s) conducted | Remain | Leave | Undecided | Sample | Conducted by | Notes |
|---|---|---|---|---|---|---|
| 8–9 September | 33% | 47% | 19% | Unknown | YouGov/The Sun | Northern Ireland not sampled |
Sub-national polling
England
| Date(s) conducted | Remain | Leave | Unsure | Sample | Held by |
|---|---|---|---|---|---|
| 23 June 2016 | 46.6% | 53.4% | N/A | 28,455,402 | England Results |
| 9–16 September 2015 | 40% | 43% | 17% | 1,712 | YouGov |
England and Wales
| Date(s) conducted | Remain | Leave | Unsure | Sample | Held by |
|---|---|---|---|---|---|
| 23 June 2016 | 46.7% | 53.3% | N/A | 30,082,121 | Results |
| 26 June – 3 July 2015 | 42% | 43% | 15% | 956 | Panelbase/Sunday Times |
London
| Date(s) conducted | Remain | Leave | Unsure | Sample | Held by |
|---|---|---|---|---|---|
| 23 June 2016 | 59.9% | 40.1% | N/A | 3,776,751 | London Results |
| 2–6 June 2016 | 48% | 35% | 13% | 1,179 | YouGov |
| 26 April – 1 May 2016 | 51% | 34% | 14% | 1,005 | Opinium/Evening Standard |
| 4–6 January 2016 | 39% | 34% | 27% | 1,156 | YouGov/LBC |
| 17–19 November 2014 | 45% | 37% | 14% | 1,124 | YouGov/Evening Standard |
| 20–25 June 2013 | 41% | 39% | 20% | 1,269 | YouGov/Evening Standard |
Scotland
| Date(s) conducted | Remain | Leave | Unsure | Sample | Held by |
|---|---|---|---|---|---|
| 23 June 2016 | 62.0% | 38.0% | N/A | 2,679,513 | Scotland Results |
| 6–12 Jun 2016 | 58% | 33% | 8% | 1,000 | Ipsos Mori/STV |
| 4–22 May 2016 | 53% | 24% | 23% | 1,008 | TNS |
| 6–10 May 2016 | 54% | 32% | 14% | 1,000 | ICM/The Scotsman |
| 1–2 May 2016 | 58% | 19% | 19% | 1,024 | Survation/Daily Record |
| 23–28 April 2016 | 57% | 33% | 11% | 1,074 | Panelbase/Sunday Times |
| 18–25 April 2016 | 66% | 29% | 5% | 1,015 | Ipsos MORI/STV |
| 1–24 April 2016 | 48% | 21% | 31% | 1,012 | TNS |
| 15–20 April 2016 | 54% | 28% | 17% | 1,005 | Survation/Daily Record |
| 11–15 April 2016 | 55% | 35% | 9% | 1,013 | BMG Research/Herald |
| 6–15 April 2016 | 55% | 33% | 12% | 1,021 | Panelbase/Sunday Times |
| 2–22 March 2016 | 51% | 19% | 29% | 1,051 | TNS |
| 10–17 March 2016 | 53% | 29% | 17% | 1,051 | Survation/Daily Record |
| 7–9 March 2016 | 48% | 31% | 21% | 1,070 | YouGov |
| 11–16 February 2016 | 52% | 27% | 21% | 951 | Survation |
| 1–7 February 2016 | 62% | 26% | 12% | 1,000 | Ipsos MORI |
| 1–4 February 2016 | 55% | 28% | 18% | 1,022 | YouGov/The Times |
| 6–25 January 2016 | 44% | 21% | 29% | 1,016 | TNS |
| 8–14 January 2016 | 54% | 30% | 16% | 1,053 | Panelbase/Sunday Times |
| 8–12 January 2016 | 52% | 27% | 21% | 1,029 | Survation/Daily Record |
| 9–16 November 2015 | 65% | 22% | 13% | 1,029 | Ipsos MORI |
| 9–13 October 2015 | 51% | 31% | 17% | 1,026 | YouGov/Times |
| 9–30 September 2015 | 47% | 18% | 29% | 1,037 | TNS |
| 22–27 September 2015 | 55% | 30% | 15% | 1,004 | YouGov |
| 7–10 September 2015 | 51% | 29% | 20% | 975 | Survation/Scottish Daily Mail |
| 26 June – 3 July 2015 | 55% | 29% | 16% | 1,002 | Panelbase/Sunday Times |
| 3–7 July 2015 | 51% | 26% | 23% | 1,045 | Survation/Scottish Daily Mail |
| 13–30 May 2015 | 49% | 19% | 26% | 1,031 | TNS BMRB |
| 19–21 May 2015 | 54% | 25% | 21% | 1,001 | YouGov/Sunday Post |
| 29 January – 2 February 2015 | 52% | 29% | 17% | 1,001 | YouGov/The Times |
| 9–14 January 2015 | 42% | 37% | 21% | 1,007 | Panelbase/Wings Over Scotland |
| 6–13 November 2014 | 47% | 35% | 18% | 1,001 | Survation/Daily Record |
| 30 October − 5 November 2014 | 41% | 38% | 19% | 1,000 | Panelbase/Wings Over Scotland |
| 4–9 February 2013 | 54% | 33% | 13% | 1,003 | Ipsos MORI/The Times |
Wales
| Date(s) conducted | Remain | Leave | Unsure | Sample | Held by |
|---|---|---|---|---|---|
| 23 June 2016 | 47.5% | 52.5% | N/A | 1,626,719 | Wales Results |
| 30 May – 2 June 2016 | 41% | 41% | 18% | 1,017 | YouGov |
| 7–11 April 2016 | 38% | 39% | 16% | 1,011 | YouGov |
| 9–11 February 2016 | 37% | 45% | 18% | 1,024 | YouGov |
| 21–24 September 2015 | 42% | 38% | 21% | 1,010 | YouGov |
| 4–6 May 2015 | 47% | 33% | 16% | 1,202 | YouGov/ITV Wales |
| 24–27 March 2015 | 44% | 38% | 14% | 1,189 | YouGov/ITV Wales |
| 5–9 March 2015 | 43% | 36% | 17% | 1,279 | YouGov/ITV Wales |
| 19–26 February 2015 | 63% | 33% | 4% | 1,000 | ICM/BBC |
| 19–21 January 2015 | 44% | 36% | 16% | 1,036 | YouGov/ITV Wales |
| 2–5 December 2014 | 42% | 39% | 15% | 1,131 | YouGov/ITV Wales |
| 8–11 September 2014 | 43% | 37% | 15% | 1,025 | YouGov/ITV Wales |
| 26 June – 1 July 2014 | 41% | 36% | 18% | 1,035 | YouGov/ITV Wales |
| 21–24 February 2014 | 54% | 40% | 6% | 1,000 | ICM/BBC |
| 14–25 June 2013 | 29% | 37% | 35% | 1,015 | Beaufort Research |
Northern Ireland
| Date(s) conducted | Remain | Leave | Unsure | Sample | Held by | Notes |
|---|---|---|---|---|---|---|
| 23 June 2016 | 55.8% | 44.2% | N/A | 790,149 | Northern Ireland Results | |
| Late June 2016 | 37% | 26% | NA | Over 1,000 | Belfast Telegraph / IPSOS MORI | |
| 17–19 May 2016 | 57% | 35% | 9% | 1,090 | Lucid Talk | |
| May 2016 | 44% | 20% | 35% | 1,005 | Ipsos MORI | Question phrased differently. |
| 19–21 October 2015 | 56.5% | 28.3% | 15.2% | 2,517 | Lucid Talk | |
| 2–16 October 2015 | 55% | 13% | 32% | 1,012 | BBC/RTÉ |
Gibraltar
| Date(s) conducted | Remain | Leave | Unsure | Sample | Held by |
|---|---|---|---|---|---|
| 23 June 2016 | 95.9% | 4.1% | N/A | 20,145 | Gibraltar Results |
| 13–15 May 2016 | 94% | 2% | 4% | 596 | Gibraltar Chronicle |
| 11–15 April 2016 | 88% | 8% | 3% | 596 | Gibraltar Chronicle |
Renegotiated terms
The UK government renegotiated certain terms of the UK's membership of the European Union before the referendum was held.[35] Prior to the renegotiation in February 2016, some opinion polls asked the referendum question on the assumption that the UK government would say that it was satisfied with the outcome of the renegotiation.[36]
| Date(s) conducted | Remain | Leave | Unsure | Sample | Held by | Notes |
|---|---|---|---|---|---|---|
| 1–2 June 2015 | 55% | 24% | 18% | 1,063 | YouGov/Prospect | Northern Ireland not sampled |
| 8–9 May 2015 | 58% | 24% | 16% | 1,302 | YouGov/Sunday Times | Northern Ireland not sampled |
| 3–4 May 2015 | 56% | 20% | 20% | 1,664 | YouGov/The Sun | Northern Ireland not sampled |
| 19–20 April 2015 | 57% | 22% | 17% | 2,078 | YouGov/The Sun | Northern Ireland not sampled |
| 22–23 March 2015 | 57% | 22% | 18% | 1,641 | YouGov/The Sun | Northern Ireland not sampled |
| 22–23 February 2015 | 57% | 21% | 17% | 1,772 | YouGov/The Sun | Northern Ireland not sampled |
| 25–26 January 2015 | 54% | 25% | 16% | 1,656 | YouGov/The Sun | Northern Ireland not sampled |
| 18–19 January 2015 | 57% | 21% | 19% | 1,747 | YouGov/British Influence | Northern Ireland not sampled |
| 14–15 Dec 2014 | 55% | 24% | 16% | 1,648 | YouGov/The Sun | |
| 30 Nov – 1 December 2014 | 55% | 25% | 17% | 1,763 | YouGov/The Sun | |
| 17–19 November 2014 | 58% | 25% | 13% | 1,124 | YouGov / The Evening Standard | |
| 16–17 November 2014 | 58% | 24% | 14% | 1,589 | YouGov / The Sun | |
| 4–7 November 2014 | 40% | 43% | 17% | 1,707 | Opinium/The Observer | |
| 2–3 November 2014 | 52% | 27% | 15% | 1,652 | YouGov / The Sun | |
| 19–20 October 2014 | 55% | 24% | 17% | 1,727 | YouGov / The Sun | |
| 21–22 September 2014 | 54% | 25% | 16% | 1,671 | YouGov / The Sun | |
| 25–26 August 2014 | 54% | 26% | 16% | 2,021 | YouGov / The Sun | |
| 10–11 August 2014 | 54% | 23% | 18% | 1,676 | YouGov / The Sun | |
| 13–14 July 2014 | 52% | 25% | 19% | 1,745 | YouGov / The Sun | |
| 29–30 June 2014 | 54% | 23% | 17% | 1,729 | YouGov / The Sun | |
| 15–16 June 2014 | 57% | 22% | 16% | 1,696 | YouGov / The Sun | |
| 18–19 May 2014 | 53% | 24% | 18% | 1,740 | YouGov | Northern Ireland not sampled |
| 24–25 April 2014 | 50% | 26% | 18% | 1,835 | YouGov/Sunday Times | Northern Ireland not sampled |
| 21–22 April 2014 | 52% | 26% | 18% | 2,190 | YouGov/The Sun | Northern Ireland not sampled |
| 23–24 March 2014 | 54% | 25% | 17% | 2,190 | YouGov/The Sun | Northern Ireland not sampled |
| 9–10 March 2014 | 52% | 27% | 16% | 3,195 | YouGov/The Sun | Northern Ireland not sampled |
| 9–10 February 2014 | 47% | 27% | 18% | 1,685 | YouGov/The Sun | Northern Ireland not sampled |
| 12–13 January 2014 | 48% | 29% | 18% | 1,762 | YouGov/The Sun | Northern Ireland not sampled |
| 12–13 May 2013 | 45% | 33% | 19% | 1,748 | YouGov/The Sun | Northern Ireland not sampled |
| 9–10 May 2013 | 45% | 32% | 20% | 1,945 | YouGov/Sunday Times | Northern Ireland not sampled |
| 7–8 April 2013 | 46% | 31% | 17% | 1,765 | YouGov/The Sun | Northern Ireland not sampled |
| 17–18 February 2013 | 52% | 28% | 14% | 1,713 | YouGov/The Sun | Northern Ireland not sampled |
Polling within professional groups
Business leaders
The British Chambers of Commerce surveyed 2,200 business leaders in January and February 2016. Of these, 60% supported remaining in the EU and 30% supported exit. In a further poll published in May, these numbers had changed to 54% and 37% respectively.[37][38]
The Confederation of British Industry reported a survey of 773 of its members, carried out by ComRes. With numbers adjusted to reflect CBI membership, the poll indicated that 80% of CBI members saw a "remain" outcome as the best outcome for their business, with 5% seeing "leave" as the best outcome.[39][40][41]
In a poll of 350 board directors of UK businesses, published in June 2015, 82% agreed with the statement that "the UK's membership of the EU is good for British businesses", while 12% disagreed.[42][43] In a follow-up poll reported in March 2016, 63% agreed that "British businesses are better off inside the European Union than out of it" while 20% disagreed.[43][44] To the statement, "An EU exit risks stifling British business growth," 59% agreed and 30% disagreed. To the statement, "Our membership of the EU gives British businesses invaluable access to European markets," 71% agreed and 16% disagreed. Thirty-five per cent agreed that "An EU exit would leave British businesses facing a skills shortage" while 50% disagreed.[44]
The manufacturers' organisation EEF used the market research organisation GfK to conduct a survey in late 2015 of 500 senior decision-makers in manufacturing organisations. Of these, 63% wanted the UK to stay in the EU, and 5% wanted it to leave. Three percent said there was no advantage to their businesses for the UK to be in the EU, against 50% who said it was important and a further 20% who said it was critical for their business.[45][46]
Two surveys by consultants Deloitte asked 120 Chief Financial Officers of large UK companies "whether it is in the interests of UK businesses for the UK to remain a member of the EU." In the first survey, in the final quarter of 2015, 62% agreed while 6% disagreed. A further 28% said they would withhold their judgement until the renegotiation in February 2016. The second survey, in early 2016, had 75% saying it was in the interest of UK businesses to remain, with 8% saying it was not.[47][48]
In April 2016, the International Chamber of Commerce published a survey of 226 businesses from 27 different countries. Of these international businesses, 46% said they would reduce investment in the UK if it left the EU, while 1% said Brexit would increase their investment in the UK. As to whether the UK should leave the EU, 8% thought it should, while 86% wanted the UK to remain.[49][50][51]
In May 2016, law firm King & Wood Mallesons published a survey of 300 businesses, equally split between France, Spain, Italy, and Germany. Asked about the prospect of the UK leaving the EU, 68% said it would adversely affect their businesses and 62% said they would be less likely to do business in the UK. When asked to name ways in which their businesses could benefit from Brexit, a majority of respondents in France, Italy, and Spain said that their countries could benefit as companies move jobs out of the UK.[52][53]
Scientists
In March 2016, Nature reported a survey of 907 active science researchers based in the UK. Of these, 78% said exit from the EU would be "somewhat harmful" or "very harmful" for UK science, with 9% saying it would be "somewhat beneficial" or "very beneficial". Asked, "Should the UK exit the EU or remain?" 83% chose "remain" and 12% "exit".[54] The journal also surveyed a further 954 scientists based in the EU but outside the UK. Of these, 47% said the UK's exit would be "harmful" or "very harmful" for science in the EU, with 11.5% choosing "beneficial" or "very beneficial".[54]
Lawyers
Legal Week surveyed almost 350 partners in legal firms. Of these, 77% said that a UK exit from the EU would have a "negative" or "very negative" effect on the City's position in global financial markets, with 6.2% predicting a "positive" effect. Asked about the effect on their own firms, 59% of the partners predicted a "quite adverse" or "very adverse" effect, while 13% said the effect would be "quite positive" or "very positive".[55]
Economists
The Financial Times surveyed 105 economists about how an exit from the EU would affect their views of the UK's prospects, publishing the results in January 2016. In the medium term, 76 respondents (72%) said the UK's prospects would be worse, 8 (7.6%) said they would be better, and 18 (17%) predicted no difference.[56]
Ipsos MORI surveyed members of the Royal Economic Society and the Society of Business Economists for The Observer, with 639 responses. Over the next five years, 88% said that Brexit would have a negative effect on GDP, 7% said it would have no impact, and 3% said there would it would have a positive impact, while 82% said it would have a negative effect on household incomes, 9% said it would have no impact, and 7% said it would have a positive effect. Over ten to twenty years, 72% said it would have a negative effect on GDP, 11% said it would have no impact and 11% said it would have a positive effect, while 73% said it would have a negative effect on household income, 13% said it would have no impact, and 10% said it would have a positive effect.[57][58]
Other opinion polling
In a poll released in December 2015, Lord Ashcroft asked 20,000 people in the UK to place themselves on a scale of 0–100 of how likely they were vote to remain or leave. A total of 47% placed themselves in the "leave" end of the scale, 38% in the "remain" end and 14% were completely undecided.[59][60]
On British withdrawal
 France – A poll conducted by French daily newspaper Le Parisien in January 2013 found that 52% of French voters were in favour of the UK withdrawing from the EU.[61] Of the 1,136 people polled, in conjunction with French research agency BVA in January 2013, 48% said they would rather the UK remained inside the EU.[62]
 Germany – A study carried out by Internationale Politik in January 2013 found 64% of Germans favoured Britain remaining inside the EU – with 36% saying they favoured an exit. The biggest support for retaining the union with the UK was with the younger generation with 69% of 18- to 25-year-olds saying they wanted the UK to stay. Amongst the German political parties, the supporters of the Green Party remained most favourable at 85%.[63]
Ashcroft polling
In early 2016, Lord Ashcroft polled individuals in each of the other European Union member states to gauge opinion on whether they thought the United Kingdom should leave the EU, whether they thought the UK should remain a member or whether they believed it didn't matter. All member states said that they wanted the UK to remain a member, except Cyprus, the Czech Republic and Slovenia, with Lithuania being most in favour, at 78% voting for the UK to remain in the EU.[64]
| Country | Remain | Doesn't matter | Leave |
|---|---|---|---|
| | 41% | 41% | 19% |
| | 49% | 38% | 13% |
| | 67% | 27% | 7% |
| | 49% | 41% | 10% |
| | 35% | 45% | 19% |
| | 40% | 47% | 13% |
| | 56% | 31% | 13% |
| | 65% | 28% | 8% |
| | 50% | 39% | 11% |
| | 50% | 32% | 18% |
| | 59% | 30% | 11% |
| | 50% | 35% | 15% |
| | 64% | 30% | 7% |
| | 72% | 18% | 10% |
| | 67% | 24% | 9% |
| | 58% | 33% | 9% |
| | 78% | 16% | 6% |
| | 55% | 21% | 24% |
| | 76% | 18% | 6% |
| | 49% | 42% | 10% |
| | 67% | 27% | 6% |
| | 74% | 20% | 7% |
| | 70% | 26% | 4% |
| | 61% | 32% | 7% |
| | 43% | 49% | 8% |
| | 70% | 24% | 6% |
| | 56% | 33% | 12% |
| | 60% | 30% | 10% |
Additionally, Ashcroft asked the same group of people whether they would be happy for Britain to remain in the European Union to renegotiated terms or whether they thought the UK should leave if they don't like their current terms of membership. Newer countries to the European Union, countries which have joined the Union since 2004, were the biggest supporters: 52% supported the renegotiated position, compared to just 40% of respondents from EU members who joined before 2004.[64]
| Country | Remain | Leave |
|---|---|---|
| | 24% | 76% |
| | 34% | 66% |
| | 52% | 48% |
| | 36% | 64% |
| | 33% | 67% |
| | 42% | 58% |
| | 51% | 49% |
| | 44% | 56% |
| | 30% | 70% |
| | 36% | 64% |
| | 35% | 65% |
| | 39% | 61% |
| | 61% | 39% |
| | 54% | 46% |
| | 50% | 50% |
| | 49% | 51% |
| | 64% | 36% |
| | 26% | 74% |
| | 69% | 31% |
| | 37% | 63% |
| | 52% | 48% |
| | 61% | 39% |
| | 59% | 41% |
| | 47% | 53% |
| | 29% | 71% |
| | 43% | 57% |
| | 37% | 63% |
| | 43% | 57% |
ICM polling
An ICM online poll of 1,000 adults in each of nine European countries in November 2015 found an average of 53% in favour of the UK's remaining in the EU.[65]
| Country | Remain | Leave |
|---|---|---|
| | 46% | 24% |
| | 49% | 19% |
| | 51% | 22% |
| | 55% | 19% |
| | 63% | 20% |
| | 34% | 27% |
| | 74% | 8% |
| | 69% | 11% |
| | 43% | 26% |
On the possible withdrawal of other countries
 Denmark – A poll commissioned in January 2013 following David Cameron's EU referendum speech found that 52% of Danes would still want their country to stay within the EU even if the UK voted to withdraw. However, 47% said they would like the Danish Government to attempt to renegotiate improved terms of their membership.[66][67]
 Ireland – A Red C poll, commissioned by European Movement Ireland in January 2013, found most Irish people would opt for Ireland to remain inside the EU – 66% – even if the UK decided to leave. Just 29% of those asked said that Ireland should leave if the UK does.[68]
See also
References
- ↑ Toby Helm (2 April 2016). "EU referendum: poll shows young voters could hold key in June vote". The Guardian. Retrieved 15 May 2016.
- ↑ John Curtice, Senior Research Fellow at NatCen and Professor of Politics at Strathclyde University (October 2015). "Britain divided? Who supports and who opposes EU membership" (PDF). Economic and Social Research Council.
- ↑ Charlie Cooper (18 May 2016). "EU referendum outcome on a knife edge, according to latest survey". Independent. Retrieved 18 May 2016.
- ↑ Nick Eardley (18 February 2016). "Is Scotland the most pro-EU part of the UK?". BBC News. Retrieved 20 May 2016.
- ↑ Cook, Chris (30 March 2016). "How to read the EU referendum opinion polls". BBC News. Retrieved 2016-05-14.
- ↑ Andy Morris (20 May 2016). "Revealed: new evidence reveals greater skews in phone polls". YouGov. Retrieved 21 May 2016.
- ↑ Jim Pickard; Kiran Stacey; Gavin Jackson (28 April 2015). "Pollsters disagree on who is ahead in UK general election race". Financial Times. Retrieved 17 May 2016.
- ↑ Peter Kellner (20 May 2016). "EU referendum: "remain" on course for clear victory". The Politics Counter. Retrieved 21 May 2016.
- ↑ "EU referendum: All still to play for but not neck and neck". ComRes. 16 December 2015. Retrieved 21 May 2016.
- ↑ Tom Clark (16 May 2016). "Phone survey finds 10-point lead for remain but web poll puts leave ahead". Retrieved 17 May 2016.
- ↑ Matt Singh; James Kanagasooriam (29 March 2016). "Polls apart". Populus. Retrieved 17 May 2016.
- ↑ Natalie Jackson (24 June 2016). "How Brexit Polls Missed The 'Leave' Victory". The Huffington Post.
- ↑ "EU Referendum Poll of Polls". What UK Thinks: EU. 23 June 2016. Retrieved 23 June 2016.
- ↑ Stephen Fisher; Alan Renwick (23 June 2016). "Final combined EU Referendum forecast". Elections Etc. Retrieved 23 June 2016.
- ↑ "UK European Union Referendum". The Huffington Post. Retrieved 23 June 2016.
- ↑ Matt Singh (22 June 2016). "UK EU referendum". Number Cruncher Politics. Archived from the original on 22 June 2016. Retrieved 23 June 2016.
- ↑ "Brexit poll tracker". Financial Times. 13 June 2016. Retrieved 22 June 2016.
- ↑ John Burn-Murdoch (9 June 2016). "How accurate are the Brexit polls?". Financial Times. Retrieved 9 June 2016.
- ↑ "EU referendum poll latest tracker and odds". The Telegraph. 21 June 2016. Retrieved 21 June 2016.
- ↑ "The Economist's Brexit poll tracker". The Economist. 6 June 2016. Retrieved 17 June 2016.
- 1 2 "Northern Irish poll on the EU referendum". ukpollingreport.co.uk. 6 November 2015. Retrieved 11 November 2015.
- ↑ Tom Ashford (8 August 2014). "Understanding and Sourcing Political Opinion Polls" (PDF). House of Lords Library. Retrieved 18 June 2016.
- ↑ "Officers / Members". British Polling Council. Retrieved 18 June 2016.
- ↑ "Polls, Damn Polls and Statistics". Full Fact. 6 May 2015. Retrieved 18 June 2016.
- ↑ "EU referendum campaigns suspended until Sunday after Jo Cox attack". BBC News. 17 June 2016. Retrieved 17 June 2016.
- ↑ "Martin Boon on Twitter". Twitter. Retrieved 2016-06-14.
- ↑ ""Remain" has a knife-edge lead as Britain enters the final three weeks of the campaign". Opinium Research. 3 June 2016. Retrieved 5 June 2016.
- ↑ Daniel Boffey (5 June 2016). "Poll gives Brexit campaign lead of three percentage points". The Guardian. Retrieved 5 June 2016.
- ↑ Peter Dominiczak (24 May 2016). "EU referendum poll: pensioners, Tory voters and men are deserting the Brexit campaign". The Telegraph. Retrieved 24 May 2016.
- ↑ "EU referendum: NHS cash row as campaigns get under way". BBC News. 15 April 2016.
- ↑ "Government Responds to Public desire for EU Facts". HM Government. 6 April 2016.
- ↑ "Government spends almost £10 million of taxpayers' money delivering its pro-EU propaganda leaflet to every home in the country". MailOnline. 6 April 2016.
- ↑ "David Cameron announces EU referendum date: As it happened". Independent. 20 February 2016.
- 1 2 3 4 5 6 7 8 9 10 "EU Referendum" (PDF). YouGov. Retrieved 14 November 2015.
- ↑ Oliver Wright (20 February 2016). "EU renegotiation: What David Cameron wanted – and what he really got". Retrieved 2 June 2016.
- ↑ "EU Referendum" (PDF). YouGov. Retrieved 27 November 2015.
- ↑ Elliott, Larry (9 May 2016). "Business support for EU membership has fallen in run-up to vote". The Guardian. Retrieved 14 May 2016.
- ↑ "BCC EU Survey: Business vote tightens as referendum campaign heads to the finish line". britishchambers.org.uk. Retrieved 14 May 2016.
- ↑ Inman, Phillip (15 March 2016). "CBI member survey reveals huge support for remaining in EU". The Guardian. Retrieved 14 May 2016.
- ↑ Chu, Ben (21 March 2016). "EU referendum: CBI warns Brexit could blow £100bn hole in economy and cost 950,000 jobs". The Independent. Retrieved 14 May 2016.
- ↑ "CBI to make economic case to remain in EU after reaffirming strong member mandate – CBI". news.cbi.org.uk. Confederation of British Industry. Retrieved 14 May 2016.
- ↑ "Growth Climate Index, Report #1" (PDF). businessgrowthfund.co.uk/. Business Growth Fund. Retrieved 14 May 2016.
- 1 2 Burn-Callander, Rebecca (29 March 2016). "British business leaders lose resolve to stay in the EU". The Telegraph. Retrieved 14 May 2016.
- 1 2 "Growth Climate Index #3" (PDF). businessgrowthfund.co.uk. March 2016. Retrieved 14 May 2016.
- ↑ "Six in ten EEF members want the UK to remain in the EU". EEF. 22 February 2016. Retrieved 2016-05-23.
- ↑ Macalister, Terry (22 February 2016). "Most business leaders will vote to stay in EU, polls find". The Guardian. Retrieved 2016-05-23.
- ↑ Allen, Katie (3 April 2016). "UK finance chiefs delay hiring and investment as Brexit tops risk list". The Guardian. Retrieved 14 May 2016.
- ↑ "The Deloitte CFO Survey: 2016 Q1". Deloitte.com. Retrieved 14 May 2016.
- ↑ Kleinman, Mark (11 April 2016). "Brexit Threat To UK Jobs, ICC Survey Warns". Sky News. Retrieved 14 May 2016.
- ↑ Cordell, Jake (12 April 2016). "EU business leaders: Don't go for Brexit". City AM. Retrieved 14 May 2016.
- ↑ "86% of international businesses surveyed believe the UK should remain within the EU – says ICC United Kingdom" (PDF). iccwbo.uk. United Kingdom office of International Chamber of Commerce. 12 April 2016. Retrieved 14 May 2016.
- ↑ Cordell, Jake (11 May 2016). "EU businesses want a hard line in any post-Brexit negotiations". City AM. Retrieved 14 May 2016.
- ↑ "Brexit: The View From Europe". King & Wood Mallesons. Retrieved 14 May 2016.
- 1 2 Cressey, Daniel (30 March 2016). "Scientists say 'no' to UK exit from Europe in Nature poll". Nature. 531 (7596): 559–559. doi:10.1038/531559a.
- ↑ Booth, James (2 March 2016). "Partners overwhelmingly anti-Brexit as confidence in Britain staying in falters". Legal Week. Retrieved 14 May 2016.
- ↑ Giles, Chris; Cadman, Emily (3 January 2016). "Economists' forecasts: Brexit would damage growth". Financial Times. Retrieved 14 May 2016.
- ↑ "Economists' Views on Brexit". Ipsos MORI. 28 May 2016. Retrieved 29 May 2016.
- ↑ Sonia Sodha, Toby Helm and Phillip Inman (28 May 2016). "Economists overwhelmingly reject Brexit in boost for Cameron". Observer. Retrieved 29 May 2016.
- ↑ "Lord Ashcroft Polls" (PDF). Retrieved 2016-07-04.
- ↑ Lord Ashcroft (17 December 2015). "Lord Ashcroft: The argument over whether to remain or leave the EU is only just beginning". The Daily Telegraph. Retrieved 19 December 2015.
- ↑ "Les Français favorables à une sortie de la Grande-Bretagne de l'UE" (in French). 26 January 2013. Retrieved 19 February 2013.
- ↑ Holly Ellyatt (28 January 2013). "Most French People Want 'Les Rosbifs' to Leave EU". CNBC. Retrieved 8 August 2013.
- ↑ "Most Germans want Britain to stay in EU". The Local. 3 January 2013. Retrieved 4 January 2014.
- 1 2 "'You Should Hear What They Say About You' – what our European neighbours think of Britain and the EU" (PDF). 17 February 2016. Retrieved 18 March 2016.
- ↑ Tom Clark (1 January 2016). "Alarmingly for pollsters, EU referendum poll results depend heavily on methods". The Guardian. Retrieved 17 May 2016.
- ↑ "EU-Denmark: 'Danes want to stay in the EU' | Presseurop.eu: European news, cartoons and press reviews". Presseurop.eu. 25 January 2013. Retrieved 8 August 2013.
- ↑ "Danskerne vil blive i EU". jyllands-posten.dk. 24 January 2013. Retrieved 9 June 2016.
- ↑ "European Movement: Two-thirds of Irish People Would Choose to Stay in the EU Even if the UK Leaves". Europeanmovement.eu. 18 January 2013. Retrieved 4 January 2014.
External links
- Brexit poll tracker – Financial Times
- EU referendum poll tracker – BBC News
- EU referendum poll tracker and odds – The Telegraph
- EU referendum poll of polls – What UK Thinks: EU