Ontario general election, 1990
| | |||||||||||||||||||||||||||||||||||||||||||||||||||||||||||
| |||||||||||||||||||||||||||||||||||||||||||||||||||||||||||
| |||||||||||||||||||||||||||||||||||||||||||||||||||||||||||
|
| |||||||||||||||||||||||||||||||||||||||||||||||||||||||||||
| Map of the 1990 election, showing the ridings and their popular vote | |||||||||||||||||||||||||||||||||||||||||||||||||||||||||||
| |||||||||||||||||||||||||||||||||||||||||||||||||||||||||||
.jpg)

The Ontario general election of 1990 was held on September 6, 1990, to elect members of the 35th Legislative Assembly of the province of Ontario, Canada.
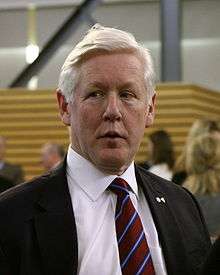
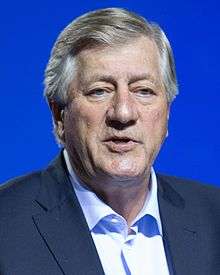
The governing Ontario Liberal Party led by Premier David Peterson was unexpectedly defeated. Although the Peterson government was very popular, he was accused of opportunism in calling an election just three years into his mandate. In a shocking upset, the New Democratic Party, led by Bob Rae, won a majority government. This marked the first time the NDP had won government east of Manitoba, and to date the only time the NDP formed the government in Ontario.
The NDP had not expected to come close to winning power; indeed, Rae had already made plans to retire from politics after the election. However, the NDP managed to take many seats in the Greater Toronto Area (Rae himself represented York South, in Metro Toronto) from the Liberals. They also did better than ever before (or in some cases, since) in many other cities and rural areas. The NDP only finished five points ahead of the Liberals in the popular vote. However, due to the nature of the first-past-the-post electoral system, which ignores the popular vote and only awards power based on the number of ridings won, the NDP's gains in the GTA decimated the Liberal caucus. The Liberals lost 59 seats, the worst defeat in their history and the second-worst defeat for a governing party in Ontario. Peterson himself was heavily defeated in London Centre by NDP challenger Marion Boyd, losing by 8,200 votes—one of the few times a provincial premier has lost his own seat.
Although Mike Harris's Progressive Conservative Party was unable to overcome voter distrust of the federal Progressive Conservative government of Brian Mulroney, his party did manage to make a net gain of four seats.
Although Harris was from northern Ontario, the Tories were particularly weak in that region, placing fourth, behind the Liberals, NDP and the right-wing, Confederation of Regions Party (CoR) in six northern Ontario ridings (Algoma, Cochrane South, Nickel Belt, Sudbury, Sudbury East and Sault Ste. Marie). The CoR Party also placed ahead of the PC Party in the Renfrew North and Cornwall ridings in eastern Ontario. Although they only received 1.9% of the vote provincewide, they managed 7.8% in the 33 ridings in which they actually fielded a candidate.
The Green Party of Ontario placed third, ahead of the NDP, in Parry Sound riding, where former Liberal leadership candidate Richard Thomas was the party's candidate.
Results
| Party | Party Leader | # of candidates |
Seats | Popular Vote | |||||
|---|---|---|---|---|---|---|---|---|---|
| 1987 | Elected | % Change | # | % | % Change | ||||
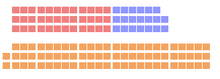
| New Democratic | Bob Rae | 130 | 19 | 74 | +279% | 1,509,506 | 37.6% | +11.9% | |
| Liberal | David Peterson | 130 | 95 | 36 | -62.1% | 1,302,134 | 32.4% | -14.9% | |
| Progressive Conservative | Mike Harris | 130 | 16 | 20 | +25% | 944,564 | 23.5% | -1.2% | |
| Family Coalition | Donald Pennell | 68 | - | - | - | 110,831 | 2.7% | +1.4% | |
| Confederation of Regions | Dean Wasson | 33 | - | 75,873 | 1.9% | ||||
| Green | Katherine Mathewson | 40 | - | - | - | 30,097 | 0.7% | +0.6% | |
| Libertarian | James Stock | 45 | - | - | - | 24,613 | 0.6% | +0.2% | |
| Freedom | Robert Metz | 10 | - | - | - | 6,015 | 0.1% | +0.0% | |
| Communist | Elizabeth Rowley | 4 | - | - | - | 1,139 | 0.1% | - | |
| Others | 15 | - | - | - | 13,307 | 0.3% | -0.1% | ||
| Total | 605 | 130 | 130 | - | 4,018,079 | 100% | - | ||
Constituency results
Ottawa-Carleton
| Electoral district | Candidates | Incumbent | ||||||||
|---|---|---|---|---|---|---|---|---|---|---|
| Liberal | PC | NDP | Other | |||||||
| Carleton
Total votes: 38,074 |
Sue LeBrun 10,143 (26.6%) |
Norm Sterling 17,860 (46.9%) |
Alex Munter 10,071 (26.5%) |
Norm Sterling | ||||||
| Carleton East
Total votes: 35,376 |
Gilles Morin 19,059 (53.9%) |
Judy Corbishley 5,117 (14.5%) |
Joan Gullen 9,976 (28.2%) |
W. André Lafrance (FCP) 1,224 (3.5%) |
Gilles Morin | |||||
| Nepean
Total votes: 32,328 |
Hans Daigeler 13,723 (42.5%) |
Doug Collins 9,870 (30.5%) |
John Raudoy 7,453 (23.1%) |
Dan Roy (G) 933 (2.9%) Dan Weiler (Lbt) 349 (1.1%) |
Hans Daigeler | |||||
| Ottawa Centre Total votes: 30,446 |
Richard Patten 11,656 (38.3%) |
Alex Burney 2,723 (8.9%) |
Evelyn Gigantes 14,522 (47.7%) |
John Gay (FCP) 809 (2.7%) Bill Hipwell (G) 576 (1.9%) John Turmel (Ind) 160 (0.5%) |
Richard Patten | |||||
|
Ottawa East |
Bernard Grandmaitre 16,363 (62.4%) |
Diana Morin 2,203 (8.4%) |
Lori Lucier 6,103 (23.3%) |
Richard Hudon (FCP) 826 (3.2%) Frank de Jong (G) 723 (2.7%) |
Bernard Grandmaitre | |||||
| Ottawa—Rideau Total votes: 29,695 |
Yvonne O'Neill 13,454 (45.3%) |
Paul Beaudry 5,234 (17.6%) |
Larry Jones 8,845 (29.8%) |
Larry Denys (FCP) 1,049 (3.5%) Jim MacPhee (Ind) 861 (2.9%) Marc Schindler (Lbt) 252 (0.8%) |
Yvonne O'Neill | |||||
| Ottawa South
Total votes: 30,185 |
Dalton McGuinty 13,845 (45.9%) |
Darrel Kent 7,399 (24.5%) |
Margaret Armstrong 7,826 (25.9%) |
Stephen Johns (G) 612 (2.0%) David Fitzpatrick (FCP) 503 (1.7%) |
Dalton McGuinty, Sr. | |||||
| Ottawa West
Total votes: 33,422 |
Bob Chiarelli 13,908 (41.6%) |
Brian Mackey 9,068 (27.1%) |
Allan Edwards 8,391 (25.1%) |
David Boyd (CoR) 1,044 (3.1%) Ian Whyte 1,011 (3.0%) |
Bob Chiarelli | |||||
Eastern Ontario
| Electoral district | Candidates | Incumbent | ||||||||
|---|---|---|---|---|---|---|---|---|---|---|
| Liberal | PC | NDP | Other | |||||||
| Cornwall
Total votes: 27 347 |
John Cleary 12 725 (46.5%) |
Don Kannon 3169 (11.6%) |
Leo Courville 7044 (26.5%) |
Carol-Ann Ross (CoR) 4409 (16.1%) | John Cleary | |||||
| Frontenac—Addington
Total votes: 29,174 |
Larry South 8,226 (28.2%) |
Jim Bennett 8,211 (28.1%) |
Fred Wilson 9,696 (33.2%) |
Gail Leonard (FCP) 2,020 (6.9%) Ross Baker 1,021 (3.5%) |
Larry South | |||||
| Hastings—Peterborough
Total votes: 28 282 |
Mike Beeston 4285 (15.2%) |
Jim Pollock 10 387 (36.7%) |
Elmer Buchanan 11 283 (39.9%) |
Anthony Kuttschrutter (FCP) 1199 (4.2%) Ronald Gerow |
Jim Pollock | |||||
| Kingston and the Islands
Total votes: 26 807 |
Ken Keyes 8092 (30.2%) |
John Goodchild 7079 (26.4%) |
Gary Wilson 10184 (38.0%) |
Joan Jackson (FCP) 1452 (5.4%) |
Ken Keyes | |||||
| Lanark-Renfrew Total votes: 34 060 |
Guin Persaud 9665 (28.4%) |
Leo Jordan 11 063 (32.5%) |
Harry Martin 8541 (25.1%) |
Murray Reid (CoR) 2938 (8.6%) Frank Foley (FCP) 1853 (5.4%) |
Douglas Wiseman | |||||
| Leeds–Grenville
Total votes: 34 330 |
Chris Puddicombe 9172 (26.7%) |
Bob Runciman 16 846 (49.1%) |
Art Lane 8312 (24.2%) |
Bob Runciman | ||||||
| Prescott and Russell
Total votes: 39 833 |
Jean Poirier 25 879 (65.0%) |
Keith Flavell 2848 (7.1%) |
Carole Roy 9369 (23.5%) |
Paul Lauzon (FCP) 1119 (2.8%) Jean-Serge Brisson (Lbt) 618 (1.6%) |
Jean Poirier | |||||
| Prince Edward—Lennox
Total votes: 27 752 |
Keith MacDonald 8188 (29.5%) |
Don Bonter 8299 (29.9%) |
Paul Johnson 9204 (33.2%) |
Kenn Hineman (CoR) 2061 (7.4%) |
Keith MacDonald | |||||
| Quinte
Total votes: 29 691 |
Hugh O'Neil 11 114 (37.4%) |
Doug Rollins 5825 (19.6%) |
Greg Meehan 7010 (23.6%) |
Stu Meeks (CoR) 3411 (11.5%) Dave Switzer (FCP) 2331 (7.9%) |
Hugh O'Neil | |||||
| Renfrew North
Total votes: 30 198 |
Sean Conway 13 082 (43.3%) |
Diane Yakabuski 4586 (15.2%) |
Ish Theilheimer 5916 (19.6%) |
Frank Adlam (CoR) 5510 (18.2%) Stephen Stanistreet (FCP) 1104 (3.7%) |
Sean Conway | |||||
| Stormont—Dundas—Glengarry & East Grenville
Total votes: 29 082 |
Denis Sabourin 8386 (28.8%) |
Noble Villeneuve 11 887 (40.9%) |
Helena McCuaig 5357 (18.4%) |
Bernie Lauzon (CoR) 3452 (11.9%) |
Noble Villeneuve | |||||
Central Ontario
| Electoral district | Candidates | Incumbent | ||||||||
|---|---|---|---|---|---|---|---|---|---|---|
| Liberal | PC | NDP | Other | |||||||
| Bruce
Total votes: 30,429 |
Murray Elston 11,476 (37.7%) |
Terry Halpin 7,349 (24.2%) |
Len Hope 7,954 (26.2%) |
Linda Freiburger (FCP) 3,639 (12.0%) |
Murray Elston | |||||
| Dufferin—Peel
Total votes: 31,447 |
Mavis Wilson 10 327 (32.8%) |
David Tilson 10,899 (34.7%) |
Sandra Crane 8,627 (27.4%) |
Bob Shapton (Lbt) 1,594 (5.1%) |
Mavis Wilson | |||||
| Bruce-Grey—Owen Sound
Total votes: 38,056 |
Ron Lipsett 10,257 (27.0%) |
Bill Murdoch 13,742 (36.1%) |
Peggy Hutchinson 11,280 (29.6%) |
John Ross (FCP) 2,157 (5.7%) Don Cianci (G) 476 (1.3%) Oleh Stebelsky (Lbt) 144 (0.4%) |
Ron Lipsett | |||||
| Muskoka-Georgian Bay
Total votes: 33 031 |
Ken Black 9105 (27.6%) |
Marilyn Rowe 10 504 (31.8%) |
Dan Waters 13 422 (40.6%) |
Ken Black | ||||||
| Northumberland
Total votes: 35 740 |
Joan Fawcett 11 984 (33.5%) |
Angus Read 10 890 (30.5%) |
Judi Armstrong 9581 (26.8%) |
Doug Young (CoR) 1677 (4.7%) Steve Prust (FCP) 1213 (3.4%) John Meiboom (Lbt) 395 (1.1%) |
Joan Fawcett | |||||
| Peterborough
Total votes: 41,888 |
Peter Adams 13,628 (32.5%) |
Doris Brick 8,884 (21.2%) |
Jenny Carter 13,813 (33.0%) |
John Harrington (FCP) 3,652 (8.7%) Dean Wasson (CoR) 1,586 (3.8%) Paul Cleveland (G) 325 (0.8%) |
Peter Adams | |||||
| Simcoe Centre
Total votes: 41 572 |
Bruce Owen 12 869 (31.0%) |
Ben Andrews 10 013 (24.1%) |
Paul Wessenger 15 711(37.8%) |
Bonnie Ainsworth (CoR) 2979 (7.2%) |
Bruce Owen | |||||
| Simcoe East
Total votes: 37 398 |
Jim Files 7219 (19.3%) |
Al McLean 14 828 (39.6%) |
Dennis Bailey 14 088 (37.7%) |
John McLean (Lbt) 1263 (3.4%) |
Al McLean | |||||
| Simcoe West
Total votes: 32 089 |
Gary Johnson 7765 (24.2%) |
Jim Wilson 11 710 (36.5%) |
Leo Loserit 9870 (30.8%) |
James McGillivray (FCP) 2744 (8.6%) |
Jim Wilson | |||||
| Victoria—Haliburton
Total votes: 34 889 |
Patrick O'Reilly 7668 (22.0%) |
Ron Jenkins 8947 (25.6%) |
Dennis Drainville 15 467 (44.3%) |
Brad Medd (FCP) 1419 (4.1%) Hugh Boyd 971 (2.8%) Ron Hawkrigg (Lbt) 417 (1.2%) |
John Eakins | |||||
Durham & York Region
| Electoral district | Candidates | Incumbent | ||||||||
|---|---|---|---|---|---|---|---|---|---|---|
| Liberal | PC | NDP | Other | |||||||
| Durham Centre
Total votes: 35,096 |
Allan Furlong 10,246 (29.2%) |
Jim Flaherty 9,126 (26.0%) |
Drummond White 12,594 (35.9%) |
Nino Maltese (FCP) 1,186 (3.4%) Phil Wyatt (CoR) 1,087 (3.1%) David Hubbell (G) 857 (2.4%) |
Allan Furlong | |||||
| Durham East
Total votes: 33 476 |
Marilyn Pearce 7836 (23.4%) |
Kirk Kemp 10 907 (32.6%) |
Gord Mills 10 960 (32.7%) |
Tim Crookall (FCP) 2487 (7.4%) Harry Turnbridge (CoR) 1286 (3.8%) |
Sam Cureatz | |||||
| Durham West
Total votes: 43,678 |
Norah Stoner 14,384 (32.9%) |
Rick Johnson 11,167 (25.6%) |
Jim Wiseman 16,366 (37.5%) |
Bert Vermeer (FCP) 1,761 (4.0%) |
Norah Stoner | |||||
| Durham—York
Total votes: 36 284 |
Bill Ballinger 11 067 (30.5%) |
Jack Hauseman 10 904 (30.5%) |
Larry O'Connor 12 297 (33.9%) |
Jerry Young (FCP) 2016 (5.6%) |
Bill Ballinger | |||||
| Markham
Total votes: 51 221 |
Frank Scarpitti 15 128 (29.5%) |
Don Cousens 25 595 (50.0%) |
Rob Saunders 8459 (16.5%) |
Eric Skura (FCP) 1086 (2.1%) Ian Hutchison (Lbt) 642 (1.3%) Gary Walsh 311 (0.6%) |
Don Cousens | |||||
| Oshawa
Total votes: 27 173 |
Jim Carlyle 5116 (18.8%) |
Cliff Fillmore 3871 (14.2%) |
Allan Pilkey 16 601 (61.1%) |
Gary Jones (CoR) 1585 (5.8%) |
Michael Breaugh | |||||
| York Centre
Total votes: 61 562 |
Greg Sorbara 28 056 (45.6%) |
Dion McGuire 14 656 (23.8%) |
Laurie Orrett 18 850 (30.6%) |
Greg Sorbara | ||||||
| York—Mackenzie
Total votes: 33,437 |
Charles Beer 11,452 (34.3%) |
George Timpson 11,304 (33.8%) |
Keith Munro 10,681 (31.9%) |
Charles Beer | ||||||
Scarborough
| Electoral district | Candidates | Incumbent | ||||||||
|---|---|---|---|---|---|---|---|---|---|---|
| Liberal | PC | NDP | Other | |||||||
| Scarborough—Agincourt
Total votes: 30 118 |
Gerry Phillips 13 347 (44.3%) |
Keith MacNab 8640 (28.7%) |
Ayoub Ali 6763 (22.5%) |
Bill Galster (Lbt) 1368 (4.5%) |
Gerry Phillips | |||||
| Scarborough Centre
Total votes: 27,262 |
Cindy Nicholas 9,256 (34.0%) |
Joe Trentadue 5,682 (20.8%) |
Steve Owens 12,324 (45.2%) |
Cindy Nicholas | ||||||
| Scarborough East
Total votes: 32 915 |
Ed Fulton 9926 (30.2%) |
Steve Gilchrist 9890 (30.0%) |
Bob Frankford 11 700 (35.5%) |
Jim McIntosh (Lbt) 577 (1.8%) Cara Mumford (G) 454 (1.4%) Darryl McDowell 368 (1.1%) |
Ed Fulton | |||||
| Scarborough—Ellesmere
Total votes: 29 119 |
Frank Faubert 9417 (32.3%) |
Greg Vezina 4855 (16.7%) |
David Warner 14 036 (48.2%) |
Kelvin Smith (Lbt) 811 (2.8%) |
Frank Faubert | |||||
| Scarborough North
Total votes: 30 056 |
Alvin Curling 13 393 (44.6%) |
Harold Adams 5367 (17.9%) |
Victor Deane 9477 (31.5%) |
Louis Di Rocco (FCP) 1199 (4.0%) James Greig (G) 620 (2.1%) |
Alvin Curling | |||||
| Scarborough West
Total votes: 28 027 |
Joe Pacione 6521 (23.3%) |
Jim Brown 5769 (20.6%) |
Anne Swarbrick 14 340 (51.2%) |
Stefan Slovak (FCP) 996 (3.6%) George Dance (Lbt) 401 (1.4%) |
Richard Johnston | |||||
North York & East York
| Electoral district | Candidates | Incumbent | ||||||||
|---|---|---|---|---|---|---|---|---|---|---|
| Liberal | PC | NDP | Other | |||||||
| Don Mills
Total votes: 28,483 |
Murad Velshi 8,786 (30.8%) |
Nola Crewe 7,631 (26.8%) |
Margery Ward 9,740 (34.2%) |
David Miller (Lbt) 742 (2.6%) Katherine Mathewson (G) 608 (2.1%) Colin McKay 562 (2.0%) David Pengelly (F) 414 (1.5%) |
Murad Velshi | |||||
| Downsview
Total votes: 23 755 |
Laureano Leone 8219 (34.6%) |
Chris Smith 1477 (6.2%) |
Anthony Perruzza 13 440 (56.6%) |
David Kenny (Lbt) 619 (2.6%) |
Laureano Leone | |||||
| Lawrence
Total votes: 26 364 |
Joseph Cordiano 11 786 (44.7%) |
Henry Gallay 3557 (13.5%) |
Shalom Schachter 10 179 (38.6%) |
Sandor Hegedus (Lbt) 431 (1.6%) Paul Rombough (G) 411 (1.6%) |
Joseph Cordiano | |||||
| Oriole
Total votes: 25 454 |
Elinor Caplan 10 655 (41.9%) |
Sam Billich 5435 (21.4%) |
Lennox Farrell 8441 (33.2%) |
Roland Brown (Lbt) 578 (2.3%) Greg Knittl (G) 345 (1.4%) |
Elinor Caplan | |||||
| Willowdale
Total votes: 33,947 |
Gino Matrundola 11,123 (32.7%) |
Charles Harnick 11,957 (35.2%) |
Batya Hebdon 9,125 (26.9%) |
Mark Vosylius (FCP) 1,074 (3.2%) Earl Epstein (Lbt) 688 (2.0%) |
Gino Matrundola | |||||
| Wilson Heights
Total votes: 27,725 |
Monte Kwinter 12,272 (44.3%) |
Steven Kerzner 4,913 (17.7%) |
John Fagan 9,618 (34.7%) |
Vanessa Schoor (G) 608 (2.2%) Roman Vrba (Lbt) 314 (1.1%) |
Monte Kwinter | |||||
| York East
Total votes: 29 848 |
Christine Hart 9900 (33.2%) |
George Bryson 8021 (26.9%) |
Gary Malkowski 10 689 (35.8%) |
Jim Copeland 380 (1.3%) Bedora Bojman (G) 364 (1.2%) John Matthew (Lbt) 303 (1.0%) Chris Frazer (Comm) 191 (0.6%) |
Christine Hart | |||||
| York Mills
Total votes: 29 207 |
Brad Nixon 10 390 (35.6%) |
David Turnbull 13 037 (44.6%) |
Marcia McVea 4830 (16.5%) |
Janet Creery (G) 577 (2.0%) Mary-Anne Sillimaa (Lbt) 373 (1.3%) |
Brad Nixon | |||||
| Yorkview
Total votes: 20 059 |
Claudio Polsinelli 8326 (41.5%) |
Pedro Cordoba 1254 (6.3%) |
Giorgio Mammoliti 9945 (49.6%) |
Roma Kelembet (Lbt) 303 (1.5%) Lucylle Boikoff 231 (1.2%) |
Claudio Polsinelli | |||||
Toronto
| Electoral district | Candidates | Incumbent | ||||||||
|---|---|---|---|---|---|---|---|---|---|---|
| Liberal | PC | NDP | Other | |||||||
| Beaches—Woodbine
Total votes: 24 645 |
Beryl Potter 6329 (25.7%) |
Kevin Forest 3535 (14.3%) |
Frances Lankin 14 381 (58.4%) |
Sam Vitulli 400 (1.6%) |
Marion Bryden | |||||
| Dovercourt
Total votes: 19 548 |
Tony Lupusella 6615 (33.8%) |
Allan Brown 1239 (6.3%) |
Tony Silipo 10 604 (54.2%) |
Norman Allen (G) 577 (3.0%) Fred Lambert (Lbt) 513 (2.6%) |
Tony Lupusella | |||||
| Eglinton
Total votes: 33 451 |
Dianne Poole 12 032 (36.0%) |
Anne Vanstone 11 859 (35.5%) |
Jay Waterman 7772 (23.2%) |
Dan King (G) 1340 (4.0%) Scott Bell (Lbt) 448 (1.3%) |
Dianne Poole | |||||
| Fort York
Total votes: 23 806 |
Bob Wong 9656 (40.6%) |
John Pepall 2258 (9.5%) |
Rosario Marchese 11 023 (46.3%) |
Paul Barker (Lbt) 539 (2.3%) Ronald Rodgers 330 (1.4%) |
Bob Wong | |||||
| High Park—Swansea
Total votes: 25 337 |
David Fleet 8159 (32.2%) |
Yuri Pokaliwsky 4674 (18.4%) |
Elaine Ziemba 11 432 (45.1%) |
Colum Tingle (FCP) 409 (1.6%) Bill Senay (G) 332 (1.3%) Michael Beech (Lbt) 331 (1.3%) |
David Fleet | |||||
| Parkdale
Total votes: 17 417 |
Tony Ruprecht 8080 (46.4%) |
John Swettenham 941 (5.4%) |
Sheena Weir 7557 (43.4%) |
Robert Hunter (G) 325 (1.9%) James McCulloch (Lbt) 241 (1.4%) Debra Stone 167 (1.0%) Joe Young (Ind [Communist League]) 106 (0.6%) |
Tony Ruprecht | |||||
| Riverdale
Total votes: 22 729 |
Pat Marquis 5572 (24.5%) |
John Ruffolo 1578 (6.9%) |
Marilyn Churley 14 086 (62.0%) |
Leanne Haze (G) 811 (3.6%) Daniel Hunt (Lbt) 682 (3.0%) |
David Reville | |||||
| St. Andrew—St. Patrick
Total votes: 29 956 |
Ron Kanter 8938 (29.8%) |
Nancy Jackman 9241 (30.8%) |
Zanana Akande 10 321 (34.5%) |
Jim Harris (G) 1112 (3.7%) Douglas Quinn (Lbt) 344 (1.1%) |
Ron Kanter | |||||
| St. George—St. David
Total votes: 29 706 |
Ian Scott 10 718 (36.1%) |
Keith Norton 6955 (23.4%) |
Carolann Wright 10 646 (35.8%) |
Ken Campbell (FCP) 932 (3.1%) Beverly Antrobus (Lbt) 455 (1.5%) |
Ian Scott | |||||
Etobicoke & York
| Electoral district | Candidates | Incumbent | ||||||||
|---|---|---|---|---|---|---|---|---|---|---|
| Liberal | PC | NDP | Other | |||||||
| Etobicoke—Humber
Total votes: 35 178 |
Jim Henderson 13 582 (38.6%) |
Aileen Anderson 9289 (26.4%) |
Russ Springate 10 049 (28.6%) |
Tonny Dodds (FCP) 1292 (3.7%) David Moore (G) 586 (1.7%) Alan D'Orsay (Lbt) 380 (1.1%) |
Jim Henderson | |||||
| Etobicoke—Lakeshore
Total votes: 31 660 |
Sam Shephard 7006 (22.1%) |
Jeff Knoll 4854 (15.3%) |
Ruth Grier 18 118 (57.2%) |
Trish O'Connor (FCP) 1053 (3.3%) Phaedra Livingstone (G) 629 (2.0%) |
Ruth Grier | |||||
| Etobicoke—Rexdale
Total votes: 26 270 |
Aurelio Acquaviva 4585 (17.5%) |
David Foster 3243 (12.3%) |
Ed Philip 17 620 (67.0%) |
David Burman (G) 822 (3.1%) |
Ed Philip | |||||
| Etobicoke West
Total votes: 33 810 |
Linda LeBourdais 10 082 (29.8%) |
Chris Stockwell 13 713 (40.6%) |
Judy Jones 7992 (23.6%) |
Kevin McGourty (FCP) 1045 (3.1%) Geoffrey Lepper (G) 354 (1.0%) Janice Hazlett (Lbt) 320 (1.0%) Martin Fraser 304 (0.9%) |
Linda LeBourdais | |||||
| Oakwood
Total votes: 21 384 |
Chaviva Hošek 8143 (38.1%) |
Claudio Lewis 1671 (7.8%) |
Tony Rizzo 10 423 (48.7%) |
Steven Peck (G) 595 (2.8%) John Primerano (Lbt) 355 (1.7%) Elizabeth Rowley (Comm) 197 (0.9%) |
Chaviva Hošek | |||||
| York South
Total votes: 24 949 |
Ozzie Grant 4534 (18.2%) |
Andrew Feldstein 2561 (10.3%) |
Bob Rae 16 642 (66.7%) |
Alex MacDonald (Lbt) 759 (3.0%) Phil Sarazen (G) 453 (1.8%) |
Bob Rae | |||||
Brampton, Mississauga & Halton
| Electoral district | Candidates | Incumbent | ||||||||
|---|---|---|---|---|---|---|---|---|---|---|
| Liberal | PC | NDP | Other | |||||||
| Brampton North
Total votes: 33,462 |
Carman McClelland 11,686 (34.9%) |
Gary Heighington 7,619 (22.8%) |
John Devries 11,588 (34.6%) |
Margaret Lloyd (FCP) 1,466 (4.4%) Lewis Jackson (Lbt) 669 (2.0%) Martha MacDonald 434 (1.3%) |
Carman McClelland | |||||
| Brampton South
Total votes: 39 985 |
Bob Callahan 12 918 (32.3%) |
Maggie McCallion 11 395 (28.5%) |
John Scheer 12 494 (31.2%) |
Ron Nonato (FCP) 2511 (6.3%) Jim Bridgewood (Comm) 667 (1.7%) |
Bob Callahan | |||||
| Burlington South
Total votes: 32 520 |
Marv Townsend 5544 (17.0%) |
Cam Jackson 17 084 (52.5%) |
Bob Wood 8185 (25.2%) |
Don Pennell (FCP) 1707 (5.2%) |
Cam Jackson | |||||
| Halton Centre
Total votes: 38 523 |
Barbara Sullivan 13 494 (35.0%) |
Bob Taylor 12 279 (31.9%) |
Richard Banigan 10 163 (26.4%) |
James Bruce (FCP) 1232 (3.2%) Bill Frampton (FP) 731 (1.9%) Jim Stock (Lbt) 624 (1.6%) |
Barbara Sullivan | |||||
| Halton North
Total votes: 27,503 |
Walt Elliot 7,962 (29.0%) |
Dave Whiting 7,499 (27.3%) |
Noel Duignan 8,510 (30.9%) |
Giuseppe Gori (FCP) 2,489 (9.1%) Patricia Kammerer (G) 582 (2.1%) John Shadbolt (Lbt) 461 (1.7%) |
Walt Elliot | |||||
| Mississauga East
Total votes: 31 684 |
John Sola 12 448 (39.3%) |
Brad Butt 8285 (26.1%) |
Mike Crone 9177 (29.0%) |
Peter Sesek 1363 (4.3%) Chris Balabanian (F) 411 (1.3%) |
John Sola | |||||
| Mississauga North
Total votes: 33 442 |
Steve Offer 12 658 (37.9%) |
John Snobelen 7990 (23.9%) |
John Foster 11 216 (33.5%) |
Ken Moores (G) 946 (2.8%) Howard Baker 632 (1.9%) |
Steve Offer | |||||
| Mississauga South
Total votes: 32 652 |
Donna Scott 6624 (20.3%) |
Margaret Marland 17 126 (52.5%) |
Sue Craig 7579 (23.2%) |
Scott McWhinnie (G) 1323 (4.1%) |
Margaret Marland | |||||
| Mississauga West
Total votes: 47 584 |
Steve Mahoney 20 038 (42.1%) |
Judi Bachman 11 945 (25.1%) |
Tom Malone 13 938 (29.3%) |
Emanuel Batler (Lbt) 892 (1.9%) Dian Achiceko 771 (1.6%) |
Steve Mahoney | |||||
| Oakville South
Total votes: 31,304 |
Doug Carrothers 10,841 (34.6%) |
Gary Carr 10,949 (35.0%) |
Danny Dunleavy 6,423 (20.5%) |
Terry Hansford (CoR) 1,057 (3.4%) Josef Petriska (G) 1,038 (3.3%) Adriana Bassi (FCP) 996 (3.2%) |
Doug Carrothers | |||||
Hamilton-Wentworth & Niagara
| Electoral district | Candidates | Incumbent | ||||||||
|---|---|---|---|---|---|---|---|---|---|---|
| Liberal | PC | NDP | Other | |||||||
| Hamilton Centre
Total votes: 25 358 |
Lily Oddie Munro 7814 (30.8%) |
Graham Snelgrove 2116 (8.3%) |
David Christopherson 14 029 (55.3%) |
Brent Monkley (G) 605 (2.4%) Julien Frost (Lbt) 429 (1.7%) Jewell Wolgram (FCP) 365 (1.4%) |
Lily Oddie Munro | |||||
| Hamilton East
Total votes: 28 336 |
Craig Dowhaniuk 5525 (19.5%) |
Rom Tomblin 1676 (5.9%) |
Robert W. Mackenzie 20 289 (71.6%) |
Emidio Corvaro (FCP) 846 (3.0%) |
Robert W. Mackenzie | |||||
| Hamilton Mountain
Total votes: 37 629 |
Al Bailey 7432 (19.8%) |
Grant Darby 7709 (20.5%) |
Brian Charlton 22 488 (59.8%) |
Brian Charlton | ||||||
| Hamilton West
Total votes: 32 777 |
Helen Wilson 7236 (22.1%) |
David Cairnie 4361 (13.3%) |
Richard Allen 18 550 (56.6%) |
Lynne Scime (FCP) 2324 (7.1%) Hans Wienhold (CoR) 306 (0.9%) |
Richard Allen | |||||
| Lincoln
Total votes: 34,141 |
Harry Pelissero 11,055 (32.4%) |
Carol Walker 9,407 (27.6%) |
Ron Hansen 12,117 (35.5%) |
Doug Bougher (CoR) 1,562 (4.6%) |
Harry Pelissero | |||||
| Niagara Falls
Total votes: 29 939 |
Wayne Campbell 7979 (26.7%) |
Norm Puttick 3896 (13.0%) |
Margaret Harrington 13 884 (46.4%) |
Ted Wiwchar (CoR) 3141 (10.5%) Art Klassen (FCP) 674 (2.3%) Donald MacDonald-Ross (G) 365 (1.2%) |
Vince Kerrio | |||||
| Niagara South
Total votes: 23 972 |
John Lopinski 7232 (30.2%) |
Doug Martin 4032 (16.8%) |
Shirley Coppen 11 161 (46.6%) |
Glen Hutton (CoR) 1547 (6.5%) |
Ray Haggerty | |||||
| St. Catharines
Total votes: 29 835 |
Jim Bradley 11 565 (38.8%) |
Bruce Timms 3926 (13.2%) |
Dave Kappele 10 629 (35.6%) |
Eva Longhurst (CoR) 2384 (8.0%) Bert Pynenburg (FCP) 1331 (4.5%) |
Jim Bradley | |||||
| St. Catharines—Brock
Total votes: 27,478 |
Mike Dietsch 8,379 (30.5%) |
Bob Welch 6,969 (25.4%) |
Christel Haeck 9,538 (34.7%) |
Rodney Book (CoR) 1,449 (5.3%) Ed Klassen (FCP) 873 (3.2%) Conrad Gibbons (Lbt) 270 (1.0%) |
Mike Dietsch | |||||
| Welland—Thorold
Total votes: 32 202 |
Gord McMillan 7557 (23.5%) |
Cam Wilson 2893 (9.0%) |
Peter Kormos 20488 (63.6%) |
John Sabados (CoR) 878 (2.7%) Barry Fitzgerald (F) 386 (1.2%) |
Peter Kormos | |||||
| Wentworth East
Total votes: 34 111 |
Shirley Collins 12 077 (35.4%) |
Doug Conley 5609 (16.4%) |
Mark Morrow 15 224 (44.6%) |
Victor Kammerer (G) 668 (2.0%) Albert Papazian 273 (0.8%) Anne Stasiuk 260 (0.8%) |
Shirley Collins | |||||
| Wentworth North
Total votes: 33 692 |
Chris Ward 11 384 (33.9%) |
Don Matthews 8740 (25.9%) |
Don Abel 11 472 (34.0%) |
Rien Vanden Enden (FCP) 1236 (3.7%) Eileen Butson (CoR) 860 (2.6%) |
Chris Ward | |||||
Midwestern Ontario
| Electoral district | Candidates | Incumbent | ||||||||
|---|---|---|---|---|---|---|---|---|---|---|
| Liberal | PC | NDP | Other | |||||||
| Brantford
Total votes: 36 474 |
Dave Neumann 13 644 (37.4%) |
Dan Di Sabatino 3087 (8.5%) |
Brad Ward 17 736 (48.6%) |
Peter Quail (FCP) 1413 (3.9%) William Darfler (G) 436 (1.2%) Helmut Kurmis (Lbt) 158 (0.4%) |
Dave Neumann | |||||
| Brant—Haldimand
Total votes: 28 785 |
Robert Nixon 10 751 (37.3%) |
Brett Kelly 6228 (21.6%) |
Chris Stanek 9282 (32.2%) |
Steve Elgersma (FCP) 1520 (5.3%) Jamie Legacey (G) 1004 (3.5%) |
Robert Nixon | |||||
| Cambridge
Total votes: 36 176 |
John Bell 7557 (20.9%) |
Carl DeFaria 4449 (12.3%) |
Mike Farnan 21 806 (60.3%) |
Anneliese Steden (FCP) 2364 (6.5%) |
Mike Farnan | |||||
| Guelph
Total votes: 39 701 |
Rick Ferraro 11 944 (30.1%) |
Linda Lennon 10 184 (25.7%) |
Derek Fletcher 15 051 (37.9%) |
John Gots (FCP) 1602 (4.0%) Bill Hulet (G) 920 (2.3%) |
Rick Ferraro | |||||
| Huron
Total votes: 29 070 |
Jim Fitzgerald 6653 (22.9%) |
Ken Campbell 9066 (31.2%) |
Paul Klopp 10 020 (34.5%) |
Tom Clark (FCP) 2931 (10.1%) Allan Dettweiler (Lbt) 400 (1.4%) |
Jack Riddell | |||||
| Kitchener
Total votes: 33 640 |
David Cooke 9731 (28.9%) |
Ian Matthew 6157 (18.3%) |
Will Ferguson 15 750 (46.8%) |
John Meenan (FCP) 2002 (6.0%) |
David Cooke | |||||
| Kitchener—Wilmot
Total votes: 36 537 |
Carl Zehr 10 869 (29.7%) |
Lance Bryant 7342 (20.1%) |
Mike Cooper 16 056 (43.9%) |
Thomas Borys (FCP) 2270 (6.2%) |
John Sweeney | |||||
| Norfolk
Total votes: 36 195 |
Gord Miller 10 971 (30.3%) |
Clarence Abbott 10 374 (28.7%) |
Norm Jamison 14 850 (41.0%) |
Gord Miller | ||||||
| Oxford
Total votes: 36 504 |
Charlie Tatham 9802 (26.9%) |
Jim Wilkins 9860 (27.0%) |
Kimble Sutherland 12 684 (34.7%) |
John Joosse (FCP) 3182 (8.7%) Kaye Sargent (Lbt) 635 (1.7%) Joe Byway (F) 341 (0.9%) |
Charlie Tatham | |||||
| Perth
Total votes: 31 802 |
Gerry Teahen 8721 (27.4%) |
Ron Christie 8600 (27.0%) |
Karen Haslam 11 712 (36.8%) |
Gordon Maloney (FCP) 2769 (8.7%) | Hugh Edighoffer | |||||
| Waterloo North
Total votes: 38 883 |
Andrew Telegdi 9441 (24.3%) |
Elizabeth Witmer 14 552 (37.4%) |
Hugh Miller 11 298 (29.1%) |
Ted Kryn (FCP) 2946 (7.6%) Rita Huschka-Sprague (Lbt) 646 (1.7%) |
Herb Epp | |||||
| Wellington
Total votes: 30 646 |
John Green 7668 (25.0%) |
Ted Arnott 12 141 (39.6%) |
Dale Hamilton 10 837 (35.4%) |
Jack Johnson | ||||||
Southwestern Ontario
| Electoral district | Candidates | Incumbent | ||||||||
|---|---|---|---|---|---|---|---|---|---|---|
| Liberal | PC | NDP | Other | |||||||
| Chatham—Kent
Total votes: 31,138 |
Maurice Bossy 9,963 (32.0%) |
Charlie Tomecek 5,619 (18.0%) |
Randy Hope 13,930 (44.7%) |
Marcy Edwards (FCP) 1,626 (5.2%) |
Maurice Bossy | |||||
| Elgin
Total votes: 34 047 |
Marietta Roberts 9723 (28.6%) |
Jim Williams 9031 (26.5%) |
Peter North 14 189 (41.7%) |
Ray Monteith (F) 1104 (3.2%) |
Marietta Roberts | |||||
| Essex-Kent
Total votes: 30 116 |
Jim McGuigan 9968 (33.1%) |
Claire Atkinson 2739 (9.1%) |
Pat Hayes 15 858 (52.7%) |
Tim McGuire (FCP) 1551 (5.2%) |
Jim McGuigan | |||||
| Essex South
Total votes: 29 358 |
Remo Mancini 10 575 (36.0%) |
Joan Flood 6335 (21.6%) |
Donna Tremblay 10 363 (35.3%) |
Steve Posthumus (FCP) 2085 (7.1%) |
Remo Mancini | |||||
| Lambton
Total votes: 27,675 |
David Smith 7,291 (26.3%) |
Bob Langstaff 7,665 (27.7%) |
Ellen MacKinnon 8,691 (31.4%) |
Jim Hopper (FCP) 3,557 (12.9%) Kim Beatson (CoR) 471 (1.7%) |
David Smith | |||||
| London Centre
Total votes: 34 765 |
David Peterson 9671 (27.8%) |
Mark Handelman 5348 (15.4%) |
Marion Boyd 17 837 (51.3%) |
John Van Geldersen (FCP) 982 (2.8%) Lloyd Walker (F) 498 (1.4%) Terry Smart 272 (0.8%) Issam Mansour (Comm) 84 (0.2%) Sidney Tarleton 73 (0.2%) |
David Peterson | |||||
| London North
Total votes: 43 770 |
Steve Buchanan 9990 (22.8%) |
Dianne Cunningham 18 079 (41.3%) |
Carolyn Davies 14 005 (32.0%) |
Bob Maniuk (FCP) 1095 (2.5%) Jack Plant (F) 601 (1.4%) |
Dianne Cunningham | |||||
| London South
Total votes: 41 115 |
Joan Smith 11 787 (28.7%) |
Bob Wood 9828 (23.9%) |
David Winninger 17 438 (42.4%) |
Paul Picard (FCP) 1427 (3.5%) Robert Metz (FP) 635 (1.5%) |
Joan Smith | |||||
| Middlesex
Total votes: 38 382 |
Doug Reycraft 12 002 (31.3%) |
Gordon Hardcastle 8957 (23.3%) |
Irene Mathyssen 12 522 (32.6%) |
Bill Giesen (FCP) 4007 (10.4%) Barry Malcolm (F) 894 (2.3%) |
Doug Reycraft | |||||
| Sarnia
Total votes: 29 586 |
Mike Bradley 8540 (28.9%) |
Mike Stark 6269 (21.2%) |
Bob Huget 10 860 (36.7%) |
Terry Burrell (FCP) 2691 (9.1%) Bill Ferguson (CoR) 652 (2.2%) Margaret Coe] (Lbt) 574 (1.9%) |
Andy Brandt | |||||
| Windsor—Riverside
Total votes: 29 769 |
Doreen Oullette 6640 (22.3%) |
Vivian Tregunna 1096 (3.7%) |
Dave Cooke 21 144 (71.0%) |
Earl Amyotte (FCP) 889 (3.0%) |
Dave Cooke | |||||
| Windsor—Sandwich
Total votes: 29 298 |
Bill Wrye 11 807 (40.5%) |
Merv de Pendleton 1186 (4.0%) |
George Dadamo 15 952 (54.4) |
Joe Crouchman 353 (1.2%) |
Bill Wrye | |||||
| Windsor—Walkerville
Total votes: 28 807 |
Mike Ray 11 581 (40.2%) |
François Michaud 1327 (4.7%) |
Wayne Lessard 15 899 (55.2%) |
Mike Ray | ||||||
Northeastern Ontario
| Electoral district | Candidates | Incumbent | ||||||||
|---|---|---|---|---|---|---|---|---|---|---|
| Liberal | PC | NDP | Other | |||||||
| Algoma
Total votes: 14 017 |
Bob Gallagher 3573 (25.5%) |
Denis Latulippe 433 (3.1%) |
Bud Wildman 8221 (58.7%) |
Stan Down (CoR) 1790 (12.8%) |
Bud Wildman | |||||
| Algoma—Manitoulin
Total votes: 15 339 |
Mike Brown 5961 (38.9%) |
Ken Ferguson 2163 (14.1%) |
Lois Miller 5754 (37.5%) |
Richard Hammond (CoR) 1114 (7.3%) Gene Solomon 347 (2.3%) |
Mike Brown | |||||
| Cochrane North
Total votes: 16 354 |
Donald Grenier 6475 (39.6%) |
René Piché 3261 (20.0%) |
Len Wood 6618 (40.5%) |
René Fontaine | ||||||
| Cochrane South
Total votes: 24 069 |
Peter Krznaric 9361 (38.9%) |
Tina Positano 1019 (4.2%) |
Gilles Bisson 11 460 (47.6%) |
Ken Metsala (CoR) 2229 (9.3%) |
Alan Pope | |||||
| Nickel Belt
Total votes: 16 955 |
Betty Rheaume 3267 (19.3%) |
Paul Demers 967 (5.7%) |
Floyd Laughren 9925 (58.5%) |
Grenville Rogers (CoR) 2796 (16.5%) |
Floyd Laughren | |||||
| Nipissing
Total votes: 33 741 |
Stan Lawlor 10 745 (31.8%) |
Mike Harris 15 469 (45.8%) |
Dawson Pratt 7039 (20.9%) |
Edward Gauthier (FCP) 488 (1.4%) |
Mike Harris | |||||
| Parry Sound
Total votes: 23 020 |
Randy Sheppard 5125 (22.3%) |
Ernie Eves 10 078 (43.8%) |
Joe Boissonneault 2993 (13.0%) |
Richard Thomas (G) 4061 (17.6%) Julia Duggan (FCP) 763 (3.3%) |
Ernie Eves | |||||
| Sault Ste. Marie
Total votes: 38 713 |
Don MacGregor 13 339 (34.5%) |
John Solski 3347 (8.6%) |
Tony Martin 14 036 (36.3%) |
Don Edwards (CoR) 7991 (20.6%) |
Karl Morin-Strom | |||||
| Sudbury
Total votes: 32,530 |
Sterling Campbell 10,010 (30.8%) |
Mike Franceschini 3,318 (10.2%) |
Sharon Murdock 13,407 (41.2%) |
Billie Christiansen (CoR) 5,795 (17.8%) |
Sterling Campbell | |||||
| Sudbury East
Total votes: 30 232 |
Jean-Yves Robert 7484 (24.8%) |
John Johnson 1458 (4.8%) |
Shelley Martel 17 536 (58.0%) |
Greg Bigger (CoR) 3754 (12.4%) |
Shelley Martel | |||||
| Timiskaming
Total votes: 19,779 |
David Ramsay 8,364 (42.3%) |
Garfield Pinkerton 2,261 (11.4%) |
Michelle Evans 6,191 (31.3%) |
James Fawcett (CoR) 2,250 (11.4%) Doug Fraser (G) 713 (3.6%) |
David Ramsay | |||||
Northwestern Ontario
| Electoral district | Candidates | Incumbent | ||||||||
|---|---|---|---|---|---|---|---|---|---|---|
| Liberal | PC | NDP | Other | |||||||
| Fort William
Total votes: 26,551 |
Lyn McLeod 11,798 (44.4%) |
Harold Wilson 4,300 (16.2%) |
Don Hutsul 10,453 (39.4%) |
Lyn McLeod | ||||||
| Kenora
Total votes: 20 106 |
Frank Miclash 8152 (40.5%) |
Dean McIntyre 1776 (8.8%) |
Doug Miranda 7821 (38.9%) |
Henry Wetelainen 2357 (11.7%) |
Frank Miclash | |||||
| Lake Nipigon
Total votes: 12,785 |
Judy Tinnes 3,083 (24.1%) |
Jim Vibert 735 (5.7%) |
Gilles Pouliot 8,335 (65.2%) |
Bill Thibeault (FCP) 632 (5.0%) |
Gilles Pouliot | |||||
| Port Arthur
Total votes: 27 798 |
Taras Kozyra 10 885 (39.2%) |
Tony Stehmann 3854 (13.9%) |
Shelley Wark-Martyn 11 919 (42.9%) |
Claude Wyspianspki (FCP) 1140 (4.1%) |
Taras Kozyra | |||||
| Rainy River
Total votes: 12 751 |
Dennis Brown 3878 (30.4%) |
Bob Davidson 1035 (8.1%) |
Howard Hampton 7838 (61.5%) |
Howard Hampton | ||||||
Post-election changes
Party affiliation switches
Tony Rizzo (NDP) became an independent MPP on October 10, 1990, after questions were raised about labour practices in his bricklaying firms. He would later rejoin the NDP caucus.
Dennis Drainville (NDP) became an independent MPP on April 28, 1993, as a protest against the Rae government's plans to introduce casinos to the province. He later resigned his seat in the legislature, resulting in a by-election.
Will Ferguson (NDP) became an independent MPP on April 30, 1993, following accusations relating to the Grandview scandal. He later rejoined the NDP caucus on June 21, 1994, having been cleared of all charges.
John Sola (L) became an independent MPP on May 11, 1993, after making comments about Canadian Serbs that most regarded as racist.
Peter North (NDP) became an independent MPP on October 27, 1993, claiming he had lost confidence in the Rae government. He tried to join the Progressive Conservatives, but was rebuffed.
Byelections
Due to resignations, five by-elections were held between the 1990 and 1995 elections.
| Electoral district | Candidates | Incumbent | ||||||||
|---|---|---|---|---|---|---|---|---|---|---|
| Liberal | PC | NDP | Other | |||||||
| Brant—Haldimand March 5, 1992 |
Ronald Eddy 9,565 |
David Timms 4,758 |
Christopher Stanek 2,895 |
Donald Pennell (FCP) 2,056 Ella Haley (G) 759 Janice Wilson (Ind) 250 |
Robert Nixon resigned July 31, 1991 | |||||
| Don Mills April 1, 1993 |
Murad Velshi 5,583 |
David Johnson 9,143 |
Chandran Mylvaganam 1,513 |
Diane Johnston (Ind Renewal) 498 Denise Mountenay (FCP) 383 Bernadette Michael (Ind) 206 David Pengelly (F) 161 Sat Khalsa (G) 141 |
Margery Ward died January 22, 1993 | |||||
| St. George—St. David April 1, 1993 |
Tim Murphy 8,750 |
Nancy Jackman 6,518 |
George Lamony 1,451 |
Louis Di Rocco (FCP) 347 Phil Sarazen (G) 209 Judith Snow (Ind Renewal) 119 Ed Fortune (Ind) 107 Robert Smith (Ind) 72 John Steele (Comm League) 57 |
Ian Scott resigned September 8, 1992 | |||||
| Essex South December 2, 1993 |
Bruce Crozier 12,736 |
Joan Flood 3,295 |
David Maris 1,100 |
Joyce Ann Cherry (FCP) 1,060 Michael Green (G) 132 John Turmel (Ind) 84 |
Remo Mancini resigned May 10, 1993 | |||||
| Victoria—Haliburton March 17, 1994 |
Sharon McCrae 9,571 |
Chris Hodgson 11,941 |
Art Field 1,378 |
Ron Hawkrigg (Lbt) 252 Bradley Bradamore (Ind) 217 John Turmel (Ind) 123 |
Dennis Drainville resigned September 27, 1993 | |||||
Vacancies
In addition, four seats were vacant in the final months of the legislature, as the sitting members resigned and by-elections were not held to replace them before the 1995 election:
- Bruce — Murray Elston (L) resigned October 31, 1994
- Kitchener — Will Ferguson (NDP) resigned October 8, 1994
- Markham — Don Cousens (PC) resigned September 30, 1994
- St. Andrew—St. Patrick — Zanana Akande (NDP) resigned August 31, 1994
See also
- Politics of Ontario
- List of Ontario political parties
- Premier of Ontario
- Leader of the Opposition (Ontario)
| General elections | |
|---|---|
| By-elections | |
| Referendums | |