Oneida County, New York
| Oneida County, New York | ||
|---|---|---|
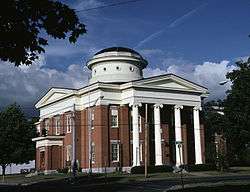 Oneida County Courthouse | ||
| ||
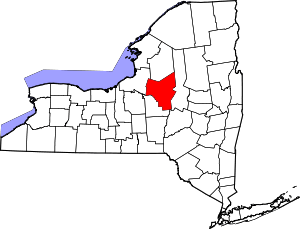 Location in the U.S. state of New York | ||
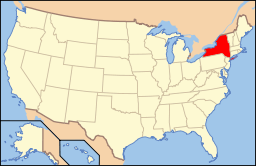 New York's location in the U.S. | ||
| Founded | 1798 | |
| Named for | Oneida people | |
| Seat | Utica | |
| Largest city | Utica | |
| Area | ||
| • Total | 1,258 sq mi (3,258 km2) | |
| • Land | 1,212 sq mi (3,139 km2) | |
| • Water | 45 sq mi (117 km2), 3.6% | |
| Population | ||
| • (2010) | 234,878 | |
| • Density | 194/sq mi (75/km²) | |
| Congressional district | 22nd | |
| Time zone | Eastern: UTC-5/-4 | |
| Website |
ocgov | |

Oneida County is a county located in the state of New York, in the United States. As of the 2010 census, the population was 234,878.[1] The county seat is Utica.[2] The name is in honor of the Oneida, an Iroquoian tribe that had this territory at the time of European encounter and has a reservation in the region.
Oneida County is part of the Utica-Rome, NY Metropolitan Statistical Area.
History
When colonial counties were established by England in New York State in 1683, the territory of present Oneida County was included in a very large, mostly undeveloped Albany County. This was an enormous county, including the northern part of New York State as well as all of the present state of Vermont and, in theory, extending westward to the Pacific Ocean. This county was reduced in size on July 3, 1766 by the creation of Cumberland County, and further on March 16, 1770 by the creation of Gloucester County, both containing territory now in Vermont.
On March 12, 1772, what was left of Albany County was split into three parts, one remaining under the name Albany County. One of the other sections, Tryon County, contained the western portion (and thus, since no western boundary was specified, theoretically still extended west to the Pacific). The eastern boundary of Tryon County was approximately five miles west of the present city of Schenectady, and the county included the western part of the Adirondack Mountains and the area west of the West Branch of the Delaware River. The area then designated as Tryon County included what are now 37 individual counties of New York State. The county was named for William Tryon, colonial governor of New York.
During and after the Revolution, most of the Loyalists in Tryon County fled to Canada. In 1784, following the peace treaty that ended the American Revolutionary War, Americans changed the name of Tryon County to Montgomery County to honor the general, Richard Montgomery, who had captured several places in Canada and died attempting to capture the city of Quebec. They replaced the name of the then hated British governor.
In 1789, the size of Montgomery County was reduced by the splitting off of Ontario County from Montgomery. The actual area split off from Montgomery County was much larger than the present county, also including the present Allegany, Cattaraugus, Chautauqua, Erie, Genesee, Livingston, Monroe, Niagara, Orleans, Steuben, Wyoming, Yates, and part of Schuyler and Wayne Counties.
In 1791, Herkimer County was one of three counties split off from Montgomery (the other two being Otsego, and Tioga County). This was much larger than the present county, however, and was reduced by a number of subsequent splits.
In 1794, Herkimer County was reduced in size by the splitting off of Onondaga County. This county was larger than the current Onondaga County, including the present Cayuga, Cortland, and part of Oswego counties.
In 1798, Oneida County was created from a part of Herkimer County. This county was larger than the current Oneida County, including the present Jefferson, Lewis, and part of Oswego counties.
In 1805, Jefferson and Lewis counties were split off from Oneida. In 1816, parts of Oneida and Onondaga counties were taken to form the new Oswego County.
In 1848, John Humphrey Noyes founded a religious and Utopian community, the Oneida Community, near Oneida. Its unconventional views on religion and relations between the sexes led to much controversy. The community lasted until 1881. The Oneida Silver Company was founded here to manufacture sterling silver, silverplate holloware and later stainless steel flatware.
Geography
According to the U.S. Census Bureau, the county has a total area of 1,258 square miles (3,260 km2), of which 1,212 square miles (3,140 km2) is land and 45 square miles (120 km2) (3.6%) is water.[3]
Oneida County is in the central portion of New York State, east of Syracuse, and west of Albany. Oneida Lake is on the northwestern corner of the county, and the Adirondack Park is on the northeast. Part of the Tug Hill Plateau is in the northern part of the county. Interestingly, Oneida County's highest point does not lie on either the plateau nor in the Adirondack Park, but in the county's southern extremity. The peak's name is Tassel Hill. It is located slightly southeast of Hardscrabble Road (Tassel Hill Road), between the villages of Waterville and Cassville.
The Erie Canal bisects the county. Oneida Lake and Oneida Creek form part of the western boundary.
In the early 21st century, it is the only county in New York state with a known presence of Chronic wasting disease among wild White-tailed deer.[4]
Adjacent counties
- Lewis County - north
- Herkimer County - east
- Otsego County - southeast
- Madison County - southwest
- Oswego County - west
National protected area
Demographics
| Historical population | |||
|---|---|---|---|
| Census | Pop. | %± | |
| 1800 | 22,047 | — | |
| 1810 | 33,792 | 53.3% | |
| 1820 | 50,997 | 50.9% | |
| 1830 | 71,326 | 39.9% | |
| 1840 | 85,310 | 19.6% | |
| 1850 | 99,566 | 16.7% | |
| 1860 | 105,202 | 5.7% | |
| 1870 | 110,008 | 4.6% | |
| 1880 | 115,475 | 5.0% | |
| 1890 | 122,922 | 6.4% | |
| 1900 | 132,800 | 8.0% | |
| 1910 | 154,157 | 16.1% | |
| 1920 | 182,833 | 18.6% | |
| 1930 | 198,763 | 8.7% | |
| 1940 | 203,636 | 2.5% | |
| 1950 | 222,855 | 9.4% | |
| 1960 | 264,401 | 18.6% | |
| 1970 | 273,037 | 3.3% | |
| 1980 | 253,466 | −7.2% | |
| 1990 | 250,836 | −1.0% | |
| 2000 | 235,469 | −6.1% | |
| 2010 | 234,878 | −0.3% | |
| Est. 2015 | 232,500 | [5] | −1.0% |
| U.S. Decennial Census[6] 1790-1960[7] 1900-1990[8] 1990-2000[9] 2010-2013[1] | |||
As of the census[10] of 2000, there were 235,469 people, 90,496 households, and 59,184 families residing in the county. The population density was 194 people per square mile (75/km²). There were 102,803 housing units at an average density of 85 per square mile (33/km²). The racial makeup of the county was 90.21% White, 5.74% African American, 0.23% Native American, 1.16% Asian, 0.02% Pacific Islander, 1.11% from other races, and 1.52% from two or more races. Hispanic or Latino of any race were 3.20% of the population. 21.7% were of Italian, 13.1% Irish, 12.1% German, 9.9% Polish, 8.5% English and 5.6% American ancestry according to Census 2000. 90.6% spoke English, 2.7% Spanish, 1.3% Italian, 1.2% Serbo-Croatian and 1.1% Polish as their first language.
There were 90,496 households out of which 30.40% had children under the age of 18 living with them, 49.10% were married couples living together, 12.00% had a female householder with no husband present, and 34.60% were non-families. 29.50% of all households were made up of individuals and 13.10% had someone living alone who was 65 years of age or older. The average household size was 2.43 and the average family size was 3.02.
In the county the population was spread out with 23.90% under the age of 18, 8.60% from 18 to 24, 28.20% from 25 to 44, 22.90% from 45 to 64, and 16.50% who were 65 years of age or older. The median age was 38 years. For every 100 females there were 98.60 males. For every 100 females age 18 and over, there were 96.30 males.
The median income for a household in the county was $35,909, and the median income for a family was $45,341. Males had a median income of $32,194 versus $24,295 for females. The per capita income for the county was $18,516. About 9.80% of families and 13.00% of the population were below the poverty line, including 18.90% of those under age 18 and 8.50% of those age 65 or over.
Government and politics
| Year | Republican | Democratic |
|---|---|---|
| 2016 | 57.3% 48,490 | 36.3% 30,749 |
| 2012 | 51.4% 44,530 | 46.7% 40,468 |
| 2008 | 52.2% 49,256 | 46.1% 43,506 |
| 2004 | 54.9% 52,392 | 42.8% 40,792 |
| 2000 | 49.6% 47,603 | 45.8% 43,933 |
| 1996 | 40.0% 37,996 | 46.8% 44,399 |
| 1992 | 40.4% 43,806 | 37.8% 40,966 |
| 1988 | 53.2% 55,039 | 46.1% 47,665 |
| 1984 | 60.4% 65,377 | 39.3% 42,603 |
| 1980 | 49.6% 51,968 | 42.3% 44,292 |
| 1976 | 54.4% 57,655 | 45.1% 47,779 |
| 1972 | 69.9% 78,549 | 29.9% 33,642 |
| 1968 | 51.0% 52,875 | 43.1% 44,685 |
| 1964 | 35.1% 39,737 | 64.8% 73,359 |
| 1960 | 48.4% 59,513 | 51.5% 63,368 |
Oneida County was governed by a board of supervisors until 1962, when the county charter was changed to create a county executive and a 29-seat county legislature. The county executive is elected by the entire county. All 29 members of the legislature are elected from single member districts. Currently, there are 16 Republicans and 13 Democrats. On January 1, 2014, the Oneida County Legislature was reduced to 23 seats.
| Name | Party | Term |
|---|---|---|
| Charles T. Lanigan | Republican | January 1, 1963 – December 31, 1966 |
| Harry S. Daniels | Republican | January 1, 1967 – December 31, 1967 (interim) January 1, 1968 – December 31, 1973 |
| William E. Bryant | Democratic | January 1, 1974 – April 21, 1979 |
| Antoinette Hyer | Democratic | April 22, 1979 – May 2, 1979 (acting) |
| Seymour Greene | Democratic | May 3, 1979 – June, 1979 (interim) |
| Michael Nasser | Democratic | June 1979 – December 31, 1979 (interim) |
| Sherwood L. Boehlert | Republican | January 1, 1980 – December 31, 1982 |
| John D. Plumley | Republican | January 1, 1983 – January 13, 1991 |
| Raymond A. Meier | Republican | January 14, 1991 – December 31, 1991 (interim) January 1, 1992 – December 31, 1996 |
| Ralph J. Eannace Jr. | Republican | January 1, 1997 – May, 2003 |
| Joseph A. Griffo | Republican | May, 2003 – December 31, 2003 (interim) January 1, 2004 – December 31, 2006 |
| Anthony J. Picente, Jr. | Republican | January 1, 2007 – present |
| District | Legislator | Title | Party | Residence |
|---|---|---|---|---|
| 1 | Ronald D. Townsend | Republican | Rome | |
| 2 | Howard Regner | Republican | Oneida | |
| 3 | Patrick H. Brennan | Republican | Waterville | |
| 4 | Norman Leach | Republican | Camden | |
| 5 | Michael B. Waterman | Republican | Camden | |
| 6 | Les Porter | Republican | Remsen | |
| 7 | Frank Tallarino | Minority Leader | Democratic | Rome |
| 8 | Richard Flisnik | Republican | Marcy | |
| 9 | Philip M. Sacco | Democratic | Deerfield | |
| 10 | George E. Joseph | Majority Leader | Republican | Clinton |
| 11 | Robert Koenig | Republican | Oriskany | |
| 12 | Michael J. Clancy | Democratic | Verona | |
| 13 | William B. Goodman | Democratic | Whitesboro | |
| 14 | David J. Gordon | Democratic | New Hartford | |
| 15 | James D'Onofrio | Republican | Utica | |
| 16 | Brian D. Miller | Republican | New Hartford | |
| 17 | Brian Mandryck | Republican | Ava | |
| 18 | Chad Davis | Democratic | Clinton | |
| 19 | Daniel Trevisani | Democratic | Utica | |
| 20 | Gerald J. Fiorini | Chairman | Republican | Rome |
| 21 | Edward P. Welsh | Republican | Utica | |
| 22 | Harmony Speciale | Democratic | Utica | |
| 23 | Rose Ann Convertino | Democratic | Utica | |
| 24 | Emil Papparella | Republican | Utica | |
| 25 | Franklin D. Davis | Democratic | Utica | |
| 26 | Peter A. Caruso | Democratic | Utica | |
| 27 | Joseph Furgol | Democratic | Utica | |
| 28 | David J. Wood | Republican | Rome | |
| 29 | James Murphy | Democratic | Rome |
Oneida County also leans Republican in major statewide and national elections. In 2008, John McCain won the county by 6,000 votes out of 90,000 cast. He won all municipalities in the county except the city of Utica and the town of Kirkland.
Economy
The main product of Oneida County was once silverware, chiefly manufactured at Oneida Ltd.'s headquarters in Sherrill. In January 2005, the company ceased manufacturing their product, closing its main plant and selling its assets.
Currently the largest non-governmental, non-healthcare product of Oneida County is gambling. Turning Stone Casino Resort is an enterprise of the Oneida Indian Nation of New York, and the largest private employer in Oneida County.[12]
Education
- Hamilton College
- Mohawk Valley Community College
- State University of New York Polytechnic Institute
- Utica College
Communities
Cities
Towns
Villages
Census-designated places
Hamlets
Notable locations
See also
- List of counties in New York
- National Register of Historic Places listings in Oneida County, New York
- Oneida, New York, a city in Madison County
- Oneida Community, a former religious community
References
- 1 2 "State & County QuickFacts". United States Census Bureau. Retrieved October 12, 2013.
- ↑ "Find a County". National Association of Counties. Retrieved 2011-06-07.
- ↑ "2010 Census Gazetteer Files". United States Census Bureau. August 22, 2012. Retrieved January 6, 2015.
- ↑ Chronic Wasting Disease. Cwd-info.org. Retrieved on 2013-08-23.
- ↑ "County Totals Dataset: Population, Population Change and Estimated Components of Population Change: April 1, 2010 to July 1, 2015". Retrieved July 2, 2016.
- ↑ "U.S. Decennial Census". United States Census Bureau. Retrieved January 6, 2015.
- ↑ "Historical Census Browser". University of Virginia Library. Retrieved January 6, 2015.
- ↑ "Population of Counties by Decennial Census: 1900 to 1990". United States Census Bureau. Retrieved January 6, 2015.
- ↑ "Census 2000 PHC-T-4. Ranking Tables for Counties: 1990 and 2000" (PDF). United States Census Bureau. Retrieved January 6, 2015.
- ↑ "American FactFinder". United States Census Bureau. Retrieved 2008-01-31.
- ↑ http://uselectionatlas.org/RESULTS/
- ↑
External links
 |
Lewis County | | ||
| Oswego County | |
Herkimer County | ||
| ||||
| | ||||
| Madison County | Otsego County |
Municipalities and communities of Oneida County, New York, United States | ||
|---|---|---|
| Cities | | |
| Towns | ||
| Villages | ||
| CDPs | ||
| Hamlets | ||
Coordinates: 43°14′N 75°26′W / 43.24°N 75.44°W