O'Leary, Prince Edward Island
| Town of O’Leary | ||
|---|---|---|
| Town | ||
| ||
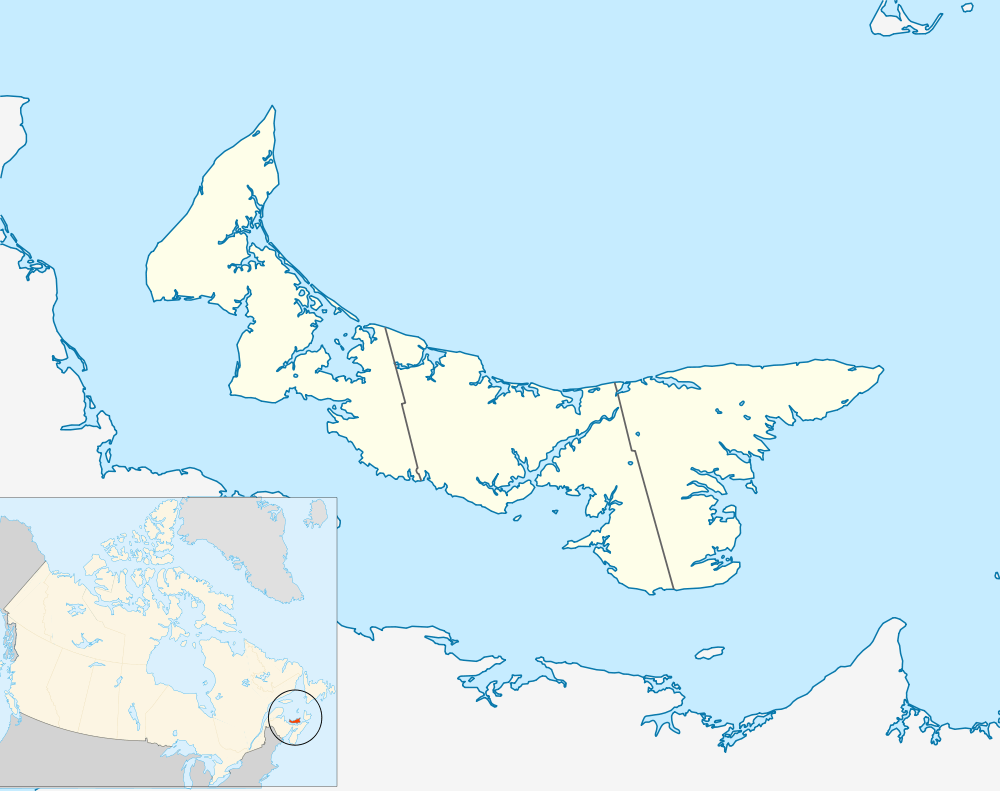 Location of O'Leary in Prince Edward Island | ||
| Coordinates: 46°42′25″N 64°13′50″W / 46.70694°N 64.23056°W | ||
| Country | Canada | |
| Province | Prince Edward Island | |
| County | Prince County | |
| Parish | Halifax | |
| Government | ||
| • Type | Town Council | |
| • Mayor | Eric Gavin | |
| • Deputy Mayor | Carol Ferguson | |
| • Administrator | Beverley Shaw | |
| • Councilors |
Blake Adams Joey Dumville Marvin MacDonald Darren MacKinnon Tashia Maynard | |
| Area | ||
| • Total | 4.1 km2 (1.57 sq mi) | |
| Elevation | 31 m (102 ft) | |
| Population | ||
| • Total | 861 | |
| • Density | 547.2/km2 (1,417/sq mi) | |
| Canadian Postal code | C0B 1V0 | |
| Area code(s) | 902 | |
| Telephone Exchange | 859 | |
| NTS Map | 021I09 | |
| GNBC Code | BABYS | |
| Website | http://www.townofoleary.com/index.php | |

O'Leary (IPA pronunciation [o.lɛ.ri]) is a town in Prince County, Prince Edward Island, Canada.[1]
The community's economy is tied to the potato farming industry and is home to the PEI Potato Museum.
O’Leary is part of the federal electoral riding of Egmont and the provincial electoral district #25, O'Leary - Inverness.
O’Leary is centrally located in West Prince, just a few kilometers from 3 provincial parks, a golf and crosscountry ski resort, and sandy beaches.
According to the 1996 Census, the population of O’Leary is 861 with a catchment area of approximately 15,000 people.
O'Leary is also known as Hockeytown PEI
Climate
| Climate data for O'Leary | |||||||||||||
|---|---|---|---|---|---|---|---|---|---|---|---|---|---|
| Month | Jan | Feb | Mar | Apr | May | Jun | Jul | Aug | Sep | Oct | Nov | Dec | Year |
| Record high °C (°F) | 13.5 (56.3) |
13 (55) |
16.5 (61.7) |
21.5 (70.7) |
32.2 (90) |
33.5 (92.3) |
32.8 (91) |
32.5 (90.5) |
32.5 (90.5) |
24 (75) |
20 (68) |
13.9 (57) |
33.5 (92.3) |
| Average high °C (°F) | −4.4 (24.1) |
−3.8 (25.2) |
0.7 (33.3) |
6.5 (43.7) |
14.3 (57.7) |
19.8 (67.6) |
23.2 (73.8) |
22.8 (73) |
18 (64) |
11.4 (52.5) |
5.1 (41.2) |
−1.2 (29.8) |
9.4 (48.9) |
| Average low °C (°F) | −12.7 (9.1) |
−12.2 (10) |
−7 (19) |
−1.2 (29.8) |
4.3 (39.7) |
9.8 (49.6) |
13.8 (56.8) |
13.6 (56.5) |
9.5 (49.1) |
4.1 (39.4) |
−0.9 (30.4) |
−7.9 (17.8) |
1.1 (34) |
| Record low °C (°F) | −31 (−24) |
−29.4 (−20.9) |
−25.6 (−14.1) |
−13.9 (7) |
−6.1 (21) |
−1.1 (30) |
3.9 (39) |
3.3 (37.9) |
−1.1 (30) |
−6.7 (19.9) |
−15 (5) |
−27.2 (−17) |
−31 (−24) |
| Average precipitation mm (inches) | 97.1 (3.823) |
78.3 (3.083) |
89.4 (3.52) |
85.2 (3.354) |
95.6 (3.764) |
82.6 (3.252) |
100.1 (3.941) |
84.9 (3.343) |
99.7 (3.925) |
107.9 (4.248) |
110.2 (4.339) |
109.7 (4.319) |
1,140.7 (44.909) |
| Source: Environment Canada[2] | |||||||||||||
References
- ↑ "Municipal Affairs and Provincial Planning". Department of Finance, Energy and Municipal Affairs. Retrieved 21 July 2013.
- ↑ Environment Canada Canadian Climate Normals 1971–2000, accessed 15 July 2009
Coordinates: 46°42′25″N 64°13′50″W / 46.70694°N 64.23056°W
| Subdivisions | |
|---|---|
| Cities | |
| Towns | |
| Incorporated communities |
|
| Unincorporated communities | |
| |
This article is issued from Wikipedia - version of the 11/29/2016. The text is available under the Creative Commons Attribution/Share Alike but additional terms may apply for the media files.