Northeastern Ontario
| Northeastern Ontario Nord-est de l'Ontario (French) | |
|---|---|
| Secondary region | |
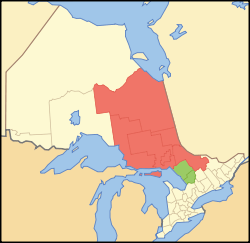 ██ Core area ██ Extended area | |
| Coordinates: 48°00′N 81°45′W / 48.000°N 81.750°WCoordinates: 48°00′N 81°45′W / 48.000°N 81.750°W | |
| Country |
|
| Province |
|
| Area | |
| • Total | 266,802.37 km2 (103,012.97 sq mi) |
| Population (2011) | |
| • Total | 508,982 |
| • Density | 1.91/km2 (4.9/sq mi) |
| Largest city |
Greater Sudbury 160,274 (2011) |
Northeastern Ontario is a secondary region of Northern Ontario which lies north and east of Lakes Superior and Huron.
Northeastern Ontario consists of the districts of Algoma, Sudbury, Cochrane, Timiskaming, Nipissing and Manitoulin.
For some purposes, Parry Sound District and Muskoka District Municipality are treated as part of Northeastern Ontario although they are geographically in Central Ontario. These two divisions are coloured in green on the map.
Northeastern Ontario and Northwestern Ontario may also be grouped together as Northern Ontario. An important difference between the two sub-regions is that Northeastern Ontario has a sizeable Franco-Ontarian population — approximately 25 per cent of the region's population speaks French as a first language, compared to just 3.2 per cent in the northwest.
Cities and towns
Northeastern Ontario has six cities. They are Greater Sudbury, Sault Ste. Marie, North Bay, Timmins, Elliot Lake and Temiskaming Shores.
Smaller towns in the region include Espanola, Blind River, Chapleau, Cochrane, Englehart, Hearst, Iroquois Falls, Kapuskasing, Kirkland Lake, Moosonee, French River, St. Charles, Markstay-Warren and West Nipissing.
Population
| Population of Northeastern Ontario | |||||||
|---|---|---|---|---|---|---|---|
| District | 2011 | ± | 2006 | ± | 2001 | ± | 1996 |
| Northeastern Ontario | 508,982 | -0.3% | 510,326 | -3.3% | 512,007 | -5.6% | 542,248 |
| Algoma District | 115,870 | -1.4% | 117,461 | -0.9% | 118,567 | -5.5% | 125,455 |
| Cochrane District | 81,122 | -1.7% | 82,503 † | -3.2% | 85,247 | -8.6% | 93,240 |
| Greater Sudbury (including enclaved Wahnapitae First Nations reserve) |
160,376 | 1.6% | 157,909 | 1.7% | 155,268 | -6.1% | 165,336 |
| Manitoulin District | 13,048 | -0.3% | 13,090 | 3.2% | 12,679 | 7.9% | 11,747 |
| Nipissing District | 84,736 | 0.1% | 84,688 † | 2.1% | 82,910 | -2.3% | 84,832 |
| Sudbury District | 21,196 | -3.0% | 21,392 | -6.6% | 22,894 | -3.9% | 23,831 |
| Timiskaming District | 32,634 | -1.9% | 33,283 | -3.4% | 34,442 | -8.9% | 37,807 |
Provincial parks
External links
| Regions | |
|---|---|
| Counties | |
| Districts | |
| Regional municipalities | |
| Single-tier municipalities | |
| Separated municipalities | |
| |