Nichols plot
The Nichols plot is a plot used in signal processing and control design, named after American engineer Nathaniel B. Nichols.[1][2][3]
Use in Control Design
Given a transfer function,

with the closed-loop transfer function defined as,

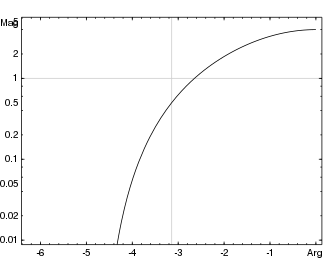
the Nichols plots displays versus . Loci of constant and are overlaid to allow the designer to obtain the closed loop transfer function directly from the open loop transfer function. Thus, the frequency is the parameter along the curve. This plot may be compared to the Bode plot in which the two inter-related graphs - versus and versus ) - are plotted.


In feedback control design, the plot is useful for assessing the stability and robustness of a linear system. This application of the Nichols plot is central to the Quantitative feedback theory (QFT) of Horowitz and Sidi, which is a well known method for robust control system design.
In most cases, refers to the phase of the system's response. Although similar to a Nyquist plot, a Nichols plot is plotted in a Cartesian coordinate system while a Nyquist plot is plotted in a polar coordinate system.
See also
References
- ↑ Isaac M. Howowitz, Synthesis of Feedback Systems, Academic Press, 1963, Lib Congress 63-12033 p. 194-198
- ↑ Boris J. Lurie and Paul J. Enright, Classical Feedback Control, Marcel Dekker, 2000, ISBN 0-8247-0370-7 p. 10
- ↑ Allen Stubberud, Ivan Williams, and Joseph DeStefano, Shaums Outline Feedback and Control Systems, McGraw-Hill, 1995, ISBN 0-07-017052-5 ch. 17