Niagara County, New York
| Niagara County, New York | |
|---|---|
 Niagara County Clerks Office | |
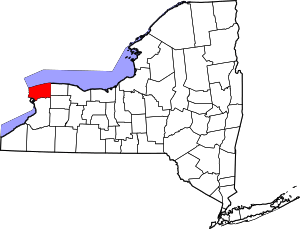 Location in the U.S. state of New York | |
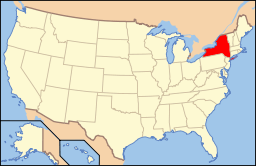 New York's location in the U.S. | |
| Founded | March 11, 1808 |
| Seat | Lockport |
| Largest city | Niagara Falls |
| Area | |
| • Total | 1,140 sq mi (2,953 km2) |
| • Land | 522 sq mi (1,352 km2) |
| • Water | 617 sq mi (1,598 km2), 54% |
| Population (est.) | |
| • (2013) | 214,249 |
| • Density | 414/sq mi (160/km²) |
| Congressional districts | 26th, 27th |
| Time zone | Eastern: UTC-5/-4 |
| Website |
www |
Niagara County is a county in the U.S. state of New York. As of the 2010 census, the population was 216,469.[1] The county seat is Lockport.[2] The county name is from the Iroquois word Onguiaahra; meaning the strait or thunder of waters.[3]\
Niagara County is part of the Buffalo-Niagara Falls metropolitan area, and across the Canada–US border is the province of Ontario.
It is the location of Niagara Falls and Fort Niagara, and has many parks and lake shore recreation communities. In the summer of 2008, Niagara County celebrated its 200birthday with the first town of the county, Town of Cambria.
History
When counties were established in the New York colony in 1683, the present Niagara County was part of Albany County. This was an enormous county, including the northern part of New York State as well as all of the present State of Vermont and, in theory, extending westward to the Pacific Ocean. This county was reduced in size on July 3, 1766 by the creation of Cumberland County, and further on March 16, 1770 by the creation of Gloucester County, both containing territory now in Vermont.
On March 12, 1772, what was left of Albany County was split into three parts, one remaining under the name Albany County. One of the other pieces, Tryon County, contained the western portion (and thus, since no western boundary was specified, theoretically still extended west to the Pacific). The eastern boundary of Tryon County was approximately five miles west of the present city of Schenectady, and the county included the western part of the Adirondack Mountains and the area west of the West Branch of the Delaware River. The area then designated as Tryon County now includes 37 counties of New York State. The county was named for William Tryon, colonial governor of New York.
In the years prior to 1776, most of the Loyalists in Tryon County fled to Canada. In 1784, following the peace treaty that ended the American Revolutionary War, the name of Tryon County was changed to honor the general, Richard Montgomery, who had captured several places in Canada and died attempting to capture the city of Quebec, replacing the name of the hated British governor.
In 1789, Ontario County was split off from Montgomery. In turn, Genesee County was created from Ontario County in 1802.
Niagara County was created from Genesee County in 1808. It was, however, larger than the present Niagara County even though it consisted of only the Town of Cambria.
From 1814 to 1817, records of Cattaraugus County were divided between Belmont (the seat of Allegany County) and Buffalo (then in Niagara County).
In 1821, Erie County was created from Niagara County.
The county has a number of properties on the National Register of Historic Places.[4]
Geography
According to the U.S. Census Bureau, the county has a total area of 1,140 square miles (3,000 km2), of which 522 square miles (1,350 km2) is land and 617 square miles (1,600 km2) (54%) is water.[5]
Niagara County is in the extreme western part of New York State, just north of Buffalo and adjacent to Lake Ontario on its northern border and the Niagara River and Canada on its western border.
The county's primary geographic feature is Niagara Falls, the riverbed of which has eroded seven miles south over the past 12,000 years since the last Ice Age. The Niagara River and Niagara Falls, are in effect, the drainage ditch for four of the Great Lakes which constitute the world's largest supply of fresh water. The water flows north from Lake Erie, then through the Niagara River, goes over Niagara Falls, and then on to Lake Ontario and the St. Lawrence River, eventually emptying into the North Atlantic Ocean. Today, tourists and visitors to the Falls see a diminished flow of water over the Falls, since a portion of the flow has been diverted for hydroelectric power purposes. Both the American and Canadian side of the Niagara River have massive electrical power plants.
The spectacular Niagara Gorge is the path Niagara Falls has taken over thousands of years as it continues to erode. Niagara Falls started at the Niagara Escarpment which cuts Niagara County in half in an east-west direction. north of the Escarpment lies the Lake Ontario plain, which is a fertile flatland used to grow grapes, apples, peaches and other fruits and vegetables. The grape variety Niagara, source of most American white grape juice but not esteemed for wine, was first grown in the county, in 1868. Viticulture, or wine culture has begun to take place, with several wineries below the escarpment. This has helped to improve the depressed economy of the region. To further capitalize on economic development, the state has created the Niagara Wine Trail.
Adjacent counties and areas
- Orleans County - east
- Genesee County - southeast
- Erie County - south
- Regional Municipality of Niagara, Ontario, Canada - west
Major highways
 Interstate 190 (Niagara Thruway)
 U.S. Route 62
 US 62 Business
 New York State Route 18
 New York State Route 31
 New York State Route 78
 New York State Route 93
 New York State Route 104
 New York State Route 265
 New York State Route 384
 New York State Route 425
 Robert Moses State Parkway
 LaSalle Expressway
State protected areas
- De Veaux Woods State Park, north of the City of Niagara Falls.
- Devil's Hole State Park, immediately north of the City of Niagara Falls.
- Fort Niagara State Park, located at the mouth of the Niagara River.
- Earl W. Brydges Artpark State Park, in the Town of Lewiston.
- Four Mile Creek State Park, on the shore of Lake Ontario.
- Golden Hill State Park, on the shore of Lake Ontario.
- Hartland Swamp Wildlife Management Area—a conservation area in the Town of Hartland.
- Joseph Davis State Park, along the Niagara River.
- Niagara Reservation State Park, in the City of Niagara Falls.
- Reservoir State Park, south of the power reservoir.
- Tonawanda Wildlife Management Area, partly in the Town of Royalton.
- Wilson-Tuscarora State Park, on the shore of Lake Ontario.
Government and politics
| Year | Republican | Democratic |
|---|---|---|
| 2016 | 56.8% 49,223 | 37.9% 32,888 |
| 2012 | 48.6% 43,240 | 49.4% 43,986 |
| 2008 | 48.7% 46,348 | 49.7% 47,303 |
| 2004 | 48.8% 47,111 | 49.3% 47,602 |
| 2000 | 43.9% 40,952 | 51.2% 47,781 |
| 1996 | 35.1% 31,438 | 49.4% 44,203 |
| 1992 | 31.5% 30,401 | 36.9% 35,649 |
| 1988 | 49.0% 42,537 | 50.4% 43,801 |
| 1984 | 55.2% 51,289 | 44.5% 41,368 |
| 1980 | 44.9% 38,760 | 46.8% 40,405 |
| 1976 | 51.1% 46,101 | 48.4% 43,667 |
| 1972 | 58.2% 54,777 | 41.4% 38,991 |
| 1968 | 44.1% 38,796 | 47.8% 41,999 |
| 1964 | 29.9% 28,663 | 70.1% 67,260 |
| 1960 | 49.1% 50,001 | 50.8% 51,680 |
Structure
Niagara County is governed by a 15-member Legislature, with the Chairman of the Legislature as the de facto head of county government. Currently, there are 11 members of the Republican-led Majority Caucus and four members of the Democrat-led Minority Caucus. The Legislature formerly consisted of 19 members, but was downsized to 15 seats effective January 1, 2012 based on the results of a public referendum.
A subordinate county manager reports to the County Legislature. Jeffrey M. Glatz is Niagara County Manager, with a four-year term commencing December 1, 2010.
Niagara County Legislature
(Majority Caucus in bold; Minority Caucus in ital.)
Chairman Wm. Keith McNall
Vice Chairman Clyde L. Burmaster
Majority Leader Randy R. Bradt
Minority Leader Dennis Virtuoso
Legislator Clyde L. Burmaster (1st District—Towns of Lewiston and Porter)
Legislator Rebecca J. Wydysh (2nd District—Towns of Wheatfield and Lewiston)
Legislator Mark J. Grozio (3rd District—City of Niagara Falls)
Legislator Owen Steed (4th District—City of Niagara Falls)
Legislator Jason A. Zona (5th District—City of Niagara Falls)
Legislator Dennis F. Virtuoso (6th District—City of Niagara Falls)
Legislator Kathryn L. Lance (7th District—Town of Wheatfield and City of North Tonawanda)
Legislator Richard L. Andres (8th District—City of North Tonawanda)
Legislator Randy R. Bradt (9th District—City of North Tonawanda)
Legislator David E. Godfrey (10th District—Towns of Cambria, Wilson and Wheatfield)
Legislator Anthony J. Nemi (11th District—City of Lockport, Towns of Lockport and Pendleton)
Legislator Will Collins (12th District—Town of Lockport and City of Lockport)
Legislator Wm. Keith McNall (13th District—City of Lockport)
Legislator John Syracuse (14th District—Towns of Newfane and Somerset)
Legislator Michael A. Hill (15th District—Towns of Royalton and Hartland)
Governing functions of the Legislature rely on a committee system; currently, there are five standing committees and one long-term ad hoc committee. The five standing committees are Administration, chaired by Nemi; Community Services, chaired by McNall; Community Safety and Security, chaired by Godfrey; Economic Development, chaired by Lance; and Public Works, chaired by Syracuse. An ad hoc Refuse Disposal District Committee is chaired by Hill.
The Administration Committee has oversight of the following government departments: County Manager, County Attorney, Management & Budget, Treasurer, Audit, Real Property, Data Processing, Legislature Office, Printing/Mailing, Human Resources, Civil Service, Risk Management, and Board of Elections.
The Community Services Committee has oversight of the following government departments: Social Services, Employment & Training, Youth Bureau, Office of Aging, Public Health, Mental Health, NCCC, County Clerk/DMV, Historian, and Veterans Services.
The Community Safety and Security Committee has oversight of the following government departments: Sheriff, District Attorney, Public Defender, Probation, Fire Coordinator/Emergency Services, and Coroners.
The Economic Development Committee has oversight of the Niagara County Center for Economic Development and the Niagara County Industrial Development Agency.
The Public Works Committee has oversight of the following government departments: Public Works, Parks/Golf Course, Refuse Disposal District, Sewer District, Water District, and Weights & Measures.
Additionally, the ad hoc Refuse Disposal District Committee has oversight of that District.
The dominant political party in the Niagara County Legislature is currently the Republican Party, which is ancestrally the dominant party in Niagara County.
Other entities
In addition to the areas mentioned above, much of Niagara County is serviced by a Water District and a Sewer District. Both bodies are subordinate to the County Legislature; the former has a direct relationship, while the latter is currently under limited oversight of the town supervisors within the district.
Other elected officers
County Clerk Joseph A. Jastrzemski (R)
Treasurer Kyle R. Andrews (D)
Sheriff James R. Voutour (D)
District Attorney Michael J. Violante (R)
Coroner, 1st District Cindy Lou Joyce (D)
Coroner, 2nd District Joseph V. Mantione (R)
Coroner, 3rd District Kenneth V. Lederhouse (R) Lederhouse is also the senior coroner, having served longest of the four county coroners.
Coroner, 4th District Michael Ross (R)
State and federal government
| Office | District | Area of the county | Officeholder | Party | First took office | Residence |
|---|---|---|---|---|---|---|
| Congressman | New York's 27th congressional district | All[7] | Christopher C. Collins | Republican | 2013 | Clarence, Erie County |
| State Senator | 62nd State Senate District | All[8] | Robert G. Ortt | Republican | 2014 | Newfane, Niagara County |
| State Assemblyman | 140th State Assembly District | North Tonawanda[9] | Robin L. Schimminger | Democratic | 1977 | Kenmore, Erie County |
| State Assemblywoman | 144th State Assembly District | Roughly the north and east parts of the county (Towns of Hartland, Lockport, Newfane, Porter, Royalton, Somerset, Wilson)[10] | Jane L. Corwin | Republican | 2009 | Clarence, Erie County |
| State Assemblyman | 145th State Assembly District | Roughly the west part of the county (Towns of Cambria, Lewiston, Niagara, Wheatfield, City of Niagara Falls, Tuscarora Reservation)[11] | John D. Ceretto | Democratic | 2011 | Lewiston, Niagara County |
| State Assemblyman | 146th State Assembly District | Pendleton[12] | Raymond W. Walter | Republican | 2012 | East Amherst, Erie County |
Niagara County is part of:
- The 8th Judicial District of the New York Supreme Court
- The 4th Division of the New York Supreme Court, Appellate Division
Demographics
| Historical population | |||
|---|---|---|---|
| Census | Pop. | %± | |
| 1810 | 8,971 | — | |
| 1820 | 22,990 | 156.3% | |
| 1830 | 18,482 | −19.6% | |
| 1840 | 31,132 | 68.4% | |
| 1850 | 42,276 | 35.8% | |
| 1860 | 50,399 | 19.2% | |
| 1870 | 50,437 | 0.1% | |
| 1880 | 54,173 | 7.4% | |
| 1890 | 62,491 | 15.4% | |
| 1900 | 74,961 | 20.0% | |
| 1910 | 92,036 | 22.8% | |
| 1920 | 118,705 | 29.0% | |
| 1930 | 149,329 | 25.8% | |
| 1940 | 160,110 | 7.2% | |
| 1950 | 189,992 | 18.7% | |
| 1960 | 242,269 | 27.5% | |
| 1970 | 235,720 | −2.7% | |
| 1980 | 227,354 | −3.5% | |
| 1990 | 220,756 | −2.9% | |
| 2000 | 219,846 | −0.4% | |
| 2010 | 216,469 | −1.5% | |
| Est. 2015 | 212,652 | [13] | −1.8% |
| U.S. Decennial Census[14] 1790-1960[15] 1900-1990[16] 1990-2000[17] 2010-2013[1] | |||
As of the census of 2010, there were 216,469 people, 87,846 households, and 58,593 families residing in the county. The population density was 420 people per square mile (162/km²). There were 95,715 housing units at an average density of 183 per square mile (71/km²). The racial makeup of the county was 90.70% White, 6.15% Black or African American, 0.94% Native American, 0.58% Asian, 0.02% Pacific Islander, 0.40% from other races, and 1.21% from two or more races. 1.33% of the population were Hispanic or Latino of any race. 23.6% were of German, 18.1% Italian, 11.3% Irish, 11.2% Polish and 8.3% English ancestry. 94.5% spoke English, 1.6% Spanish and 1.0% Italian as their first language.
There were 87,846 households out of which 30.90% had children under the age of 18 living with them, 50.30% were married couples living together, 12.30% had a female householder with no husband present, and 33.30% were non-families. 28.60% of all households were made up of individuals and 12.00% had someone living alone who was 65 years of age or older. The average household size was 2.45 and the average family size was 3.03.
In the county the population was spread out with 24.70% under the age of 18, 8.50% from 18 to 24, 28.40% from 25 to 44, 23.10% from 45 to 64, and 15.40% who were 65 years of age or older. The median age was 38 years. For every 100 females there were 93.30 males. For every 100 females age 18 and over, there were 89.50 males.
The median income for a household in the county was $38,136, and the median income for a family was $47,817. Males had a median income of $37,468 versus $24,668 for females. The per capita income for the county was $19,219. About 8.20% of families and 10.60% of the population were below the poverty line, including 15.00% of those under age 18 and 7.30% of those age 65 or over.
Education
Niagara University is located in Lewiston, New York. Niagara County Community College is located in Sanborn, New York. Many Niagara County residents also attend Erie and other Western New York County Schools. In the Buffalo Metro area there more than 20 public and private colleges and universities in Buffalo and its environs offer programs in technical and vocational training, graduate, and professional studies.
Communities

Cities
- Lockport (county seat)
- Niagara Falls
- North Tonawanda
Towns
Villages
Census-designated places
Indian reservations
See also
- List of counties in New York
- National Register of Historic Places listings in Niagara County, New York
Footnotes
- 1 2 "State & County QuickFacts". United States Census Bureau. Retrieved October 12, 2013.
- ↑ "Find a County". National Association of Counties. Retrieved 2011-06-07.
- ↑ http://www.ongiaracollege.ca/webpages/ongiara_region.shtml Retrieved 9 October 2008
- ↑ National Park Service (2008-04-15). "National Register Information System". National Register of Historic Places. National Park Service.
- ↑ "2010 Census Gazetteer Files". United States Census Bureau. August 22, 2012. Retrieved January 6, 2015.
- ↑ http://uselectionatlas.org/RESULTS/
- ↑ W, Eric (2012-04-02). "Congressional District 27" (PDF). View 2012 Congressional Maps. Albany, New York: The New York State Legislative Task Force on Demographic Research and Reapportionment. Retrieved 2013-01-13.
- ↑ W, Eric (2012-03-02). "Senate District 62" (PDF). View 2012 Senate District Maps. Albany, New York: The New York State Legislative Task Force on Demographic Research and Reapportionment. Retrieved 2013-01-06.
- ↑ W, Eric (2012-01-25). "Assembly District 140" (PDF). View Proposed 2012 Assembly District Maps. Albany, New York: The New York State Legislative Task Force on Demographic Research and Reapportionment. Retrieved 2013-01-16.
- ↑ W, Eric (2012-01-25). "Assembly District 144" (PDF). View Proposed 2012 Assembly District Maps. Albany, New York: The New York State Legislative Task Force on Demographic Research and Reapportionment. Retrieved 2013-01-16.
- ↑ W, Eric (2012-01-25). "Assembly District 145" (PDF). View Proposed 2012 Assembly District Maps. Albany, New York: The New York State Legislative Task Force on Demographic Research and Reapportionment. Retrieved 2013-01-16.
- ↑ W, Eric (2012-01-25). "Assembly District 146" (PDF). View Proposed 2012 Assembly District Maps. Albany, New York: The New York State Legislative Task Force on Demographic Research and Reapportionment. Retrieved 2013-01-16.
- ↑ "County Totals Dataset: Population, Population Change and Estimated Components of Population Change: April 1, 2010 to July 1, 2015". Retrieved July 2, 2016.
- ↑ "U.S. Decennial Census". United States Census Bureau. Retrieved January 6, 2015.
- ↑ "Historical Census Browser". University of Virginia Library. Retrieved January 6, 2015.
- ↑ "Population of Counties by Decennial Census: 1900 to 1990". United States Census Bureau. Retrieved January 6, 2015.
- ↑ "Census 2000 PHC-T-4. Ranking Tables for Counties: 1990 and 2000" (PDF). United States Census Bureau. Retrieved January 6, 2015.
Further reading
- History of Niagara County, New York: With Illustrations Descriptive of Its Scenery, Private Residences, Public Buildings, Fine Blocks, Public Manufactures, and Portraits of Old Pioneers and Prominent Residents. New York: Sanford & Co., 1878.
- John Theodore Horton, Edward Theodore Williams, and Harry Stevens Douglass, History of Northwestern New York: Erie, Niagara, Wyoming, Genesee and Orleans Counties. Lewis Publishing Co., 1947.
- Robert D. Kostoff, A History of Niagara County, New York. Lewiston, NY: Edwin Mellen Press, 2001.
- Niagara County Pioneer Association, Souvenir History of Niagara County, New York: Commemorative of the 25th Anniversary of the Pioneer Association of Niagara County. Lockport, NY: The Lockport Journal, 1902.
- William Pool, Landmarks of Niagara County, New York. Syracuse, NY: D. Mason & Co., 1897.
- Samuel T. Wiley and Winfield Scott Garner, Biographical and Portrait Cyclopedia of Niagara County, New York. Philadelphia: Gresham Publishing Co., 1892.
- Edward T. Williams, Niagara County, New York: A Concise Record of Her Progress and People, 1821-1921, Published during Its Centennial Year. In Two Volumes. Chicago: J.H. Beers & Co., 1921.
External links
 |
Lake Ontario | | ||
| Regional Municipality of Niagara, Ontario, Canada | |
Orleans County | ||
| ||||
| | ||||
| Erie County | Genesee County |
Municipalities and communities of Niagara County, New York, United States | ||
|---|---|---|
| Cities | | |
| Towns | ||
| Villages | ||
| CDPs | ||
| Other hamlets |
| |
| Indian reservations | ||
| Footnotes | ‡This populated place also has portions in an adjacent county or counties | |
| Principal city | 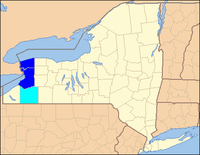 | |
|---|---|---|
| Other major cities | ||
| Counties | ||
Coordinates: 43°19′N 78°47′W / 43.32°N 78.79°W