New Madrid County, Missouri
| New Madrid County, Missouri | |
|---|---|
 New Madrid County Courthouse | |
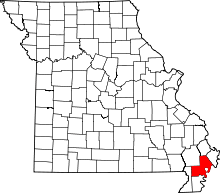 Location in the U.S. state of Missouri | |
 Missouri's location in the U.S. | |
| Founded | October 1, 1812 |
| Named for | Madrid, Spain |
| Seat | New Madrid |
| Largest city | New Madrid |
| Area | |
| • Total | 697 sq mi (1,805 km2) |
| • Land | 675 sq mi (1,748 km2) |
| • Water | 22 sq mi (57 km2), 3.1% |
| Population (est.) | |
| • (2015) | 18,208 |
| • Density | 28/sq mi (11/km²) |
| Congressional district | 8th |
| Time zone | Central: UTC-6/-5 |
New Madrid County (pronounced /njuː ˈmædrᵻd/) new-MAD-rid) is a county located in the Bootheel of the U.S. state of Missouri. As of the 2010 census, the population was 18,956.[1] The largest city and county seat is New Madrid, located on the northern side of the Kentucky Bend in the Mississippi River, where it has formed an oxbow around an exclave of Fulton County, Kentucky.[2] This feature has also been known as New Madrid Bend or Madrid Bend, for the city.
The county was officially organized on October 1, 1812, and is named after Nuevo Madrid, a district located in the region. This area was under Spanish rule following France's cession of North American territory after being defeated by Britain in the Seven Years' War. The Spanish named the district after Madrid, the capital of Spain.[3]
The county includes a large part of the New Madrid Fault that produced the 1811–12 New Madrid earthquakes. This zone has the potential to produce more earthquakes in the future.
History
French Canadians from New France landed in this area in 1781 and established the first settlement in the present county at New Madrid along the Mississippi River.[4] Later France ceded this area to Spain following its loss in the Seven Years' War. Spain returned it to France late in the 18th century, and France sold this and a large area west of the Mississippi River in 1803 to the United States under the Louisiana Purchase.
New Madrid County was organized on October 1, 1812, as an act of the First General Assembly of the Missouri Territory.[5] In the floodplain of the Mississippi, this area was long cultivated for cotton production.
A series of more than 1,000 earthquakes struck the area in 1811 and 1812. The New Madrid earthquakes were the strongest non-subduction zone earthquake in the United States, and may have registered 9.0 on the Richter scale. A request dated January 13, 1814, by the Territorial Governor William Clark, asked for federal relief for the "inhabitants of New Madrid County."
The county had its peak of population in 1940, according to US census data, as shown in the table. Many residents left the county from 1950 to 1970, seeking better work opportunities. County population has continued to decline.
Geography

According to the U.S. Census Bureau, the county has a total area of 697 square miles (1,810 km2), of which 675 square miles (1,750 km2) is land and 22 square miles (57 km2) (3.1%) is water.[6]
The county is located on the Kentucky Bend of the Mississippi River, which forms a border of the county. This feature is also known as New Madrid Bend or Madrid Bend. This oxbow flows around an exclave of Fulton County, Kentucky. Scientists expect that eventually the river will cut a new channel across the narrow neck of the peninsula, which will gradually be attached by infill land to Missouri.
Adjacent counties
- Scott County (north)
- Mississippi County (northeast)
- Fulton County, Kentucky (south and east across the Mississippi river)
- Lake County, Tennessee (south across the river)
- Pemiscot County (south)
- Dunklin County (southwest)
- Stoddard County (northwest)
Major highways
Demographics
| Historical population | |||
|---|---|---|---|
| Census | Pop. | %± | |
| 1820 | 2,296 | — | |
| 1830 | 2,350 | 2.4% | |
| 1840 | 4,554 | 93.8% | |
| 1850 | 5,541 | 21.7% | |
| 1860 | 5,654 | 2.0% | |
| 1870 | 6,357 | 12.4% | |
| 1880 | 7,694 | 21.0% | |
| 1890 | 9,317 | 21.1% | |
| 1900 | 11,280 | 21.1% | |
| 1910 | 19,488 | 72.8% | |
| 1920 | 25,180 | 29.2% | |
| 1930 | 30,262 | 20.2% | |
| 1940 | 39,787 | 31.5% | |
| 1950 | 39,444 | −0.9% | |
| 1960 | 31,350 | −20.5% | |
| 1970 | 23,420 | −25.3% | |
| 1980 | 22,945 | −2.0% | |
| 1990 | 20,928 | −8.8% | |
| 2000 | 19,760 | −5.6% | |
| 2010 | 18,956 | −4.1% | |
| Est. 2015 | 18,208 | [7] | −3.9% |
| U.S. Decennial Census[8] 1790-1960[9] 1900-1990[10] 1990-2000[11] 2010-2015[1] | |||
As of the census[12] of 2000, there were 19,760 people, 7,824 households, and 5,508 families residing in the county. The population density was 29 people per square mile (11/km²). There were 8,600 housing units at an average density of 13 per square mile (5/km²). The racial makeup of the county was 83.21% White, 15.36% Black or African American, 0.19% Native American, 0.14% Asian, 0.01% Pacific Islander, 0.32% from other races, and 0.78% from two or more races. Approximately 0.93% of the population were Hispanic or Latino of any race. Among the major first ancestries reported in New Madrid County were 32.4% American, 10.3% Irish, 8.8% English, and 8.7% German ancestry.
There were 7,824 households out of which 32.80% had children under the age of 18 living with them, 52.00% were married couples living together, 14.60% had a female householder with no husband present, and 29.60% were non-families. 26.50% of all households were made up of individuals and 13.20% had someone living alone who was 65 years of age or older. The average household size was 2.48 and the average family size was 2.99.
In the county the population was spread out with 26.40% under the age of 18, 8.50% from 18 to 24, 26.40% from 25 to 44, 23.20% from 45 to 64, and 15.50% who were 65 years of age or older. The median age was 37 years. For every 100 females there were 92.40 males. For every 100 females age 18 and over, there were 86.50 males.
The median income for a household in the county was $32,758, and the median income for a family was $39,411. Males had a median income of $28,408 versus $19,186 for females. The per capita income for the county was $17,227. About 18.60% of families and 22.10% of the population were below the poverty line, including 31.40% of those under age 18 and 19.20% of those age 65 or over.
Religion
According to the Association of Religion Data Archives County Membership Report (2000), New Madrid County is a part of the Bible Belt with evangelical Protestantism being the majority religion. The most predominant denominations among residents in New Madrid County who adhere to a religion are Southern Baptists (62.86%), Roman Catholics (8.80%), and Methodists (7.36%).
Politics
Local
The Democratic Party completely controls politics at the local level in New Madrid County. Democrats hold all elected positions in the county.
| New Madrid County, Missouri | ||||
|---|---|---|---|---|
| Elected countywide officials | ||||
| Assessor | Ronnie Simmons | Democratic | ||
| Circuit Clerk | Marsha Meatte Holiman | Democratic | ||
| County Clerk | Clement Cravens | Democratic | ||
| Collector | Dewayne Nowlin | Democratic | ||
| Commissioner (Presiding) |
Clyde M. Hawes | Democratic | ||
| Commissioner (District 1) |
Mark Baker | Democratic | ||
| Commissioner (District 2) |
Don Day | Democratic | ||
| Coroner | Jimmy McSpadden | Democratic | ||
| Prosecuting Attorney | Lewis H. Recker | Democratic | ||
| Public Administrator | Riley Bock | Democratic | ||
| Recorder | Kim St. Mary Hall | Democratic | ||
| Sheriff | Terry M. Stevens | Democratic | ||
| Surveyor | Charles Ice | Democratic | ||
| Treasurer | Tom Bradley | Democratic | ||
State
New Madrid County is divided among three legislative districts in the Missouri House of Representatives.
- District 160 - Currently represented by Ellen Brandom (R-Sikeston) and consists of Miner and the areas around Sikeston.
| Party | Candidate | Votes | % | ± | |
|---|---|---|---|---|---|
| Republican | Ellen Brandom* | 437 | 100.00 | 0 | |
- District 161 - Currently represented by Steve Hodges (D-East Prairie) and consists of most of the northern and eastern parts of the county and includes the city of New Madrid as well as the towns of Canalou, Catron, Howardville, Lilbourn, Marston, Matthews, Morehouse, and North Lilbourn.
| Party | Candidate | Votes | % | ± | |
|---|---|---|---|---|---|
| Democratic | Steve Hodges* | 1,369 | 57.74 | -42.26 | |
| Republican | Ron McCormick | 1,002 | 42.26 | +42.26 | |
- District 162 - Currently represented by Terry Swinger (D-Caruthersville) and consists of most of the western and southern parts of the county and includes the city of Portageville as well as the towns of Gideon, Parma, Risco, and Tallapoosa.
| Party | Candidate | Votes | % | ± | |
|---|---|---|---|---|---|
| Democratic | Terry Swinger* | 1,381 | 100.00 | 0 | |
All of New Madrid County is a part of Missouri's 25th District in the Missouri Senate and is currently represented by State Senator Rob Mayer (R-Dexter). In 2008, Mayer defeated Democrat M. Shane Stoelting 65.32-34.68 percent in the district. The 25th Senatorial District consists of Butler, Dunklin, New Madrid, Pemiscot, Ripley, Stoddard, and Wayne counties.
| Party | Candidate | Votes | % | ± | |
|---|---|---|---|---|---|
| Republican | Rob Mayer | 4,217 | 54.53 | ||
| Democratic | M. Shane Stoelting | 3,517 | 45.47 | ||
| Year | Republican | Democratic | Third Parties |
|---|---|---|---|
| 2012 | 44.64% 2,732 | 59.70% 4,270 | 1.49% 120 |
| 2008 | 38.19% 3,574 | 53.87% 4,313 | 2.11% 151 |
| 2004 | 47.57% 3,737 | 51.38% 4,036 | 1.05% 82 |
| 2000 | 41.28% 2,978 | 57.50% 4,148 | 1.22% 88 |
| 1996 | 28.14% 2,106 | 70.43% 5,270 | 1.43% 107 |
| 1992 | 38.99% 3,087 | 61.01% 4,830 | 0.00% 0 |
| 1988 | 50.94% 3,594 | 48.89% 3,449 | 0.17% 12 |
| 1984 | 50.34% 3,979 | 49.66% 3,926 | 0.00% 0 |
| 1980 | 38.82% 3,176 | 61.14% 5,002 | 0.04% 3 |
| 1976 | 37.75% 2,951 | 62.20% 4,863 | 0.05% 4 |
Federal
New Madrid County is included in Missouri’s 8th Congressional District and is currently represented by Jason T. Smith (R-Salem) in the U.S. House of Representatives. Smith won a special election on Tuesday, June 4, 2013, to finish out the remaining term of U.S. Representative Jo Ann Emerson (R-Cape Girardeau). Emerson announced her resignation a month after being reelected with over 70 percent of the vote in the district. She resigned to become CEO of the National Rural Electric Cooperative.
| Party | Candidate | Votes | % | ± | |
|---|---|---|---|---|---|
| Republican | Jo Ann Emerson | 4,888 | 68.30 | +6.53 | |
| Democratic | Jack Rushin | 2,133 | 29.80 | -4.78 | |
| Libertarian | Rick Vandeven | 136 | 1.90 | +0.39 | |
| Party | Candidate | Votes | % | ± | |
|---|---|---|---|---|---|
| Democratic | Steve Hodges | 1,008 | 51.85 | ||
| Republican | Jason T. Smith | 891 | 45.83 | ||
| Constitution | Doug Enyart | 25 | 1.29 | ||
| Libertarian | Bill Slantz | 20 | 1.03 | ||
Political culture
| Year | Republican | Democratic | Third Parties |
|---|---|---|---|
| 2012 | 59.09% 4,284 | 38.81% 2,814 | 2.10% 152 |
| 2008 | 56.76% 4,593 | 41.65% 3,370 | 1.59% 129 |
| 2004 | 52.54% 4,154 | 47.00% 3,716 | 0.46% 37 |
| 2000 | 47.01% 3,416 | 51.45% 3,738 | 1.54% 112 |
| 1996 | 31.93% 2,417 | 58.80% 4,451 | 9.27% 702 |
| 1992 | 29.33% 2,431 | 58.91% 4,883 | 11.61% 962 |
| 1988 | 46.99% 3,387 | 52.89% 3,812 | 0.12% 9 |
| 1984 | 53.38% 4,323 | 46.62% 3,776 | 0.000% 0 |
| 1980 | 48.70% 4,041 | 50.27% 4,171 | 1.04% 86 |
| 1976 | 34.39% 2,798 | 65.38% 5,319 | 0.23% 19 |
At the presidential level, New Madrid County is a fairly independent-leaning or battleground county. The Bootheel is a rather isolated area with a white majority and slightly more than 15 percent African-American residents. Voters have a slight tendency to lean Democratic. Presidential Democratic candidate Al Gore won the county in 2000, and Republican George W. Bush in 2004; both times the margins of victory were significantly closer than in many of the other rural areas. Bill Clinton had carried New Madrid County both times in 1992 and 1996 by convincing double-digit margins. As did many of the other rural counties in Missouri, New Madrid County favored John McCain over Barack Obama in 2008, although the margin of victory was smaller than in most rural areas.
Voters in New Madrid County generally adhere to socially and culturally conservative principles but are more moderate or populist on economic issues, typical of the Dixiecrat philosophy. In 2004, Missourians voted on a constitutional amendment to define marriage as the union between a man and a woman. New Madrid County passed it with 83.82 percent of the vote. The initiative passed the state with 71 percent support as Missouri became the first state to ban same-sex marriage. In 2006, Missourians voted on a constitutional amendment to fund and legalize embryonic stem cell research in the state—it failed in New Madrid County with 56.09 percent voting against the measure. The initiative narrowly passed the state with 51 percent of support from voters as Missouri became one of the first states in the nation to approve embryonic stem cell research.
Despite New Madrid County’s longstanding tradition of supporting socially conservative platforms, voters in the county support such populist causes as increasing the minimum wage. In 2006, Missourians voted on a proposition (Proposition B) to increase the minimum wage in the state to $6.50 an hour—it passed New Madrid County with 75.66 percent of the vote. The proposition was strongly in every county in Missouri, with 78.99 percent voting in favor. During the same election, voters in five other states also strongly approved increases in the minimum wage.
Missouri Presidential Preference Primary (2008)
In the 2008 Missouri Presidential Preference Primary, voters in New Madrid County from both political parties supported candidates who finished in second place in the state at large and nationally.
- Former U.S. Senator Hillary Clinton (D-New York) received more votes, a total of 1,801, than any candidate from either party in New Madrid County during the 2008 Missouri Presidential Preference Primary. She also received more votes than the total number of votes cast in the entire Republican Primary in New Madrid County.
| New Madrid County, Missouri | ||
|---|---|---|
| 2008 Republican primary in Missouri | ||
| John McCain | 386 (28.68%) | |
| Mike Huckabee | 656 (48.74%) | |
| Mitt Romney | 250 (18.57%) | |
| Ron Paul | 43 (3.19%) | |
| New Madrid County, Missouri | ||
|---|---|---|
| 2008 Democratic primary in Missouri | ||
| Hillary Clinton | 1,801 (71.19%) | |
| Barack Obama | 610 (24.11%) | |
| John Edwards (withdrawn) | 101 (3.99%) | |
Education
Of adults 25 years of age and older in New Madrid County, 63.6% possess a high school diploma or higher while 9.6% hold a bachelor's degree or higher as their highest educational attainment.
Public schools
- Gideon School District 37 - Gideon
- Gideon Elementary School (K-6)
- Gideon High School (7-12)
- New Madrid County Central R-I School District - New Madrid
- Lilbourn Elementary School (PK-5) - Lilbourn
- Matthews Elementary School (PK-5) - Matthews
- New Madrid County Central Elementary School (PK-5)
- New Madrid County Central Middle School (6-08)
- New Madrid County Central High School (9-12)
- Portageville School District - Portageville
- Portageville Elementary School (PK-5)
- Portageville Middle School (6-8)
- Portageville High School (9-12)
- Risco R-II School District - Risco
- Risco Elementary School (K-6)
- Risco High School (7-12)
Private schools
- St. Eustachius Elementary School - Portageville - (PK-8) - Roman Catholic
- Immaculate Conception School - New Madrid - (PK-8) - Roman Catholic
Alternative/vocational schools
- New Madrid Bend Youth Center - New Madrid - (6-12) - Alternative
- New Madrid R-I Technical Skills Center - New Madrid - (9-12) - Vocational/Technical
Communities
See also
- National Register of Historic Places listings in New Madrid County, Missouri
- New Madrid Floodway Project
- New Madrid Seismic Zone
References
- 1 2 "State & County QuickFacts". United States Census Bureau. Retrieved September 12, 2013.
- ↑ "Find a County". National Association of Counties. Retrieved 2011-06-07.
- ↑ Eaton, David Wolfe (1917). How Missouri Counties, Towns and Streams Were Named. The State Historical Society of Missouri. p. 335.
- ↑ "Full text of "The History of Grundy County, Missouri: An Encyclopedia of Useful Information, and a Compendium of Actual Facts. It contains a condensed history of the state of Missouri and its chief cities ... ; its pioneer record, war history, resources, biographical sketches"". archive.org. Retrieved 2014-02-21.
- ↑ Shoemaker, F.C.; State Historical Society of Missouri (1917). Missouri Historical Review. State Historical Society of Missouri. ISSN 0026-6582.
- ↑ "2010 Census Gazetteer Files". United States Census Bureau. August 22, 2012. Retrieved November 17, 2014.
- ↑ "County Totals Dataset: Population, Population Change and Estimated Components of Population Change: April 1, 2010 to July 1, 2015". Retrieved July 2, 2016.
- ↑ "U.S. Decennial Census". United States Census Bureau. Retrieved November 17, 2014.
- ↑ "Historical Census Browser". University of Virginia Library. Retrieved November 17, 2014.
- ↑ "Population of Counties by Decennial Census: 1900 to 1990". United States Census Bureau. Retrieved November 17, 2014.
- ↑ "Census 2000 PHC-T-4. Ranking Tables for Counties: 1990 and 2000" (PDF). United States Census Bureau. Retrieved November 17, 2014.
- ↑ "American FactFinder". United States Census Bureau. Retrieved 2008-01-31.
External links
- Digitized 1930 Plat Book of New Madrid County from University of Missouri Division of Special Collections, Archives, and Rare Books
 |
Stoddard County | Scott County | Mississippi County | |
| |
Fulton County, Kentucky | |||
| ||||
| | ||||
| Dunklin County | Pemiscot County | Lake County, Tennessee |
Municipalities and communities of New Madrid County, Missouri, United States | ||
|---|---|---|
| Cities | | |
| Village | ||
| Townships |
| |
| Unincorporated communities | ||
| Ghost towns | ||
| Footnotes | ‡This populated place also has portions in an adjacent county or counties | |
Coordinates: 36°35′N 89°40′W / 36.59°N 89.66°W