Navajo Generating Station
| Navajo Generating Station | |
|---|---|
 Navajo Generating Station | |
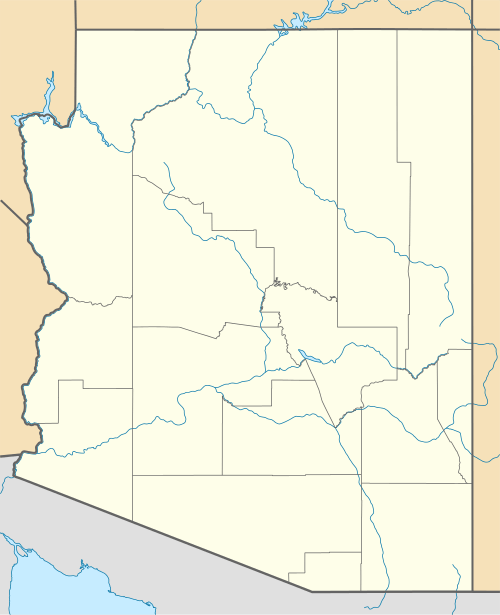 Location of Navajo Generating Station in Arizona | |
| Country | United States |
| Location | Navajo Nation, near Page, Arizona |
| Coordinates | 36°54′12″N 111°23′25″W / 36.90333°N 111.39028°WCoordinates: 36°54′12″N 111°23′25″W / 36.90333°N 111.39028°W |
| Commission date | 1974, 1975, 1976 |
| Owner(s) |
U.S. Bureau of Reclamation (24.3%) Salt River Project (21.7%) Los Angeles Dept. of Water and Power (21.2%) Arizona Public Service (14.0%) NV Energy (11.3%) Tucson Electric Power (7.5%) |
| Operator(s) | Salt River Project |
| Thermal power station | |
| Primary fuel | Coal |
| Power generation | |
| Units operational | 3[1] |
| Nameplate capacity | 2250 MW[2] |
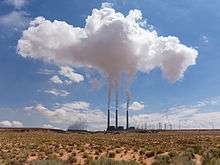
Navajo Generating Station is a 2250 megawatt coal-fired powerplant located on the Navajo Indian Reservation, near Page, Arizona, United States. This plant provides electrical power to customers in Arizona, Nevada, and California. It also provides the power for pumping Colorado River water for the Central Arizona Project, supplying about 1.5 million acre feet (1.85 km3) of water annually to central and southern Arizona. As of 2013 permission to operate as a conventional coal-fired plant is anticipated until December 22, 2044.[3] The Navajo Generating Station is the United States of America's third largest emitter of carbon dioxide.[4]
History
In the 1950s and 1960s, there was a need for new electric generation in the Southwest to supply power to growing populations in southern California, Arizona and Nevada. The US Bureau of Reclamation also needed a large source of power for running the pumps of the planned Central Arizona Project (CAP).
A number of power projects were initially considered to fill these needs, most notably Bridge Canyon and Marble Canyon hydroelectric dams on the Colorado River. However, the proximity of the proposed dams to the Grand Canyon raised opposition, initially from the National Park Service and then more vigorously from a coalition of environmental groups which promoted construction of a thermal or nuclear power plant as an alternative.[5] As a result, the proposed dams were abandoned in favor of the Navajo Power Project, consisting of the Navajo Generating Station (NGS) along with the Kayenta mine, Black Mesa & Lake Powell (BM&LP) Railroad, and 800 miles (1,300 km) of 500 kV transmission lines.

The site selected for the new power plant was about six miles (10 km) east of Glen Canyon Dam and three miles (5 km) south of Lake Powell on 1,786 acres (723 ha) of land leased from the Navajo Nation. The site was close to a source of competitively priced fuel and a reliable source of surface water for cooling. The nearby city of Page and U.S. Highway 89 provided existing infrastructure to support construction and operation of the project. The contract for engineering and construction was awarded to Bechtel Corporation, which began construction on the site in April, 1970.[6] Generating units 1, 2, and 3 were completed in 1974, 1975, and 1976 respectively at a total cost of about $650 million.
Between 1977 and 1990, following Clean Air Act amendments for assessing and protecting visibility in national parks and wilderness areas, the EPA, Salt River Project and other entities cooperated in visibility studies to assess possible effects that NGS emissions might have on those areas.
The series of studies culminated in the Winter Haze Intensive Tracer Experiment (WHITEX) and the Navajo Generating Station Visibility Study (NGSVS). Those studies indicated that controlling SO2 emissions might improve winter visual range in the Grand Canyon by 2% to 7%, which prompted the EPA to propose a rule requiring NGS to reduce SO2 emissions by 70%.
NGS and environmental groups, however, negotiated an approach that would achieve a greater degree of improvement at lower cost. They agreed to, and recommended a requirement of a 90% reduction in SO2 emissions based on an annual average, with installation to be completed in 1999. The EPA accepted the recommendation and implemented those conditions in its final rule.[7]
The technology selected for flue gas desulfurization was wet SO2 scrubbing with forced oxidation. Stone & Webster, the architect-engineering firm for the scrubber project, began construction in 1994 and completed the work on Units 3, 2, and 1 in 1997, 1998, and 1999 respectively.[8] The cost of the scrubber project was about $420 million.
During spring overhauls in 2003 through 2005, the electrostatic precipitators were completely gutted and rebuilt for reliability and optimum performance. The original collecting plates and weighted wire electrodes were replaced with improved collecting plates and rigid discharge electrodes. Control equipment was replaced with upgraded automatic voltage controls and rappers. [9]
In 2007, an analysis of nitrogen oxide (NOx) emissions and control options was conducted for SRP in support of Clean Air Act regional haze reduction efforts, although there were no (NOx) reduction requirements on NGS at the time. The analysis concluded that Low NOx burners with separated overfire air (SOFA) would provide the best available retrofit technology (BART) alternative in accordance with EPA BART guidelines.[10] [11] Consequently, the plant voluntarily installed low NOx-SOFA burners on units 3, 2, and 1 during eight-week outages in February through March 2009, 2010, and 2011 respectively.
Design and specifications
The plant has three identical 750 MW steam electric generating units. Major components of each unit include a boiler, turbine, generator, closed-cycle cooling system, and environmental control equipment.
The boilers are tangentially fired, balanced draft, reheat type steam generators, supplied by Combustion Engineering. Designed for supercritical operation, each boiler supplies up 5,410,000 pounds of steam per hour to the turbines at 3500 psi (241 bar) and 1000 °F (537 °C).[12]
The main turbines are General Electric (GE) tandem compound reheat turbines, each directly coupled to a generator and designed to rotate at 3600 rpm.
Steam discharged from the turbines enters a condenser where water circulating through tubes cools and condenses it, producing a vacuum that maximizes the pressure drop across the turbine. The heat picked up by the circulating water is removed by evaporation in six induced-draft cross flow cooling towers (two per unit). The plant uses about 26,000 acre feet (32,000,000 m3) of water per year from Lake Powell, or about 1/2 gallon (1.9L) per kWh, mainly for cooling water and scrubber operation.[13]
The plant consumes about 8 million tons of low sulfur bituminous coal each year, supplied by Peabody Energy's Kayenta mine near Kayenta, Arizona. The coal is hauled 75 miles from mine silos to the plant by the BM&LP electric railroad that is owned and operated by the plant. Characteristics of the coal in 2011 included a sulfur content of 0.64%, an ash content of 10.6%, and higher heating value (HHV) of 10,774 Btu/lb. [14]:p3
The plant has three 775 ft (236 meter) tall flue gas stacks, listed among the tallest structures in Arizona. The stacks were constructed of reinforced concrete, supporting an internal metal liner. The plant's original stacks were demolished in the late 1990s after being replaced by larger diameter stacks of the same height, resulting in the plant having up to six stacks visible for a time.[15]
[16]
The new stacks were required to accommodate cooler flue gas saturated with water vapor that resulted when wet SO2 scrubbers were added.
Performance
The plant has a net nameplate capacity of 2250 MW or 750 MW per unit, the rated power output leaving the plant through the transmission lines. The gross capacity is 2409.3 (MW) or 803.1 MW per unit, the rated power output at the generator that includes power used internally in the operation of the plant.
Annual net energy generation in 2011 was 16,952 gigawatt-hours (GWh), with a net capacity factor of 86%, while annual gross generation was 18,272 GWh.
Fuel consumed in 2011 provided 170,529,313 MMBtu of heat input, resulting in a net heat rate of 10,060 Btu/ kWh. [14]
Environmental controls
Flue gas emissions
Fly ash particulate is removed from the flue gas by hot-side electrostatic precipitators (ESPs) and SO2 scrubbers. The ESPs, constructed as part of the original plant, remove 99% of particulate. Scrubbers remove an additional 50% of what remains in the flue gas after passing through the ESPs.

Sulfur dioxide (SO2) emissions are controlled by forced oxidation wet scrubbers. The scrubbers consist of two countercurrent–flow absorber vessels on each unit, using limestone slurry sprays to remove more than 92% of SO2 from the flue gas.[12] The three scrubbers in total consume about 24 MW of power, and use 130,000 tons of limestone and 3,000 acre•ft (3,700,000 m3) of water per year, producing 200,000 tons of gypsum per year. [13]
Prior to installation of the scrubbers, SO2 emissions were about 71,000 tons per year. [17]:p.4
Nitrogen oxide emissions are controlled in the combustion process by the use of low- NOx SOFA burners. Prior to 2009 when installation of the new burners began, NOx emissions were about 34,000 tons per year. [18] The new burners reduced NOx emissions by about 14,000 tons per year, or more than 40%.
Fine particulate measuring 2.5 micrometers or less (PM2.5), of concern for its potential effect on health and visibility, primarily results from reactions of SO2 and NOx in the atmosphere to form sulfate and nitrate aerosols. NGS combined permit limits for these precursors has been 0.34 lb/mmBtus, lower than 94% of all U.S. coal steam units, while the actual NGS rate in 2011 was 0.29 lb/ mmBtu. [19]
Mercury emissions in 2011 were 586 lbs or 3.4 lb/ TBtu. [14] [20]
| Component | Rate (lb/mmBtu) | Rate (lb/MWh) | Annual plant total (short tons/year) |
|---|---|---|---|
| SO2 | 0.054 | 0.548 | 4,641 |
| NOx | 0.233 | 2.340 | 19,837 |
| CO2e | 219 | 2,201 | 18,660,820 |
Air quality effects
Northern Arizona and the Colorado Plateau have consistently met National Ambient Air Quality Standards (NAAQS) established to protect public health. [23]
The EPA’s Air Quality Index (AQI), showing air quality on a daily basis, lists no unhealthy days for the general population in all of northern Arizona and southern Utah counties. [24] Unhealthy days for ozone-sensitive groups - those with asthma or lung disease – are also rare in these counties despite high natural background levels in the Intermountain West. Coconino County, with the highest occurrences, averages less than two unhealthy days per year, these occurring between March and June, suggesting a correlation with spring stratospheric ozone intrusions. [25] [26] NGS emissions are unlikely to have contributed to high ozone occurrences, as the plant is located at the northern border of Coconino County, and prevailing southwesterly winds in the spring blow toward counties to the north and east, which have not reported any days with unhealthy ozone levels.[27]:p.82 Moreover, Coconino County’s two ozone monitoring sites – Grand Canyon Hance Camp and Page – show significant differences within the county (the sites being 70 miles apart). During periods when ozone readings have been highest, peak concentrations in Page were noted to be more than 10 percent lower than those at the Grand Canyon.[28]:p.8
Nitrogen dioxide (NO2) levels in the Page area average about 3 ppb, 94 percent lower than the NAAQS standard of 53 ppb. Carbon monoxide (CO) levels have also been far below the standards.[28]:p.11, 8
Fine particulate (PM2.5) levels in the Grand Canyon region have been among the lowest in the nation since before NGS completed installation of SO2 scrubbers and low NOx-SOFA burners.[29] Annual mean levels for PM2.5 in the Page area are about 3 micrograms/cubic meter (µg/m3) - one quarter of the NAAQS standard of 12 µg/m3 and as low or lower than the cleanest U.S. cities listed by the World Health Organization.[30]:p.206 [31]
Visibility in the Grand Canyon region has also been among the best in the nation since before NGS installed scrubbers and low NOx-SOFA burners.[29] Within Coconino County, visibility is generally better in the Page/ Glen Canyon area at the north end of the county than at the Grand Canyon and areas further south (Sunset Crater, Walnut Canyon, Wupatki National Monuments). Visibility in the Page/ Glen Canyon area averages 3.5 deciviews above natural background conditions, within less than one deciview of the best visibility listed in the contiguous U.S. (The DV scale is near zero for a pristine atmosphere, with a change of one deciview being a just noticeable change.) [32] [33]
In 2012, a fish consumption advisory was issued for striped bass in lower Lake Powell, raising concerns about mercury emissions from the plant.[34] NGS emissions, however, are found to contribute less than 2% of atmospheric deposition of mercury on the Colorado River watershed.[35]:p.E-2 Atmospheric deposition, furthermore, accounts for only a part of the mercury loading, much of it coming from natural geological deposits. The natural weathering of rock in the Green River catchment, for example, alone contributes about 40% of the mercury loading in Lake Powell. [36]
Future requirements
The EPA’s Mercury and Air Toxics Standard (MATS), slated to take effect in 2015, will require that the plant reduce mercury emissions to 1.2 lb/ TBtu or 0.013 lb/ gross GWh. [37]
On January 4, 2013, Department of the Interior, the EPA, and Department of Energy, announced plans to jointly develop a plan for the future of the plant that maintains its energy, water, and economic benefits. The plan would outline short term investments in the plant to meet environmental goals, and long term plans for transitioning to cleaner energy options, such that short term and long term plans work together.[38]
On January 17, 2013, the EPA proposed a BART ruling to further reduce NOx emissions:
The Environmental Protection Agency (EPA) is proposing a source-specific federal implementation plan (FIP) requiring the Navajo Generating Station (NGS), located on the Navajo Nation, to reduce emissions of oxides of nitrogen (NO X) under the Best Available Retrofit Technology (BART) provision of the Clean Air Act (CAA or Act) in order to reduce visibility impairment resulting from NGS at 11 National Parks and Wilderness Areas. NGS, which was built over 35 years ago, is the largest coal-fired power plant in the West in terms of generating capacity. It is central to the economies of the Navajo Nation and Hopi Tribe and supplies power to the states of Arizona, Nevada, and California. Electricity produced by NGS is also used to power the Central Arizona Project, which supplies surface water to three counties and numerous Indian tribes in Arizona. NGS is projected to continue operating at least until 2044. EPA is proposing to require NGS to achieve a nearly 80 percent reduction of its current overall NO X emission rate. Our analysis indicates that installation of controls to achieve this reduction would result in significant visibility improvement that is well-balanced with the cost of those controls. For a number of reasons, including the importance of NGS to numerous Indian tribes located in Arizona and the federal government's reliance on NGS to meet the requirements of water settlements with several tribes, EPA is proposing an alternative to BART that would provide flexibility to NGS in the schedule for the installation of new control equipment. We also describe other compliance schedules for consideration and comment. We recognize that there may be other approaches that could result in equivalent or better visibility benefits over time and that there may be changes in energy demand, supply or other developments over the next several decades that may change electricity generation on the Navajo Nation. EPA encourages a robust public discussion of our proposed BART determination and alternative, the additional alternatives described herein, and other possible approaches. EPA is prepared to issue a supplemental proposal if approaches other than the proposed BART determination or proposed alternative articulated in this notice are identified as satisfying the requirements of the Clean Air Act and meeting the needs of the stakeholders. EPA is committed to continuing to engage with stakeholders to develop a final FIP that maintains benefits to tribes and the regional economy while improving visibility in many of our nation's most treasured National Parks and Wilderness Areas.[39]
The ruling would require the plant to reduce NOx emissions to no more than 0.055 lb/ MMBtu by 2023, necessitating the installation of Selective Catalytic Reduction (SCR) equipment. The SCRs would need to reduce NOx by about 15,000 tons per year. Along with the existing Low-NOx burners, the total reduction would be about 29,000 tons per year below 2008 levels.
The SCRs would use a catalyst and ammonia to react with NOx to form diatomic nitrogen and water. SCRs would also increase sulfuric acid mist levels by causing SO2 to oxidize to SO3. The high sulfuric acid levels could require dry sorbent injection (DSI) – a system that injects a powdered sorbent such as trona to absorb the acid mist - and the addition of baghouses and booster fans to capture the resulting particulate. [41]:p.1-1, 3-8
SCRs without baghouses are expected to cost about $600 million to construct and about $12 million per year to operate and maintain. SCRs with baghouses would cost about $1.1 billion to construct and about $20 million per year to operate and maintain.[41]:p.9-4,9-7
The SCRs by themselves would need about 15 MW to operate, requiring the burning of an additional 50,000 tons of coal per year and increasing CO2 emissions by 125,000 tons per year. If baghouses are also needed, the systems would need about 30 MW to operate, requiring an additional 100,000 tons of coal per year and increasing CO2 emissions by 250,000 tons per year.[41]:p.4–8 The operation would also consume some 40,000 pounds of anhydrous ammonia daily.[41]:p.2-1
The plant faces a number of hurdles to retrofitting SCRs in the allotted time. Before the plant’s owners can invest in SCRs, they will have to resolve the site lease, rights-of-way for the railroad, transmission and water lines, and the coal supply agreement. One participant – LADWP – cannot invest in the improvements due to California law prohibiting long term investment in coal-fired power plants, and plans to sell its share in the plant by 2015.[42] NV Energy announced it also intends to pull out of participation in the plant, planning to divest its interest by 2019. Extension of the plantsite lease with the Navajo Nation requires the approval of the Secretary of the Interior, who cannot approve it until environmental assessments required by the National Environmental Policy Act (NEPA) and the Endangered Species Act (ESA) are completed. The current lease expires in 2019 and the environmental assessments are expected to take about five years to complete.
After the EPA issued a proposed BART rule[39] it solicited input from stakeholders: the Department of the Interior, the Central Arizona Project, the Navajo Nation, the Gila River Indian Community, the Salt River Project, the Environmental Defense Fund, and Western Resources Advocates who as a technical working group negotiated a "Reasonable Progress Alternative to BART" which was submitted by the Department of the Interior to the EPA on July 26, 2013, for consideration in development of a final rule:[3][43]
The Parties shall submit this Agreement to EPA and request that EPA: adopt the Reasonable Progress Alternative to BART set forth in Appendix B as the Final BART Rule;[44]
The agreement contains a commitment by the current owners of NGS to cease their operation of conventional coal-fired generation at NGS no later than December 22, 2044.[3]
Wastewater handling
NGS was built with one of the first zero liquid discharge (ZLD) systems in a power plant, recovering all cooling tower blow-down and runoff from developed areas of the site. The waste water is processed through three brine concentrators and a crystallizer, which remove the solids and produce distilled water for re-use within the plant.[45] Several lined ponds are used in conjunction with the ZLD system to capture and regulate the flow of waste water to the system.
Byproducts handling
The plant sells about 500,000 tons of fly ash per year for use in the manufacture of concrete and Flexcrete insulating block building product.[46] Bottom ash and gypsum, a byproduct of the scrubber operation, are dewatered in the removal process; and, along with any fly ash not sold, are landfilled on-site as solids. No wet impoundments are used for ash or byproduct disposal.
The plant's ash handling contract requires the landfilled ash be covered with a minimum of two feet of native soil cover at closure, and be contoured to contain a 100-year storm runoff event to prevent erosion, although the original lease had only specified covering it with six inches of native soil. [47]:p.11 [48]:p.35
Economic aspects

Economic benefits of the plant result from NGS wages and site leases, as well as Kayenta Mine wages and royalties that result from NGS coal purchases, NGS being the sole source of revenue for the mine. The plant and mine annually pay out about $100 million in direct wages and $50 million in leases and royalties.
Plant employment, leases, and payments
NGS has 538 employees, and pays about $52 million per year in total wages. [27]:p.93
NGS leases 1,786 acres for the plant site from the Navajo Nation. [48]
Rights-of-way and easements on tribal lands, permitted under a 25 U.S.C. §323 grant, include the plant site, 78 miles of railroad right-of-way covering 1,309 acres, and 96 miles of transmission line right-of-way covering 3,850 acres. [48] [49] [50] [51] [52] [53]
Annual lease payments to the Navajo Nation were $608,000 as of 2012, comparable to utility leases and land sales elsewhere in the region. [54] [55] [56]:p.22 [57]
Air permit fees paid to the Navajo Nation EPA are about $400,000 per year.[27]:p.100
Property taxes paid to the State of Arizona are about $4.8 million per year. Since 2011, payments in lieu of taxes have also been paid to the Navajo Nation at half the Arizona tax rate, or about $2.4 million per year. [58]
Lease extension
Plant owners and the Navajo Nation negotiated terms for a 25-year extension to the original lease that ends in December 2019. Proposed lease payments under the extended lease would increase to $9 million per year beginning in 2020. The terms also include ‘Additional Payments’ in lieu of taxes and other compensation, starting at $10 million per year following approval by the tribe and escalating to $34 million in 2020, although prorated if one or more units are retired or permanently de-rated. [58] Payment terms, stated in 2011 dollars, would be adjusted annually based on the consumer price index (CPI). Due to CPI adjustments, actual payments by 2020 had been projected to be around $52 million/year. [59]:p.8
Mine employment and royalties
The Kayenta mine has 430 employees, and pays about $47 million per year in total wages.
Coal royalties are paid at 12.5% of gross proceeds, as on federal BLM lands. [60] The royalties and other mine payments amount to about $50 million per year, $37 million paid to the Navajo Nation and $13 million to the Hopi tribe. [27]:p.V,95
Impact on regional economies
NGS and Kayenta Mine payments in 2012 accounted for about a quarter of the Navajo Nation’s revenues, and 65% of the Hopi Tribe’s revenues. [61]:p.6 [62]:p.24 Native American tribal members, mainly Navajo, make up 83% of plant employees and 93% of mine employees, resulting in about 850 direct tribal positions. [27]:p.93
Indirectly, plant and mine operations support the equivalent of about 1,600 full-time positions.[27]:p.IV,106 With increased lease and royalty payments, by 2020 the plant and mine had been expected to generate more than 2,100 indirect jobs for the Navajo Nation alone, if all three units continued running.[59]:p.1
The cumulative economic impact on the state of Arizona as a whole for the time period 2011 - 2044 was expected to be $20 billion in gross state product, or about $330 million per year in disposable income and $20 million per year in state tax revenues, also assuming all three units continued running. [63]:p.23
Regional effects of installing SCR and baghouses would include increasing CAP water rates by as much as 32% for agricultural users and Indian tribes. If the plant were to shut down, those rates were expected to increase as much as 66%. [27]:p.V,68
In 2012, NGS and the Navajo Tribal Utility Authority (NTUA) formed a partnership to extend electrical power to 62 homes in the area surrounding the nearby community of LeChee. Since NGS participants have no jurisdiction for supplying electricity on the reservation (that authority belonging solely to the NTUA), NGS and the NTUA would jointly fund the project, and the NTUA would build it. [64]
Water service contract
Water used by the plant is supplied from Arizona’s annual allocation of 50,000 acre-feet of upper basin Colorado River water through Water Service Contract No. 14-06-400-5003 with the U.S. Bureau of Reclamation and Arizona Department of Water Resources permit A-3224. [47]:p.3 [65] Water payment rate had been $7 an acre-foot, resulting in payments to the U.S. of about $180,000 per year. [66]:p.7 Payments were set to increase to $90 an acre-foot in 2014, or about $2.4 million per year. By comparison, water rates and leases in the Four Corners region are typically $40 to $155 per acre-foot. [67] [68] [69] [70]
References
- ↑ "Existing Electric Generating Units in the United States, 2007" (Excel). Energy Information Administration, U.S. Department of Energy. 2007. Retrieved 2009-07-09.
- ↑ "Navajo Generating Station". SRP. Retrieved 2013-01-04.
- 1 2 3 "Historic Agreement Reached for Navajo Generating Station: Plan Proposes Collaborative Path Forward for Reduced Emissions, Continued Power Generation, and Clean Energy Development" (press release). Department of the Interior. July 26, 2013. Retrieved July 27, 2013.
- ↑ "How A Historical Blunder Helped Create The Water Crisis In The West". npr.org.
- ↑ Jennifer E. Zuniga (2000). "The Central Arizona Project" (PDF). Bureau of Reclamation History Program. U.S. Bureau of Reclamation. Retrieved 2011-06-01.
- ↑ "Chapter I. Introduction and History of the Navajo Project". Environmental Planning for the Navajo Generating Station Status Report. Prepared by Bechtel Corporation, The Navajo Project. 1970. pp. 1–3. OCLC 4711442.
- ↑ Mike Sundblom, Arizona Department of Environmental Quality. "RA BART (Reasonably Attributable Best Available Retrofit Technology) Case Study, Navajo Generating Station, Appendix C". prepared for WESTAR (Western States Air Resources Council) RA BART Working Group. Western Regional Air Partnership. Retrieved 2011-08-22.
- ↑ "Part 71 Federal Operating Permit Statement of Basis – Navajo Generating Station, Permit No. NN-ROP-05-06" (PDF). Navajo Nation Environmental Protection Agency. 2006. p. 2. Retrieved 2011-08-27.
- ↑ Robert Candelaria (2004-06-01). "Detailed Planning Saves Six Weeks in Precipitator Retrofit Schedule". Power Engineering magazine. Retrieved 2012-09-26.
- ↑ ENSR Corporation - AECOM (2007). "BART Analysis for the Navajo Generating Station Units 1 - 3" (PDF). Western Regional Air Partnership. pp. 6–1 & 6–2. Retrieved 2011-08-27.
- ↑ "Federal Register 40 CFR Part 51: Regional Haze Regulations and Guidelines for Best Available Retrofit Technology (BART) Determinations" (PDF). United States Environmental Protection Agency. 2005-07-06. Retrieved 2012-07-26.
- 1 2 "Annual Electric Generator Report EIA-860 for 2011". U.S. Energy Information Administration. Retrieved 2012-10-03.
- 1 2 "Arizona Portion of the Upper Colorado River Basin Consumptive Uses and Losses Reports". U.S. Bureau of Reclamation. 1996–1999. Retrieved 2013-04-04.
- 1 2 3 "Power Plant Operations Report EIA-923 for 2011 (generation and fuel data)". U.S. Energy Information Administration. Retrieved 2012-10-30.Plant ID 4941
- ↑ Doug Sherman. "Navajo power plant being retrofit with SO2 scrubber smoke stacks (Photo showing six stacks, one unit in operation with un-scrubbed flue gas coming out of its original stack.)". Pbase photo gallery. Retrieved 2011-07-07.
- ↑ Doug Sherman. "Navajo coal powered electric generating plant with sulfur dioxide scrubbers (Photo showing last original stack being dismantled, and flue gas saturated with water vapor being emitted from new stacks due to scrubber operation.)". Pbase photo gallery. Retrieved 2011-07-07.
- ↑ "Estimated Benefits and Costs of the Navajo Generating Station's (SO2) Emissions Limit, Report# GAO/RCED-98-28" (PDF). U.S. General Accounting Office. January 1998. Retrieved 2013-01-16.
- ↑ "National Emissions Inventory (Facility Emissions Summaries - Facility-level by Pollutant database)". U.S. Environmental Protection Agency. 2008. Retrieved 2012-04-18.
- ↑ "EPA National Electric Energy Data System (NEEDS) Version 4.10 Ptox Database". U.S. Environmental Protection Agency. Retrieved 2012-09-28.
- ↑ "EPA Toxics Release Inventory Program". U.S. Environmental Protection Agency. 2011. Retrieved 2013-01-03.
- ↑ "Coal Unit Characteristics 2011". U.S. Environmental Protection Agency. 2012. Retrieved 2012-12-26.
- ↑ "2011 Greenhouse Gas Emissions from Large Facilities". U.S. Environmental Protection Agency. Retrieved 2013-04-15.
- ↑ "Green Book – Counties Designated Nonattainment for Clean air Act's National Ambient Air Quality Standards map". U.S. Environmental Protection Agency. Retrieved 2012-09-19.
- ↑ "AirCompare County and State Air Quality Comparisons, Monthly Averages". U.S. Environmental Protection Agency. 2007–2011. Retrieved 2012-09-19.
- ↑ "Background Ozone in the U.S. - WESTAR Conference on Western Ozone Transport" (PDF). Western States Air Resources Council (WESTAR). 2012-10-11. Retrieved 2013-02-03.
- ↑ Zhang, Lin; Jacob, Daniel J.; Downey, Nicole V.; Wood, Dana A.; Blewitt, Doug; Carouge, Claire C.; van Donkelaar, Aaron; Jones, Dylan B.A.; Murray, Lee T.; Wang, Yuxuan (December 2011). "Improved Estimate of the Policy-Relevant Background Ozone in the United States using the GEOS-Chem Global Model over North America" (PDF). Atmospheric Environment. 45 (37): 6772–6774. doi:10.1016/j.atmosenv.2011.07.054.
- 1 2 3 4 5 6 7 "Navajo Generating Station and Air Visibility Regulations: Alternatives and Impacts" (PDF). National Renewable Energy Laboratory. 2012-01-08. Retrieved 2012-07-09.
- 1 2 "Air Quality Sustainability Program in Coconino County" (PDF). Arizona Department of Transportation. 2004-07-15. Retrieved 2011-09-27.
- 1 2 "US Annual Spatial and Seasonal Patterns of PM2.5, Light Extinction and Contributions of Major Aerosol Types, 1996 – 1998". Colorado State University - Interagency Monitoring of Protected Visual Environments (IMPROVE) program. Retrieved 2011-06-27. Note: Fine particulate PM-2.5 is shown by clicking on Grand Canyon’s location on the map and selecting "Fine Mass" from dropdown box above the map. Visibility is indicated by selecting "Deciview" or "Visual Range" from the dropdown box.
- ↑ P. McMurry, M. Shepherd, and J. Vickery, eds. (April 2004). "Particulate Matter Science for Policy Makers: A NARSTO Assessment" (PDF). Cambridge University Press. Retrieved 2013-01-02.
- ↑ "WHO Urban Outdoor Air Pollution Database". World Health Organization. September 2011. Retrieved 2011-12-13.
- ↑ "IMPROVE Newsletter" (PDF). Cooperative Institute for Research in the Atmosphere (CIRA), Colorado State University. April 1993.
- ↑ "5-Year Average Visibility Estimates for 2006 – 2010 (comparing Coconino County sites GLCA, GRCA, SUCR, WACA, and WUPA)" (PDF). National Park Service. 2012-04-10. Retrieved 2013-01-14.
- ↑ "Utah Fish Consumption Advisory for Striped Bass in Lake Powell - Fact Sheet" (PDF). State of Utah. 2012-10-25. Retrieved 2013-01-22.
- ↑ "Kayenta Mine Permit Renewal Environmental Assessment, Appendix E - Atmospheric deposition of metals from Navajo Generating Station" (PDF). Office of Surface Mining Reclamation and Enforcement. August 2011. Retrieved 2012-09-10.
- ↑ "Colorado River Ecology and Dam Management Symposium Proceedings". National Academies Press. 1990-05-24. Retrieved 2012-12-10.
- ↑ "Federal Register vol. 77, no. 32, Feb 16, 2012, page 9367" (PDF). U.S. Government Printing Office. 2012-02-16. Retrieved 2013-01-04.
- ↑ "Joint Federal Agency Statement Regarding Navajo Generating Station" (PDF). U.S. Environmental Protection Agency. 2013-01-04. Retrieved 2013-01-04.
- 1 2 "Proposed rule.". Regulations.gov. February 5, 2013. Retrieved July 27, 2013.
- ↑ "EPA Pacific Southwest Air Actions, Navajo Nation". U.S. Environmental Protection Agency. 2013-01-17. Retrieved 2013-01-04.
- 1 2 3 4 "Navajo Generating Station SCR and Baghouse Capital Cost Estimate Report, S&L report# SL-010214, revision D" (PDF). Salt River Project. 2010-08-17. Retrieved 2011-10-26.
- ↑ "State of California Senate Bill No. 1368" (PDF). California Energy Commission. 2006-09-29. Retrieved 2013-04-02.
- ↑ ICTMN Staff (July 26, 2013). "Coming Clean: Historic Agreement Reached for Navajo Generating Station". Indian Country Today. Retrieved July 27, 2013.
- ↑ "TECHNICAL WORK GROUP AGREEMENT RELATED TO NAVAJO GENERATING STATION (NGS)" (contract). Department of the Interior. July 25, 2013.
- ↑ "GE Water & Process Technologies – RCC Thermal Products & ZLD" (PDF). General Electric. Retrieved 2011-05-20.
- 1 2 "ISG Replacement Agreement for Management of Ash and Other Byproducts Generated at Navajo Generating Station". 2002-01-01.
- 1 2 3 "Navajo Project Indenture of Lease, Navajo Units 1, 2 and 3". EN3 Professionals, LLC. 1969-12-22. Retrieved 2013-05-24.
- ↑ "U.S. Code Title 25 Chapter 8 – Rights-of-Way through Indian Lands". U.S. House of Representatives. Retrieved 2013-06-04.
- ↑ "Application and Grant of Rights-of-Way and Easements (25 U.S.C. §323) Navajo Project". EN3 Professionals, LLC. 1969-05-27. Retrieved 2013-05-24.
- ↑ "Application for Federal Right-of-Way and Easements (Navajo Project Coal Haul Railroad)". EN3 Professionals, LLC. 1970-09-24. Retrieved 2013-05-24.
- ↑ "Grant of Federal Rights-of-Way and Easements (25 U.S.C. §323) Navajo Project Coal Haul Railroad". EN3 Professionals, LLC. 1971-01-19. Retrieved 2013-05-24.
- ↑ "Supplemental Agreement to the Navajo Project Coal Haul Railroad Right-of-Way granted January 19, 1971". EN3 Professionals, LLC. 1973-09-17. Retrieved 2013-05-24.
- ↑ Linear rights-of-way on federal BLM land in Coconino county lease for about $8.50 an acre per year. BLM leases for non-linear easements in Coconino County are twice the linear right-of-way rate.
- ↑ "Bureau of Land Management Update of Linear Right-of-Way Schedule; Final Rule (county zones on page 65076, rent schedules on page 65051)" (PDF). U.S. Bureau of Land Management. 2008-10-31. Retrieved 2013-04-09.
- ↑ Raymond Max; Scott Prosuch; Annette Blue (2011-08-23). "Paragon-Bisti Solar Energy Ranch Feasibility Study" (PDF). U.S. Department of Energy.
- ↑ Conor Shine (2013-07-14). "Company dumps big Laughlin solar project, says market won't support it (ENN Mohave Energy Solar Project)". Las Vegas Sun. Retrieved 2013-07-15.
- 1 2 "Navajo Nation Council Summer Session 2013, Legislation No. 0177-13 (beginning at minute 44:24)". Navajo Nation Office of Broadcast Services. 2013-07-17. Retrieved 2013-07-17.
- 1 2 A. Evans; T. James; Melissa Gamez & Eva Madly (2013-04-09). "Navajo Generating Station & Kayenta Mine: An Economic Impact Analysis for the Navajo Nation" (PDF). L. William Seidman Research Institute, W.P. Carey School of Business, Arizona State University. Retrieved 2013-04-10.
- ↑ "U.S. Bureau of Land Management Coal Operations". U.S. Bureau of Land Management. 2010-12-03. Retrieved 2011-09-06.
- ↑ "Navajo Nation Fiscal Year 2013 Budget Presentation" (PDF). Navajo Nation Office of Management and Budget. 2012-07-06. Retrieved 2013-07-11.
- ↑ "Comments on NREL Phase 1 Report (Navajo Generating Station and Air Visibility Regulations: Alternatives and Impacts)" (PDF). U.S. Department of the Interior. 2012. Retrieved 2012-07-09.
- ↑ M. Croucher, A. Evans & T. James (2012-02-02). "Navajo Generating Station and Kayenta Mine: An Economic Impact Study" (PDF). L. William Seidman Research Institute, W.P. Carey School of Business, Arizona State University. Retrieved 2012-08-22.
- ↑ "NTUA & NGS Create Partnership for LeChee Community" (PDF). Navajo Tribal Utility Authority. 2012-02-06. Retrieved 2012-11-12.
- ↑ "The Law of the River". U.S. Bureau of Reclamation. Retrieved 2010-05-01.
- ↑ "Glen Canyon Unit Colorado River Storage Project Contract for Water Service from Lake Powell (for the Navajo Power Project)". EN3 Professionals LLC. 1969-01-17. Retrieved 2013-06-20.
- ↑ Bob Phillips (2008-06-24). "LeChee, (U.S. Bureau of) Reclamation negotiate water deal". Lake Powell Chronicle. Retrieved 2013-04-22.
- ↑ "Water Service Contract between The United States and the Navajo Nation/ NTUA, Final Environmental Assessment and FONSI (950 acre-feet for the community of LeChee, Arizona)". U.S. Bureau of Reclamation. May 2009. Retrieved 2013-04-22.
- ↑ "Central Arizona Project Final Water Rate Schedule 2013 – 2018" (PDF). Central Arizona Project. 2012-06-07. Retrieved 2013-04-29.
- ↑ Jennifer Adams; Dotti Crews; Ronald Cummings (April 2004). "The Sale and Leasing of Water Rights in Western States: an Update to Mid-2003" (PDF). Georgia State University. Retrieved 2013-04-22.
External links
| Wikimedia Commons has media related to Navajo Generating Station. |
- SRP Website
- NGS Website
- NGS Plant Tour Brochure with process diagram and description
- Navajo Generating Station Chimneys at Structurae
- Google Earth
- NPR.org - How a Historical Blunder Helped Create the Water Crisis in the West

