Natural gas prices


Natural gas prices, as with other commodity prices, are mainly driven by supply and demand fundamentals. However, natural gas prices may also be linked to the price of crude oil and/or petroleum products, especially in continental Europe.[1][2] Natural gas prices in the US had historically followed oil prices, but in recent years have decoupled from oil and are now trending somewhat with coal prices.[3]
The current surge in unconventional oil and gas in the U.S. has resulted in lower gas prices in the U.S. This has led to discussions in Asian oil-linked gas markets to import gas based on the Henry Hub index[4] (until very recently the most widely used reference for US natural gas prices).[5]
Depending on the marketplace, the price of natural gas is expressed in US dollars (or other currency) per 1 million British thermal units (MMBtu), million cubic feet (Mcf), or 1,000 cubic meters. Note that, for natural gas price comparisons, $ per MMBtu multiplied by 1.025 = $ per Mcf of pipeline-quality gas, which is what is delivered to consumers. For rough comparisons, one million Btu is approximately equal to a thousand cubic feet of natural gas.[6] Pipeline-quality gas has a BTU value slightly higher than that of pure methane, which has 1,012 BTU per cubic foot. Natural gas as it comes out of the ground is most often predominantly methane, but may have a wide range of BTU values, from much lower (due to dilution by non-hydrocarbon gasses) to much higher (due to the presence of ethane, propane, and heavier compounds) than standard pipeline-quality gas.[7]
U.S. market mechanisms
The natural gas market in the United States is split between the financial (futures) market, based on the NYMEX futures contract, and the physical market, the price paid for actual deliveries of natural gas and individual delivery points around the United States. Market mechanisms in Europe and other parts of the world are similar, but not as well developed or complex as in the United States.
Futures market
The standardized NYMEX natural gas futures contract is for delivery of 10,000 mmBtu (10,000 million Btu) of energy (approximately 10,000,000 cubic feet (280,000 m3) of gas) at Henry Hub in Louisiana over a given delivery month consisting of a varying amount of days. As a coarse approximation, 1000 ft3 of natural gas ≈ 1 MMBtu ≈ 1 GJ. Monthly contracts expire 3–5 days in advance of the first day of the delivery month, at which points traders may either settle their positions financially with other traders in the market (if they have not done so already) or choose to "go physical" and accept delivery of physical natural gas (which is actually quite rare in the financial market).
It should be noted that most financial transactions for natural gas actually take place off exchange in the over-the-counter ("OTC") markets using "look alike" contracts that match the general terms and characteristics of the NYMEX futures contract and settle against the final NYMEX contract value, but that are not subject to the regulations and market rules required on the actual exchange.
It is also important to note that nearly all participants in the financial gas market, whether on or off exchange, participate solely as a financial exercise in order to profit from the net cash flows that occur when financial contracts are settled among counterparties at the expiration of a trading contract. This practice allows for the hedging of financial exposure to transactions in the physical market by allowing physical suppliers and users of natural gas to net their gains in the financial market against the cost of their physical transactions that will occur later on. It also allows individuals and organizations with no need or exposure to large quantities of physical natural gas to participate in the natural gas market for the sole purpose of gaining from trading activities.
In 2015-Nov Henry Hub Natural Gas Spot price was - 2.09 за Million Btu ($77,133 per thousand cubic meters) [8]
Physical market
Generally speaking, physical prices at the beginning of any calendar month at any particular delivery location are based on the final settled forward financial price for a given delivery period, plus the settled "basis" value for that location (see below). Once a forward contract period has expired, gas is then traded daily in a "day ahead market" wherein prices for any particular day (or occasional 2-3 day period when weekends and holidays are involved) are determined on the preceding day by traders using localized supply and demand conditions, in particular weather forecasts, at a particular delivery location. The average of all of the individual daily markets in a given month is then referred to as the "index" price for that month at that particular location, and it is not uncommon for the index price for a particular month to vary greatly from the settled futures price (plus basis) from a month earlier.
Many market participants, especially those transacting in gas at the wellhead stage, then add or subtract a small amount to the nearest physical market price to arrive at their ultimate final transaction price.
Once a particular day's gas obligations are finalized in the day-ahead market, traders (or more commonly lower-level personnel in the organization known as, "schedulers") will work together with counterparties and pipeline representatives to "schedule" the flows of gas into ("injections") and out of ("withdrawals") individual pipelines and meters. Because, in general, injections must equal withdrawals (i.e. the net volume injected and withdrawn on the pipeline should equal zero), pipeline scheduling and regulations are a major driver of trading activities, and quite often the financial penalties inflicted by pipelines onto shippers who violate their terms of service are well in excess of losses a trader may otherwise incur in the market correcting the problem.
Basis market
Because market conditions vary between Henry Hub and the roughly 40 or so physical trading locations around United States, financial traders also usually transact simultaneously in financial "basis" contracts intended to approximate these difference in geography and local market conditions. The rules around these contracts - and the conditions under which they are traded - are nearly identical to those for the underlying gas futures contract.
Derivatives and market instruments
Because the U.S. natural gas market is so large and well developed and has many independent parts, it enables many market participants to transact under complex structures and to use market instruments that are not otherwise available in a simple commodity market where the only transactions available are to purchase or sell the underlying product. For instance, options and other derivative transactions are very common, especially in the OTC market, as are "swap" transactions where participants exchange rights to future cash flows based on underlying index prices or delivery obligations or time periods. Participants use these tools to further hedge their financial exposure to the underlying price of natural gas.
Natural gas demand
The demand for natural gas is mainly driven by the following factors:
- Weather
- Demographics
- Economic growth
- Fuel competition
- Storage
- Exports
| Sector | 2005 (Bcf) |
|---|---|
| US residential | 4,838 |
| US commercial | 3,057 |
| US industrial | 6,608 |
| US electric power | 5,797 |
| US other | 1,650 |
| Total US demand | 21,950 |
| US LNG exports | 65 |
| US exports to Mexico | 305 |
| Total US gas disposition | 22,320 |
| Canada residential | 602 |
| Canada commercial | 442 |
| Canada industrial/power | 1,428 |
| Total Canadian demand | 2,472 |
| Total N.A. demand | 24,421 |
| Total N.A. disposition | 24,791 |
Weather
Weather conditions can signiciantly affect natural gas demand and supply. Cold temperatures in the winter increase the demand for space heating with natural gas in commercial and residential buildings.
Natural gas demand usually peaks during the coldest months of the year (December–February) and is lowest during the "shoulder" months (May–June and September–October). During the warmest summer months (July–August), demand increases again. Due to the shift in population in the United States toward the sun belt, summer demand for natural gas is rising faster than winter demand.
Temperature effects are measured in terms of 'heating degree days' (HDD) during the winter, and 'cooling degree days'(CDD) during the summer. HDDs are calculated by subtracting the average temperature for a day from 65 degrees. Thus, if the average temperature for a day is 50 degrees, there are 15 HDDs. If the average temperature is above 65 degrees, HDD is zero.
Cooling degree days are also measured by the difference between the average temperature and 65 degrees. Thus, if the average temperature is 80 degrees, there are 15 CDDs. If the average temperature is below 65 degrees, CDD is zero.
Hurricanes can affect both the supply of and demand for natural gas. For example, as hurricanes approach the Gulf of Mexico, offshore natural gas platforms are shut down as workers evacuate, thereby shutting in production. In addition, hurricanes can also cause severe destruction to offshore (and onshore) production facilities. For example, Hurricane Katrina (2005) resulted in massive shut-ins of natural gas production.
Hurricane damage can also reduce natural gas demand. The destruction of power lines interrupting electricity produced by natural gas can result in significant reduction in demand for a given area (e.g., Florida).
Demographics
Changing demographics also affects the demand for natural gas, especially for core residential customers. In the US for instance, recent demographic trends indicate an increased population movement to the Southern and Western states. These areas are generally characterized by warmer weather, thus we could expect a decrease in demand for heating in the winter, but an increase in demand for cooling in the summer. As electricity currently supplies most of the cooling energy requirements, and natural gas supplies most of the energy used for heating, population movement may decrease the demand for natural gas for these customers. However, as more power plants are fueled by natural gas, natural gas demand could in fact increase.
Economic growth
The state of the economy can have a considerable effect on the demand for natural gas in the short term. This is particularly true for industrial and to a lesser extent the commercial customers. When the economy is booming, output from the industrial sectors generally increases. On the other hand, when the economy is experiencing a recession, output from industrial sectors drops. These fluctuations in industrial output accompanying the economy affects the amount of natural gas needed by these industrial users. For instance, during the economic recession of 2001, U.S. natural gas consumption by the industrial sector fell by 6 percent.[10]
Fuel competition
Supply and demand dynamics in the marketplace determine the short term price for natural gas. However, this can work in reverse as well. The price of natural gas can, for certain consumers, affect its demand. This is particularly true for those consumers who have the ability to switch the fuel which they consume. In general the core customers (residential and commercial) do not have this ability, however, a number of industrial and electric generation consumers have the capacity to switch between fuels. For instance, when natural gas prices are extremely high, electric generators may switch from using natural gas to using cheaper coal or fuel oil. This fuel switching then leads to a decrease for the demand of natural gas, which usually tends to drop its price.
Storage
North American natural gas injections (positive) represent additional demand and compete with alternative uses such as gas for heating or for power generation. Natural gas storage levels significantly affect the commodity’s price. When the storage levels are low, a signal is being sent to the market indicating that there is a smaller supply cushion and prices will be rising. On the other hand, when storage levels are high, this sends a signal to the market that there is greater supply flexibility and prices will tend to drop.
Exports
Exports are another source of demand. In North America, gas is exported within its forming countries, Canada, the US and Mexico as well as abroad to countries such as Japan.

Natural gas supply
The supply for natural gas is mainly driven by the following factors:
- Pipeline capacity
- Storage
- Gas drilling rates
- Natural phenomena
- Technical issues
- Imports
- Transportation Wholesale Rates
| 2005 (Bcf) | |
|---|---|
| Total US production | 18,243 |
| Total Canada production | 6,022 |
| Total N.A. production | 24,265 |
| US imports and supplementals | 340 |
| Total N.A. supply | 24,605 |
Pipeline capacity
The ability to transport natural gas from the well heads of the producing regions to the consuming regions affects the availability of supply in the marketplace. The interstate and intrastate pipeline infrastructure has limited capacity and can only transport so much natural gas at any one time. This has the effect of limiting the maximum amount of natural gas that can reach the market. The current pipeline infrastructure is quite developed, with the EIA estimating that the daily delivery capacity of the grid is 119×109 cu ft (3.4×10⁹ m3).[12] However, natural gas pipeline companies should continue to expand the pipeline infrastructure in order to meet growing future demand. The coming addition of the Canadian Pipeline looks to provide additional resources for the North American populace CommercialNG.com [13][14]
Storage
As natural gas injections (positive) represent additional demand, withdrawals (negative) represent an additional source of supply which can be accessed quickly. The more storage banks like shale deposits used give more cushion for the natural gas markets.
Gas drilling rates
The amount of natural gas produced both from associated and non-associated sources can be controlled to some extent by the producers. The drilling rates and gas prices form a feedback loop. When supply is low relative to demand, prices rise; this gives a market signal to the producer to increase the number of rigs drilling for natural gas. The increased supply will then lead to a decrease in the price.
Natural phenomena
Natural phenomena can significantly affect natural gas production and thus supply. Hurricanes, for example, can affect the offshore production and exploitation of natural gas. This is because safety requirements may mandate the temporary shut down of offshore production platforms. Tornadoes can have a similar effect on onshore production facilities.
Technical Issues
Equipment malfunction, although not frequent, could temporarily disrupt the flow across a given pipeline at an important market center. This would ultimately decrease the supply available in that market. On the other hand, technical developments in engineering methods can lead to more abundant supply.
Imports
Imports are a source of supply. In North America, gas is imported from several countries, Canada and the US as well as abroad in the form of LNG from countries such as Trinidad, Algeria and Nigeria.
Trends in natural gas prices

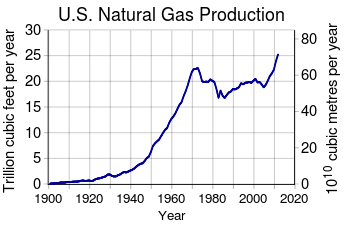
The chart shows a 75-year history of annual United States natural gas production and average wellhead prices from 1930 through 2005. Prices paid by consumers were increased above those levels by processing and distribution costs. Production is shown in billions of cubic meters per year, and average wellhead pricing is shown in United States dollars per thousand cubic meters, adjusted to spring, 2006, by the U.S. Consumer Price Index.[15][16][17][18][19]
Through the 1960s the U.S. was self-sufficient in natural gas and wasted large parts of its withdrawals by venting and flaring. Gas flares were common sights in oilfields and at refineries. U.S. natural gas prices were relatively stable at around (2006 US) $30/Mcm in both the 1930s and the 1960s. Prices reached a low of around (2006 US) $17/Mcm in the late 1940s, when more than 20 percent of the natural gas being withdrawn from U.S. reserves was vented or flared.
Beginning in 1954, the Federal Power Commission regulated the price of US natural gas transported across state lines. The commission set the price of gas below the market rate, resulting in price distortions. The low prices encouraged consumption and discouraged production. By the 1970s, there were shortages of price-regulated interstate gas, while unregulated gas within the gas-producing states (intrastate gas) was plentiful, but more expensive. By 1975, nearly half the marketed gas in the US was sold to the intrastate market, resulting in shortages during 1976 and 1977 in the Midwest that caused factories and schools to close temporarily for lack of natural gas. The federal government progressively deregulated the price of natural gas starting in 1978, and ending with complete federal price deregulation in 1993.[20]
While supply interruptions have caused repeated spikes in pricing since 1990, longer range price trends respond to limitations in resources and their rates of development. As of 2006 the U.S. Interior Department estimated that the Outer Continental Shelf of the United States held more than 15 trillion cubic meters of recoverable natural gas, equivalent to about 25 years of domestic consumption at present rates.[21][22] Total U.S. natural gas reserves were then estimated at 30 to 50 trillion cubic meters, or about 40 to 70 years consumption.[23] The new technologies of hydraulic fracturing and horizontal drilling have increased these estimates of recoverable reserves to many hundreds of trillion cubic feet. Hydraulic fracturing has reduced the Henry Hub spot price of natural gas considerably since 2008. The increased shale gas production leads to a shift of supply away from the south to the northeast and midwest of the country. A recent study found that, on average, natural gas prices have gone down by more than 30% in counties above shale deposits compared to the rest of the US, highlighting that natural gas markets have become less integrated due to pipeline capacity constraints.[24]
Natural gas prices in Europe
Prices of natural gas for end-consumers vary greatly throughout Europe.[25] One of the main objectives of the projected single EU energy market is a common pricing structure for gas products. A recent study suggests that the expansion of shale gas production in the U.S. has caused prices to drop relative to other countries, especially Europe and Asia, leaving natural gas in the U.S. cheaper by a factor of three.[26] It is expected that the TTIP trade deal between the U.S. and Europe opens up access to cheap American natural gas, which allow Europe to diversify its supply base, but may threaten the Renewable Energy transition.[27]
Currently, Europe's main natural gas supplier is Russia. Major pipelines pass through Ukraine and there have been several disputes on the supply and transition prices between Ukraine and Russia.[28]
In September 2013, it was reported that multiple factors have conspired to cause Europe as a whole to decrease its use of natural gas and make more use of coal.[29] The report also contains updated price trends.
Natural gas prices in South America
In South America, the second largest supplier of natural gas is Bolivia. The price which Bolivia is paid for its natural gas is roughly US$3.25 to Brazil and US$3.18 to Argentina.[30] Other sources state that Brazil pays between US$3.15/MMBtu and US$3.60/MMBtu (not including US$1.50/MMBtu in Petrobras extraction and transportation costs).[31] The price of gas in the US as a whole is between US$5.85/MMBtu (May 21, 2006), US$7.90/MMBtu (April 2006)[32] & US$6.46/MMBtu (June 2006).[33] Though several years ago the price of natural gas spiked at $14 in California[34] due to lack of pipeline capacity to and within California, and also due to power outages.[35] While according to Le Monde, Brazil and Argentina pay US$2 per thousand cubic meters,[34] which costs between $2.21 to $2.28 per mmBTU [36] in California according to Reuters.
See also
- Natural gas storage
- Liquified natural gas
- Natural-gas processing
- Energy economics
- Energy crisis
- Henry Hub
References
- ↑ Herald Tribune Natural gas price links to oil market frustrate regulators efforts to develop competition.
- ↑ Roben Farzad. "High Oil Prices Cut the Cost of Natural Gas". Businessweek.com. Retrieved 15 May 2015.
- ↑ Natural Gas Price Links
- ↑ http://nbr.org/research/activity.aspx?id=305#.UZD6pitARpE
- ↑ DISAVINO Scott, KRISHNAN Barani, Henry Hub, king of U.S. natural gas trade, losing crown to Marcellus, Reuters, 25/09/2014 (Retrieved 21/10/2014)
- ↑ EIA conversion chart "$ per MMBtu multiplied by 1.025 = $ per Mcf"
- ↑ US Energy Information Administration, Natural gas processing plants in the United States: 2010 update, 17 June 2011.
- ↑ http://www.eia.gov/dnav/ng/hist/rngwhhdw.htm
- 1 2 Natural Resources Canada-Canadian Natural Gas-Review of 2005 & Outlook to 2020
- ↑ NaturalGas.org-Natural Gas Demand
- ↑ EAI-Natural Gas Consumption by End Use
- ↑ NaturalGas.org-Natural Gas Supply
- ↑ http://www.eia.gov/naturalgas/monthly/
- ↑ Hill, Justin. "New York Times". Commercial Energy Consultant. Bloomberg, New York Times. Retrieved 2014-01-01.
- ↑ Energy Information Administration (2005). "Historical Natural Gas Annual" (PDF). U.S. Department of Energy.
- ↑ Energy Information Administration (2005). "Natural Gas Annual 2004" (PDF). U.S. Department of Energy.
- ↑ Energy Information Administration (Apr 2006). "Natural Gas Monthly". U.S. Department of Energy.
- ↑ Bureau of Labor Statistics (2006). "Consumer Price Index". U.S. Department of Labor. National, All Urban Consumers, All Items, Averaged by Year.
- ↑ This article uses numeric conventions of the United States: "billion" = 1 000 000 000 and "trillion" = 1 000 000 000 000.
- ↑ Natural Gas.Org, History of regulation, 20 Sept. 2013.
- ↑ Minerals Management Service (2006). "Leasing Oil and Natural Gas Resources" (PDF). U.S. Department of the Interior.
- ↑ Michael Janofsky (May 9, 2006). "As Cuba Plans Offshore Wells, Some Want U.S. to Follow Suit". New York Times.
- ↑ Overview of Natural Gas (2004). "U.S. Natural Gas Resource Estimates". (U.S.) Natural Gas Supply Association.
- ↑ Fracking Growth - Impact of Shale Gas production on natural gas prices across the US, Fetzer, T. (2014)
- ↑ "Europe's Energy Portal » Fuel, Natural Gas and Electricity Prices From Past to Present". Retrieved 15 May 2015.
- ↑ Arezki, Rabah; Fetzer, Thiemo. "On the Comparative Advantage of U.S. Manufacturing: Evidence from the Shale Gas Revolution" (PDF). Journal of International Economics.
- ↑ "TTIP: what does the transatlantic trade deal mean for renewable energy?". The Guardian. Retrieved 16 June 2016.
- ↑ "Ukraine country profile - Overview". BBC News. Retrieved 15 May 2015.
- ↑ http://www.eia.gov/todayinenergy/detail.cfm?id=13151
- ↑ Businessweek
- ↑ Luiz Rodolfo Landim Machado (October 2002). "Facing Market Risks in Brazil: the experience of the Bolivia - Brazil Gas Pipeline" (PDF). In IEA – OLADE Latin American Conference on Cross-Border Gas Trade. Archived from the original (PDF) on 2006-05-24. Retrieved 2006-05-02.
- ↑ "Futures & Options Trading". Retrieved 15 May 2015.
- ↑ Globe and Mail
- 1 2 "Evo Morales et l'arme du gaz" (in French). Le Monde. January 25, 2006. Retrieved 2006-01-25.
- ↑ US DOE, gasandoil.com
- ↑ "Weekday demand lifts US Henry Hub gas from 31-mo low". Reuters. Retrieved 15 May 2015.