National Parliament of Papua New Guinea
| National Parliament of Papua New Guinea | |
|---|---|
| Type | |
| Type | |
| Structure | |
| Seats |
111 (2 vacant) |
 | |
Political groups |
Government (80) People's National Congress Party: 51 seats National Alliance Party: 11 seats United Resources Party: 8 seats People's Progress Party: 7 seats People's Party: 2 seats United Party: 1 seat
Opposition (29) Triumph Heritage Empowerment Rural Party: 6 seats New Generation Party: 3 seats Pangu Party: 3 seats Papua New Guinea Party: 2 seats People's Democratic Movement: 2 seats People's United Assembly: 2 seats Coalition for Reform: 1 seat Melanesian Liberal Party: 1 seat People's Movement for Change: 1 seat Social Democratic Party: 1 seat Star Alliance: 1 seat Independents: 6 seats |
| Elections | |
| Instant-runoff voting | |
Last election | 23 June-13 July 2012 |
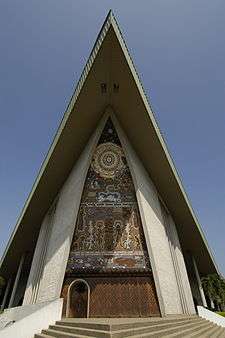
| Meeting place | |
| Port Moresby | |
| Website | |
|
www | |
 |
| This article is part of a series on the politics and government of Papua New Guinea |
The National Parliament of Papua New Guinea is the unicameral national legislature in Papua New Guinea. It was created in 1964 as the House of Assembly of Papua and New Guinea but gained its current name after the nation was granted independence in 1975.
The 111 members of parliament serve five-year terms, 89 of whom are chosen from single-member "open" electorates, which are sometimes referred to as "seats" but are officially known as constituencies. The remaining 22 are chosen from single-member provincial electorates: the 20 provinces, the autonomous province of Bougainville (North Solomons), and the National Capital District. Each provincial member becomes governor of his province unless he takes a ministerial position, in which case the governorship passes to an open member of the province.[1]
From 1964 until 1977 an Optional Preferential Voting System was used. The first past the post system was used from 1977 until 2002. Electoral reforms introduced by former Prime Minister Mekere Morauta introduced Limited Preferential Voting, in which voters numbered three preferred candidates. LPV was first used nationally in the 2007 election.[2]
As in other Commonwealth realms, the party or coalition with the most seats in the parliament is invited by the Governor-General to form a government, and its leader subsequently becomes Prime Minister of Papua New Guinea. The Prime Minister then appoints his cabinet from fellow parliament members. (Members of parliament are seated in a similar manner to other Westminster system parliaments, but use chairs instead of benches.)
Papua New Guinea has a fractious political culture, and no party in the history of parliament has yet won a majority.[1] Therefore, negotiations between parties have always been necessary to form governments. New governments are protected from votes of no confidence during their first 18 months and during the last 12 months before a national election. More recently, in a move aimed at further minimizing no-confidence motions, then-Prime Minister Mekere Morauta introduced changes that prevented members of the government from voting in favour of such a motion.
All citizens over the age of 18 may vote, although voting is not compulsory.[3]
Latest election
| Party | Candidates | Seats won | % of seats |
|---|---|---|---|
| People's National Congress Party | 89 | 27 | 24.32% |
| Triumph Heritage Empowerment Rural Party | 72 | 12 | 10.81% |
| Papua New Guinea Party | 88 | 8 | 7.21% |
| National Alliance Party | 75 | 7 | 6.31% |
| United Resources Party | 48 | 7 | 6.31% |
| People's Party | 49 | 6 | 5.41% |
| People's Progress Party | 40 | 6 | 5.41% |
| Social Democratic Party | 40 | 3 | 2.7% |
| Coalition for Reform Party | 15 | 2 | 2.7% |
| Melanesian Liberal Party | 5 | 2 | 2.7% |
| New Generation Party | 27 | 2 | 2.7% |
| People's Movement for Change Party | 51 | 2 | 2.7% |
| People's United Assembly Party | 29 | 2 | 2.7% |
| People's Democratic Movement | 19 | 2 | 2.7% |
| Indigenous People's Party | 44 | 1 | 0.9% |
| Our Development Party | 22 | 1 | 0.9% |
| Pangu Party | 60 | 1 | 0.9% |
| Papua New Guinea Constitutional Democratic Party | 39 | 1 | 0.9% |
| PNG Country Party | 46 | 1 | 0.9% |
| Stars Alliance Party | 22 | 1 | 0.9% |
| United Party | 20 | 1 | 0.9% |
| Independent | 2197 | 16 | 14.41% |
| Total | 111 | 100% | |
| Source: PNG Electoral Commission | |||
See also
- Elections in Papua New Guinea
- List of Speakers of the National Parliament of Papua New Guinea
- Members of the National Parliament of Papua New Guinea, 2002–2007
- Members of the National Parliament of Papua New Guinea, 2007-2012
- List of legislatures by country
- Politics of Papua New Guinea
References
- 1 2 "About Our Parliament". National Parliament of Papua New Guinea.
- ↑ "Papua New Guinea National Elections 2012: Final Report". Commonwealth of Nations. 13 September 2012. Retrieved 19 May 2015.
- ↑ "Enrolment Awareness". Electoral Commission of Papua New Guinea.