Mutation rate

In genetics, the mutation rate is a measure of the rate at which various types of mutations occur over time. Mutation rates are typically given for a specific class of mutation, for instance point mutations, small or large scale insertions or deletions. The rate of substitutions can be further subdivided into a mutation spectrum which describes the influence of genetic context on the mutation rate.
There are several natural units of time for each of these rates, with rates being characterized either as mutations per base pair per cell division, per gene per generation, or per genome per generation. The mutation rate of an organism is an evolved characteristic and is strongly influenced by the genetics of each organism, in addition to strong influence from the environment. The upper and lower limits to which mutation rates can evolve is the subject of ongoing investigation.
Background
Different genetic variants within a species are referred to as alleles, and so a new mutation is said to create a new allele. In population genetics, each allele is characterized by a selection coefficient, which measures the expected change in an allele's frequency over time. The selection coefficient can either be negative, corresponding to an expected decrease, positive, corresponding to an expected increase, or zero, corresponding to no expected change. The distribution of fitness effects of new mutations is an important parameter in population genetics and has been the subject of extensive investigation [2] Although measurements of this distribution have been inconsistent in the past, it is now generally thought that the majority of mutations are mildly deleterious, that many have little effect on an organism's fitness, and that a few can be favorable. As a result of natural selection, unfavorable mutations will typically be eliminated from a population while favorable changes are quickly fixed, and neutral changes accumulate at the rate they are created by mutations.
Measurement
An organism's mutation rates can be measured by a number of techniques.
Substitution Rates
Many sites in an organism's genome may not admit mutations with large fitness effects. These sites are typically called neutral sites. Theoretically mutations under no selection become fixed between organisms at precisely the mutation rate. Fixed synonymous mutations, i.e. synonymous substitutions, are changes to the sequence of a gene that do not change the protein produced by that gene. They are often used as estimates of that mutation rate, despite the fact that some synonymous mutations have fitness effects. As an example, mutation rates have been directly inferred from the whole genome sequences of experimentally evolved replicate lines of Escherichia coli B.[3]
Mutation Accumulation Lines
A particularly labor-intensive way of characterizing the mutation rate is the mutation accumulation line.
Mutation accumulation lines have been used to characterize mutation rates with the Bateman-Mukai Method and direct sequencing of intestinal bacteria, round-worms, yeast, fruit flies, small annual plants,[4]
Variation in mutation rates

Mutation rates differ between species and even between different regions of the genome of a single species. These different rates of nucleotide substitution are measured in substitutions (fixed mutations) per base pair per generation. For example, mutations in intergenic, or non-coding, DNA tend to accumulate at a faster rate than mutations in DNA that is actively in use in the organism (gene expression). That is not necessarily due to a higher mutation rate, but to lower levels of purifying selection. A region which mutates at predictable rate is a candidate for use as a molecular clock.
If the rate of neutral mutations in a sequence is assumed to be constant (clock-like), and if most differences between species are neutral rather than adaptive, then the number of differences between two different species can be used to estimate how long ago two species diverged (see molecular clock). In fact, the mutation rate of an organism may change in response to environmental stress. For example, UV light damages DNA, which may result in error prone attempts by the cell to perform DNA repair.
The human mutation rate is higher in the male germ line (sperm) than the female (egg cells), but estimates of the exact rate have varied by an order of magnitude or more.
In general, the mutation rate in unicellular eukaryotes and bacteria is roughly 0.003 mutations per genome per cell generation.[5] This means that a human genome accumulates around 64 new mutations per generation because each full generation involves a number of cell divisions to generate gametes.[5] The highest per base pair per generation mutation rates are found in viruses, which can have either RNA or DNA genomes. DNA viruses have mutation rates between 10−6 to 10−8 mutations per base per generation, and RNA viruses have mutation rates between 10−3 to 10−5 per base per generation.[5] Human mitochondrial DNA has been estimated to have mutation rates of ~3× or ~2.7×10⁻⁵ per base per 20 year generation (depending on the method of estimation);[6] these rates are considered to be significantly higher than rates of human genomic mutation at ~2.5×10⁻⁸ per base per generation.[7] Using data available from whole genome sequencing, the human genome mutation rate is similarly estimated to be ~1.1×10⁻⁸ per site per generation.[8]
The rate for other forms of mutation also differs greatly from point mutations. An individual microsatellite locus often has a mutation rate on the order of 10−4, though this can differ greatly with length.[9]
Some sequences of DNA may be more susceptible to mutation. For example, stretches of DNA in human sperm which lack methylation are more prone to mutation.[10]
Mutational spectrum
The mutation spectrum of an organism is the rate at which different mutations occur at different sites. Typically two sites are considered, each of which may have three mutations, resulting in six total rates for most mutation spectra. The two sites are the two correct pairs possible in DNA: A:T pairs and C:G pairs;
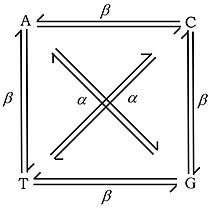
There is a systematic difference in rates for transitions (Alpha) and transversions (Beta).
Evolution
Theory on the evolution of mutation rates identifies three principal forces involved: the generation of more deleterious mutations with higher mutation, the generation of more advantageous mutations with higher mutation, and the metabolic costs and reduced replication rates that are required to prevent mutations. Different conclusions are reached based on the relative importance attributed to each force. The optimal mutation rate of organisms may be determined by a trade-off between costs of a high mutation rate,[11] such as deleterious mutations, and the metabolic costs of maintaining systems to reduce the mutation rate (such as increasing the expression of DNA repair enzymes.[12] or, as reviewed by Bernstein et al.[13] having increased energy use for repair, coding for additional gene products and/or having slower replication). Second, higher mutation rates increase the rate of beneficial mutations, and evolution may prevent a lowering of the mutation rate in order to maintain optimal rates of adaptation.[14] Finally, natural selection may fail to optimize the mutation rate because of the relatively minor benefits of lowering the mutation rate, and thus the observed mutation rate is the product of neutral processes.[15][16]
Studies have shown that treating RNA viruses such as poliovirus with ribavirin produce results consistent with the idea that the viruses mutated too frequently to maintain the integrity of the information in their genomes.[17] This is termed error catastrophe.
References
- ↑ Scally, Aylwyn (2016). "The mutation rate in human evolution and demographic inference". Current Opinion in Genetics & Development. 41: 36–43. doi:10.1016/j.gde.2016.07.008. ISSN 0959-437X.
- ↑ Eyre-Walker A, Keightley PD (August 2007). "The distribution of fitness effects of new mutations". Nat. Rev. Genet. 8 (8): 610–8. doi:10.1038/nrg2146. PMID 17637733.
- ↑ Wielgoss S, Barrick JE, Tenaillon O, et al. (August 2011). "Mutation Rate Inferred From Synonymous Substitutions in a Long-Term Evolution Experiment With Escherichia coli". G3: Genes, Genomes, Genetics. 1 (3): 183–6. doi:10.1534/g3.111.000406. PMC 3246271
 . PMID 22207905.
 - ↑ Ossowski S, Schneeberger K, Lucas-Lledó JI, et al. (January 2010). "The rate and molecular spectrum of spontaneous mutations in Arabidopsis thaliana". Science. 327 (5961): 92–4. doi:10.1126/science.1180677. PMC 3878865. PMID 20044577.
- 1 2 3 Drake JW, Charlesworth B, Charlesworth D, Crow JF (April 1998). "Rates of spontaneous mutation". Genetics. 148 (4): 1667–86. PMC 1460098. PMID 9560386.
- ↑ Schneider S, Excoffier L (July 1999). "Estimation of past demographic parameters from the distribution of pairwise differences when the mutation rates vary among sites: application to human mitochondrial DNA". Genetics. 152 (3): 1079–89. PMC 1460660. PMID 10388826.
- ↑ Nachman MW, Crowell SL (September 2000). "Estimate of the mutation rate per nucleotide in humans". Genetics. 156 (1): 297–304. PMC 1461236. PMID 10978293.
- ↑ Roach JC, Glusman G, Smit AF, et al. (April 2010). "Analysis of genetic inheritance in a family quartet by whole-genome sequencing". Science. 328 (5978): 636–9. doi:10.1126/science.1186802. PMC 3037280. PMID 20220176.
- ↑ Whittaker JC, Harbord RM, Boxall N, Mackay I, Dawson G, Sibly RM (June 2003). "Likelihood-based estimation of microsatellite mutation rates". Genetics. 164 (2): 781–7. PMC 1462577. PMID 12807796.
- ↑ Gravtiz, Lauren (28 June 2012). "Lack of DNA modification creates hotspots for mutations". Simons Foundation Autism Research Initiative.
- ↑ Altenberg L (June 2011). "An evolutionary reduction principle for mutation rates at multiple Loci". Bull. Math. Biol. 73 (6): 1227–70. doi:10.1007/s11538-010-9557-9. PMID 20737227.
- ↑ Sniegowski P, Gerrish P, Johnson T, Shaver A (2000). "The evolution of mutation rates: separating causes from consequences". BioEssays. 22 (12): 1057–66. doi:10.1002/1521-1878(200012)22:12<1057::AID-BIES3>3.0.CO;2-W. PMID 11084621.
- ↑ Bernstein H, Hopf FA, Michod RE (1987). "The molecular basis of the evolution of sex". Adv. Genet. 24: 323–70, see p. 347. doi:10.1016/s0065-2660(08)60012-7. PMID 3324702.
- ↑ Orr HA (June 2000). "The rate of adaptation in asexuals". Genetics. 155 (2): 961–8. PMC 1461099. PMID 10835413.
- ↑ Lynch M (August 2010). "Evolution of the mutation rate". Trends Genet. 26 (8): 345–52. doi:10.1016/j.tig.2010.05.003. PMC 2910838. PMID 20594608.
- ↑ Sung W, Ackerman MS, Miller SF, Doak TG, Lynch M (2012). "Drift-barrier hypothesis and mutation-rate evolution". Proc. Natl. Acad. Sci. USA. 109 (45): 18488–18492. doi:10.1073/pnas.1216223109.
- ↑ Crotty S, Cameron CE, Andino R (June 2001). "RNA virus error catastrophe: direct molecular test by using ribavirin". Proc. Natl. Acad. Sci. U.S.A. 98 (12): 6895–900. doi:10.1073/pnas.111085598. PMC 34449. PMID 11371613.
See also
| Wikimedia Commons has media related to Mutation rate. |