Moody chart
In engineering, the Moody chart or Moody diagram is a graph in non-dimensional form that relates the Darcy-Weisbach friction factor fD, Reynolds number Re, and relative roughness for fully developed flow in a circular pipe. It can be used for working out pressure drop or flow rate down such a pipe.
History
In 1944, Lewis Ferry Moody plotted the Darcy–Weisbach friction factor against Reynolds number Re for various values of relative roughness ε / D.[1] This chart became commonly known as the Moody Chart or Moody Diagram. It adapts the work of Hunter Rouse[2] but uses the more practical choice of coordinates employed by R. J. S. Pigott,[3] whose work was based upon an analysis of some 10,000 experiments from various sources.[4] Measurements of fluid flow in artificially roughened pipes by J. Nikuradse[5] were at the time too recent to include in Pigott's chart.
The chart's purpose was to provide a graphical representation of the function of C. F. Colebrook in collaboration with C. M. White,[6] which provided a practical form of transition curve to bridge the transition zone between smooth and rough pipes, the region of incomplete turbulence.
Description
This dimensionless chart is used to work out pressure drop, ΔP (Pa) (or head loss, hf (m)) and flow rate through pipes. Head loss can be calculated using the Darcy–Weisbach equation:

(not to be confused with the Fanning equation and the Fanning friction factor:

which uses a friction-factor equal to one fourth the Darcy-Weisbach friction factor).
Pressure drop can then be evaluated as:

or directly from

where ρ is the density of the fluid, V is the average velocity in the pipe, fD is the friction factor from the Moody chart, L is the length of the pipe and D is the pipe diameter.
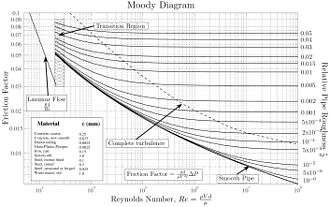
The chart plots Darcy–Weisbach friction factor against Reynolds number Re for a variety of relative roughnesses, the ratio of the mean height of roughness of the pipe to the pipe diameter or ε / D .
The Moody chart can be divided into two regimes of flow: laminar and turbulent. For the laminar flow regime (Re < ~3000), roughness has no discernible effect, and the Darcy–Weisbach friction factor fD was determined analytically by Poiseuille:

For the turbulent flow regime, the relationship between the friction factor fD, the Reynolds number Re, and the relative roughness ε / D is more complex. One model for this relationship is the Colebrook equation (which is an implicit equation in fD):

References
- ↑ Moody, L. F. (1944), "Friction factors for pipe flow", Transactions of the ASME, 66 (8): 671–684
- ↑ Rouse, H. (1943). Evaluation of Boundary Roughness. Proceedings Second Hydraulic Conference, University of Iowa Bulletin 27.
- ↑ Pigott, R. J. S. (1933). "The Flow of Fluids in Closed Conduits". Mechanical Engineering. 55: 497–501, 515.
- ↑ Kemler, E. (1933). "A Study of the Data on the Flow of Fluid in Pipes". Transactions of the ASME. 55 (Hyd-55-2): 7–32.
- ↑ Nikuradse, J. (1933). "Strömungsgesetze in Rauen Rohren". V. D. I. Forschungsheft. Berlin. 361: 1–22. These show in detail the transition region for pipes with high relative roughness (ε / D > 0.001).
- ↑ Colebrook, C. F. (1938–1939). "Turbulent Flow in Pipes, With Particular Reference to the Transition Region Between the Smooth and Rough Pipe Laws". Journal of the Institution of Civil Engineers. London, England. 11: 133–156.