Millville Area School District
| Millville Area School District | |
|---|---|
 | |
| Address | |
|
330 Main Street Millville, Pennsylvania, Columbia County 17846 United States | |
| Information | |
| Type | Public |
| School board | 9 locally elected members |
| Superintendent |
Cynthia Jenkins, April 2014[1] |
| Administrator |
David Bowser, salary $103,776 (2013) [2] |
| Principal | Eric Stair, JSHS, salary $81,756 (2013) |
| Principal | John Fetterman, Elementary $94,408 (2013) |
| Staff | 55 non teaching staff members[3] |
| Faculty | 56 teachers (2013)[4] 66 teachers (2011)[5] |
| Grades | K-12 |
| Age | 5 years old to 21 years old special education |
| Pupils |
676 pupils (2016)[6] |
| • Kindergarten | 53 (2015),[12] 45 (2012), 45 (2010) |
| • Grade 1 | 40 (2015), 47 (2012), 68 |
| • Grade 2 | 35 (2015), 44 (2012), 65 |
| • Grade 3 | 43 (2015), 65 (2012), 70 |
| • Grade 4 | 47 (2015), 68 (2012), 60 |
| • Grade 5 | 63 (2015), 66 (2012), 57 |
| • Grade 6 | 63 (2015), 65 (2012), 56 |
| • Grade 7 | 67 (2015), 57 (2012), 58 |
| • Grade 8 | 63 (2015), 59 (2012), 56 |
| • Grade 9 | 46 (2015), 47 (2012), 41 |
| • Grade 10 | 47 (2015), 44 (2012), 35 |
| • Grade 11 | 44 (2015), 37 (2012), 47 |
| • Grade 12 | 44 (2015), 35 (2012), 50 (2010) |
| Language | English |
| Budget |
$14,380,791 (2016-17)[13] |
| Per pupil spending | $13,674 (2008) |
| Per pupil spending | $24,524.25 (2011) |
| Website | http://www.millville.k12.pa.us/millville |
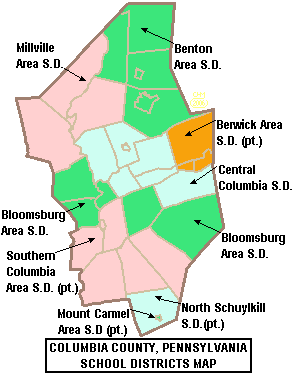
Millville Area School District is a small, rural, public school district in Columbia County, Pennsylvania. It is centered in the borough of Millville and also serves the townships of Pine, Greenwood, and Madison. Millville Area School District encompasses approximately 91 square miles (240 km2). According to 2000 federal census data, it served a resident population of 5,500. By 2010, the district's population rose to 5,563 people.[17] The educational attainment levels for the Millville Area School District population (25 years old and over) were 87% high school graduates and 19.6% college graduates.[18]
According to the Pennsylvania Budget and Policy Center, 38.8% of the District's pupils lived at 185% or below the Federal Poverty level as shown by their eligibility for the federal free or reduced price school meal programs in 2012.[19] In 2009, Millville Area School District residents’ per capita income was $17,931, while the median family income was $41,867.[20] In the Commonwealth, the median family income was $49,501[21] and the United States median family income was $49,445, in 2010.[22]
Millville Area School District operates two schools: Millville Area Elementary School and Millville Area Junior Senior High School. Per school district officials, in school year 2005-06, the Millville Area School District provided basic educational services to 756 pupils. It employed 74 teachers, 58 full-time and part-time support personnel and 7 administrators. In school year 2009-10, the Millville Area School District provided basic educational services to 736 pupils. The district employed: 76 teachers, 66 full-time and part-time support personnel and 7 administrators. Millville Area School District received more than $5.6 million in state funding in school year 2009-10. Millville Area District had an enrollment of 746 pupils in 2011-12. The District reported employing: 66 teachers, 64 full-time and part-time support personnel, and seven administrators. The District received $5.9 million in state funding in the 2011-2012 school year.
Millville Area High School students may choose to attend Columbia-Montour Area Vocational-Technical School which provides training in the trades. The Central Susquehanna Intermediate Unit IU16 provides the District with a wide variety of services like specialized education for disabled students and hearing, speech and visual disability services and professional development for staff and faculty. The District is one of the 500 public school districts of Pennsylvania.
Governance
Millville Area School District is governed by 9 individually elected board members (serve four-year terms), the Pennsylvania State Board of Education, the Pennsylvania Department of Education and the Pennsylvania General Assembly.[23] The federal government controls programs it funds like Title I funding for low-income children in the Elementary and Secondary Education Act and the No Child Left Behind Act, which mandates the District focus resources on student success in acquiring reading and math skills. The Superintendent and Business Manager are appointed by the school board. The Superintendent is the chief administrative officer with overall responsibility for all aspects of operations, including education and finance. The Business Manager is responsible for budget and financial operations. Neither of these officials are voting members of the School Board. The School Board enters into individual employment contracts for these positions. In Pennsylvania, public school districts are required to give 150 days notice to the Superintendent regarding renewal of the employment contract.[24]
The Commonwealth Foundation for Public Policy Alternatives Sunshine Review gave the school board and district administration a "F" for transparency based on a review of "What information can people find on their school district's website". It examined the school district's website for information regarding; taxes, the current budget, meetings, school board members names and terms, contracts, audits, public records information and more.[25]
Academic achievement
In 2016, Millville Area School District ranked 267th out of 494 Pennsylvania public school districts, by the Pittsburgh Business Times.[26] The ranking is based on the last 3 years of student academic achievement as demonstrated by PSSAs results in: reading, writing, math and science and the three Keystone Exams (literature, Algebra 1, Biology I) in high school.[27] Three Pennsylvania school districts were excluded from the ranking because they do not operate high schools (Saint Clair Area School District, Midland Borough School District, Duquesne City School District). The PSSAs are given to all children in grades 3rd through 8th. Adapted PSSA examinations are given to children in the special education programs. Writing exams were given to children in 5th and 8th grades.
- Overachievers Statewide Ranking
In 2013, the Pittsburgh Business Times reported an Overachievers Ranking for 498 Pennsylvania school districts. Millville Area School District ranked 271st.[35] The paper describes the ranking as: "a ranking answers the question - which school districts do better than expectations based upon economics? This rank takes the Honor Roll rank and adds the percentage of students in the district eligible for free and reduced-price lunch into the formula. A district finishing high on this rank is smashing expectations, and any district above the median point is exceeding expectations."[36]
- 2012 - 139th
- 2010 - 117th
- 2009 - 123rd
In 2009, the academic achievement, of the students in the Millville Area School District, was in the 49th percentile among all 500 Pennsylvania school districts Scale (0-99; 100 is state best)[37]
District AYP status history
In 2012, Millville Area School District achieved AYP status.[38] In 2011, Millville Area School District also achieved Adequate Yearly Progress (AYP). In 2011, 94 percent of the 500 Pennsylvania public school districts achieved the No Child Left Behind Act progress level of 72% of students reading on grade level and 67% of students demonstrating on grade level math. In 2011, 46.9 percent of Pennsylvania school districts achieved Adequate Yearly Progress (AYP) based on student performance. An additional 37.8 percent of school districts made AYP based on a calculated method called safe harbor, 8.2 percent on the growth model and 0.8 percent on a two-year average performance.[39] Millville Area School District has achieved AYP status every year since 2003 when the measurement began.
Graduation rate
In 2016, Millville Area School District reported decline to a 79.07% graduation rate.[40]
- 2015 - 88.5%[41]
- 2014 - 92%[42]
- 2013 - 93.88%[43]
- 2012 - 88%[44]
- 2011 - 96%[45]
- 2010 - 93%, the Pennsylvania Department of Education issued a new, 4-year cohort graduation rate.[46]
- Former AYP graduation rate
The District's graduation requirements have been defined in the Strategic Plan and Millville Area School Board policy.[51]
Junior Senior High school
Millville Area Junior Senior High School is located at 345 School House Lane, Millville. In 2014, enrollment was reported as 290 pupils in 7th through 12th grades, with 33.7% of pupils eligible for a free lunch due to family poverty. Additionally, 17.9% of pupils received special education services, while 3.4% of pupils were identified as gifted. The school employed 30 teachers.[52] Per the PA Department of Education, 100% of the teachers were rated "Highly Qualified" under the federal No Child Left Behind Act.
According to the National Center for Education Statistics, in 2011, the school reported an enrollment of 277 pupils in grades 7th through 12th, with 38% of its pupils eligible for a federal free or reduced price lunch due to the family meeting the federal poverty level. The school employed 32 teachers yielding a student-teacher ratio of 8:1.[53] According to a report by the Pennsylvania Department of Education, 8 teachers were rated "Non‐Highly Qualified" under No Child Left Behind.[54]
- 2016 School Performance Profile
SPP 68.3 points out of 100. Millville Area Junior Senior High School Keystone Exams mandated testing results were: 83% of students were on grade level in reading.literature and 80% of students demonstrated on grade level in Algebra I. In Biology I, 81% of pupils demonstrated on grade level science understanding at the end of the Biology course.[55] The requirement that pupils pass the Keystone Exams in reading, algebra I and bIology I in order to graduate was postponed until 2019 by the Pennsylvania General Assembly because less than 60% of 12 grade pupils statewide would have been eligible for graduation from high school due to failing one or more Keystone Exams.[56] Fifty-four percent of the 2,676 public schools in Pennsylvania achieved a passing score of 70 or better.[57]
The PSSA mandated testing results in 2016 were: just 42% of students in 8th grade were on grade level in reading, while only 29% of students demonstrated on grade level in mathematics. In science, 45% of eighth grade pupils demonstrated on grade level science understanding.[58] In 7th grade, 56% of pupils were on grade level in reading, while only 34% demonstrated on grade level math skills.
- 2015 School Performance Profile
Millville Area High School achieved 62.3 out of 100. Reflects on grade level reading, mathematics and science achievement. The PDE reported that just 53% of the High School's students were on grade level in reading/literature. In Algebra 1, 62% of students showed on grade level skills at the end of the course. In Biology I, only 56% demonstrated on grade level science understanding at the end of the course.[59] Statewide, 53 percent of schools with an eleventh grade achieved an academic score of 70 or better. Five percent of the 2,033 schools with 11th grade were scored at 90 and above; 20 percent were scored between 80 and 89; 28 percent between 70 and 79; 25 percent between 60 and 69 and 22 percent below 60. The Keystone Exam results showed: 73 percent of students statewide scored at grade-level in English, 64 percent in Algebra I and 59 percent in biology.[60][61]
- 2014 School Performance Profile
Millville Area Junior Senior High School achieved 75.5 out of 100. Reflects on grade level reading, mathematics and science achievement. In reading/literature - 79.8% were on grade level. In Algebra 1/Mathematics, 79.8% showed on grade level skills. In Biology/science, 74% demonstrated on grade level science understanding at the end of the course. In writing, 75% of eighth graders demonstrated on grade level writing skills.[62][63] Statewide, the percentage of high school students who scored proficient and advanced in Algebra I increased to 39.7% to 40.1%. The percentage of high school students who scored proficient and advanced in reading/literature declined to 52.5%. The percentage of high school students who scored proficient and advanced in biology improved from 39.7% to 41.4%.[64]
According to the Pennsylvania Department of Education, 2,134 of 2,947 Pennsylvania public schools (72 percent of Pennsylvania public schools), achieved an academic score of 70 or higher.[65] Fifty-three percent of schools statewide received lower SPP scores compared with last year's, while 46 percent improved. A handful were unchanged.[66][67]
- 2013 School Performance Profile
Millville Area Junior Senior High School achieved 86.8 out of 100. Reflects on grade level reading, mathematics and science achievement. In reading/literature 81.76% of students were on grade level. In Algebra 1 81.86% showed on grade level skills. In Biology, 76% showed on grade level science understanding. In 8th grade writing, 82% of students demonstrated on grade level skills.[68]
- AYP History
In 2012, Millville Area Junior Senior High School declined to Warning Adequate Yearly Progress (AYP) status due to lagging achievement in reading and mathematics.[69] In 2011 and 2010, Millville Area Junior Senior High School achieved AYP status under the federal No Child Left Behind law.[70] In 2009, Millville Junior Senior High School ranked 495th out of 666 Pennsylvania high schools for the reading and mathematics achievement of its students.[71]
- PSSA Results
Pennsylvania System of School Assessments, commonly called PSSAs are No Child Left Behind Act related examinations which were administered from 2003 through 2012, in all Pennsylvania public high schools. The exams were administered in the Spring of each school year. The goal was for 100% of students to be on grade level or better in reading and mathematics, by the Spring of 2014. The tests focused on the state's Academic Standards for reading, writing, mathematics and science. The Science exam included content in science, technology, ecology and the environmental studies. The mathematics exam included: algebra I, algebra II, geometry and trigonometry. The standards were first published in 1998 and are mandated by the Pennsylvania State Board of Education.[72] In 2013, the Commonwealth of Pennsylvania changed its high school assessments to the Keystone Exams in Algebra 1, Reading/literature and Biology1. The exams are given at the end of the course, rather than all in the spring of the student's 11th grade year.[73]
- 11th Grade Mathematics:
- 2012 - 41% on grade level (50% below basic). In Pennsylvania, 59% of 11th graders are on grade level.[74]
- 2011 - 67% (14% below basic). State - 60.3%
- 2010 - 65% (15% below basic). State - 59%[75]
- 2009 - 45%, State - 56%.[76]
- 2008 - 56.1%, State - 56%
- 2007 - 56.5%, State - 53%
- 2006 - 50%, State - 52%
In 2009, Millville 11th graders ranked 17th out of 18 Central Pennsylvania High Schools, in the CSIU 16 region, for math achievement.[77] In 2012, Millville Area 11th graders ranked 15th out of 17 CSIU16 region high schools for mathematics achievement.
- 11th grade Reading:
- 2012 - 50% on grade level (41% below basic). State - 67% of 11th graders are on grade level.[78]
- 2011 - 70% (12% below basic). State - 69.1% [79]
- 2010 - 76% (14% below basic). State - 66%
- 2009 - 70%, State - 65%[80]
- 2008 - 75.6%, State - 65%[81]
- 2007 - 47%, State - 65%[82]
- 2006 - 88%, State - 65%
- 2005 - 67%, State - 65%
- 11th grade Science:
- 2012 - 44% on grade level (21% below basic). State - 42% of 11th graders were on grade level.[83]
- 2011 - 50% (2% below basic). State - 40% [84]
- 2010 - 59% (7% below basic). State - 39%[85]
- 2009 - 51%, State - 40%[86][87]
- 2008 - 48.7%, State - 39%
Science in Motion Millville Area Junior Senior High School took advantage of a state program called Science in Motion which brought college professors and sophisticated science equipment to the school to raise science awareness and to provide inquiry-based experiences for the students. The Science in Motion program was funded by a state appropriation and cost the school nothing to participate.[88] Susquehanna University provides the experiences to the District.
College remediation
According to a Pennsylvania Department of Education study released in January 2009, 20% of Millville Area High School graduates required remediation in mathematics and or reading before they were prepared to take college level courses in the Pennsylvania State System of Higher Education or community colleges.[89] Less than 66% of Pennsylvania high school graduates, who enroll in a four-year college in Pennsylvania, will earn a bachelor's degree within six years. Among Pennsylvania high school graduates pursuing an associate degree, only one in three graduate in three years.[90] Per the Pennsylvania Department of Education, one in three recent high school graduates who attend Pennsylvania's public universities and community colleges takes at least one remedial course in math, reading or English.
Dual enrollment
Millville Area High School offers a dual enrollment program. Students may participate in the ACE program at Bloomsburg University. This state program permits high school students to take courses, at local higher education institutions, to earn college credits. Students remain enrolled at their high school. The courses count towards high school graduation requirements and towards earning a college degree. The students continue to have full access to activities at their high school. Originally, the state offered a small grant to assist students in costs for tuition, fees and books.[91] The grant was discontinued, in 2010-11 by Governor Rendell, due to state budget constraints. Under the Pennsylvania Transfer and Articulation Agreement, many Pennsylvania colleges and universities accept these credits for students who transfer to their institutions.[92] Juniors and just graduated seniors can attend the summer ACE program at Bloomsburg for discounted credits, as well.[93] For the 2009-10 funding year, the Millville Area School District received a state grant of $2,112 for the program. Under state rules, students that reside in the district, who attend a private school, a charter school or are homeschooled are eligible to participate in this program.[94]
- Penn College NOW
In 2014, Millville Area School District offered several dual enrollment courses in conjunction with Pennsylvania College of Technology. Penn College NOW classes are taught by approved local high school teachers, at the high school.[95] Penn College NOW is partially funded by the Carl D. Perkins Career and Technical Education Improvement Act of 2006 (Public Law 109-270), through the Pennsylvania Department of Education, by the support of Pennsylvania companies through the Educational Improvement Tax Credit program managed by the Pennsylvania Department of Community and Economic Development and by Pennsylvania College of Technology.
Advanced Placement Curricula
Millville Area School District currently offers Advanced Placement (AP) courses in Calculus, English, and Biology. Students have the option of taking College Board approved AP courses and then taking the College Board's examination in the Spring. Students, who achieve a 3 or better on the exam, may be awarded college credits at US universities and colleges. Each higher education institution sets its own standards about what level of credits are awarded to a student based on their AP exam score. Most higher education give credits for scores of 4 or 5. Some schools also give credits for scores of 3. Millville area High school gives credits towards graduation to students who take the school's AP class.[96] At Millville Area High School less than 10 of the students, who took an AP course, earned a 3 or better on the exam.[97]
In 2014, the School offered 3 AP courses, with less than 10 pupils scoring a 3 or better on the AP exam. IN 2015, the School offered 3 AP Courses. None of the pupils taking the College Board AP exam achieved a 3 or better.
SAT scores
In 2015, 22 Millville Area Junior Senior High School students took the SAT exams. The District's Verbal Average Score was 506. The Math average score was 482. The Writing average score was 467.[98] The College Board also reported that statewide 96,826 pupils took the exams with average scores declining in all three measurers to: 495 in reading, 511 in math and 484 in writing.[99]
In 2014, 25 Millville Area School District students took the SAT exams. The District's Verbal Average Score was 508. The Math average score was 476. The Writing average score was 472.[100] Statewide in Pennsylvania, Verbal Average Score was 497. The Math average score was 504. The Writing average score was 480. The College Board also reported that nationwide scores were: 497 in reading, 513 in math and 487 in writing.[101]
In 2013, 21 Millville Area School District students took the SAT exams. The District's Verbal Average Score was 454.29. The Math average score was 474.29. The Writing average score was 441.90. The College Board reported that statewide scores were: 494 in reading, 504 in math and 482 in writing. The nationwide SAT results were the same as in 2012.[102]
In 2012, 34 Millville Area School District students took the SAT exams. The District's Verbal Average Score was 485. The Math average score was 491. The Writing average score was 468. The statewide Verbal SAT exams results were: Verbal 491, Math 501, Writing 480. In the USA, 1.65 million students took the exams achieving scores: Verbal 496, Math 514, Writing 488. According to the College Board the maximum score on each section was 800, and 360 students nationwide scored a perfect 2,400.
In 2011, 34 Millville Area School District students took the SAT exams. The District's Verbal Average Score was 500. The Math average score was 479. The Writing average score was 453.[103] Pennsylvania ranked 40th among states with SAT scores: Verbal - 493, Math - 501, Writing - 479.[104] In the United States, 1.65 million students took the exam in 2011. They averaged 497 (out of 800) verbal, 514 math and 489 in writing.[105]
The Pennsylvania Department of Education compared the SAT data of students in rural areas of Pennsylvania to students in urban areas. From 2003 to 2005, the average total SAT score for students in rural Pennsylvania was 992, while urban students averaged 1,006. During the same period, 28 percent of 11th and 12th graders in rural school districts took the exam, compared to 32 percent of urban students in the same grades. The average math and verbal scores were 495 and 497, respectively, for rural students, while urban test-takers averaged 499 and 507, respectively. Pennsylvania's SAT composite score ranked low on the national scale in 2004. The composite SAT score of 1,003 left Pennsylvania ranking 44 out of the 50 states and Washington, DC.[106]
Graduation requirements
The Millville Area School Board has determine that a student must earn 24 credits to graduate, including: English 4 credits, Science 3 credits, Math 3 credits, Social Studies 3 credits, Computer Courses 1 credit, Health/Physical Education 1.7 credits, Personal Finance 0.5 credits, Fine Arts 0.5 credits, Fit For Life 0.5 credist and 4.8 credits of electives.[107]
By law, all Pennsylvania secondary school students must complete a project as a part of their eligibility to graduate from high school. The type of project, its rigor and its expectations are set by the individual school district.[108] At Millville Area School District, the graduation project focuses on career exploration.[109] Effective with the graduating class of 2017, the Pennsylvania Board of Education eliminated the state mandate that students complete a culminating project in order to graduate.[110]
By Pennsylvania School Board regulations, beginning with the class of 2019,[111] public school students must demonstrate successful completion of secondary level course work in Algebra I, Biology, and English Literature by passing the Keystone Exams.[112][113][114] For the class of 2019, a composition exam will be added. For the class of 2020, passing a civics and government exam will be added to the graduation requirements.[115] In 2011, Pennsylvania high school students field tested the Algebra 1, Biology and English Lit exams. The statewide results were: Algebra 1 38% on grade level, Biology 35% on grade level and English Lit - 49% on grade level.[116] Individual student, school or district reports were not made public, although they were reported to district officials by the Pennsylvania Department of Education. Students identified as having special needs and qualifying for an Individual Educational Program (IEP) may graduate by meeting the requirements of their IEP.
Junior high school
- 2015 School Performance Profile
The PDE reported that 57% of 8th grade students at Millville Area Middle School students were on grade level in reading on the PSSAs given in April 2015. In math/Algebra 1, just 32% of 8th grade students showed on grade level skills. In science, 55% of the school's 8th graders demonstrated on grade level science understanding. No eighth grade writing scores were reported. In 7th grade, only 38% were on grade level in reading, while 66% showed on grade level math skills.[117] Statewide 58% of eighth (8th) graders were on grade level in reading, while 29% demonstrated on grade level math skills. Pennsylvania 7th graders were 58% on grade level in reading and 33% demonstrated on grade level math skills.[118]
- PSSAs history
Seventh grades have been tested in reading and mathematics since 2006. Eighth graders are tested in: reading, writing, mathematics and Science. Beginning in the Spring of 2013, eighth graders, who are enrolled in Algebra I take the Keystone Exam for Algebra I at the end of the course. The testing of 8th grade in reading and mathematics began in 1999, as a state initiative.[119] Testing in science began in 2007. The goal was for 100% of students to be on grade level or better in reading and mathematics, by the Spring of 2014. The tests focus on the state's Academic Standards for reading, writing, mathematics and science.[120] The standards were published in 1998 and are mandated by the Pennsylvania State Board of Education.[121] In 2014, the Commonwealth of Pennsylvania adopted the Pennsylvania Core Standards - Mathematics.[122]
|
|
- 8th Grade Science
- 2012 - 73% on grade level (5% below basic). State - 59%
- 2011 - 59% (14% below basic). State – 58.3%
- 2010 - 69% (22% below basic). State - 57%.
- 2009 - 47% (31% below basic). State - 54%[127]
- 2008 - 68% (14% below basic), State - 52%[128]
|
|
Millville Area Elementary School
Millville Area Elementary School is located at 370 Batten Lane, Millville. In 2015, Millville Area Elementary School enrollment declined further to 344 pupils in grades kindergarten through sixth. In 2014, the School's enrollment was 381 pupils in grades kindergarten through 6th, with 41.9% of pupils receiving a federal free or reduced price meals due to family poverty. Additionally, 15% of the pupils receive special education services, while 1.3% are identified as gifted.[129] According to a report by the Pennsylvania Department of Education, 100% of the teachers were rated highly qualified under No Child Left Behind. The school provides full day kindergarten.[130] The school is a federally designated Title I school.
According to the National Center for Education Statistics, in 2012, the School reported an enrollment of 400 pupils in grades kindergarten through 6th, with 42% of its pupils receiving a federal free or reduced price lunch due to family poverty. The school is a federally designated Title I school. The school employed 34 teachers yielding a student-teacher ratio of 12:1.[131] According to a report by the Pennsylvania Department of Education, 100% of its teachers were rated "Highly Qualified" under the federal No Child Left Behind Act.[132] The school provided full day kindergarten to all its pupils.[133]
- 2016 School Performance Profile
SPP 71 points of out 100. Millville Area Elementary School PSSA mandated testing results were: 44% of students in 6th grade were on grade level in reading, while just 19% of students demonstrated on grade level mathematics skills. In 5th grade, 51% of students were on grade level in reading, while 23% of students demonstrated on grade level mathematics skills. In 4th grade, 69% were on grade level in reading, while 43% demonstrated on grade level math skills. In science, 84% of fourth grade pupils demonstrated on grade level understanding of science concepts in the state standards. Among the school's third graders, 74% were on grade level in reading and 52% showed on grade level mathematics skills.[134][135]
- 2015 School Performance Profile
Among 6th graders, 60% were on grade level in reading and 28% were on grade level in mathematics. According to the Pennsylvania Department of Education, 35% of 5th grade students at Millville Area Elementary School were on grade level in reading on the PSSAs given in April 2015. In mathematics, just 11% of 5th grade students showed on grade level skills. No fifth grade writing scores were reported. In 4th grade, 59% were on grade level in reading, while 41% showed on grade level math skills. In science, 86% of fourth graders showed on grade level understanding. Among third (3rd) graders, 81% were on grade level in reading and 62% were on grade level in mathematics.[136] Statewide 61.9% of fifth (5th) graders were on grade level in reading, while 42.8% demonstrated on grade level math skills. Pennsylvania 4th graders were 58.6% on grade level in reading and 44.4% demonstrated on grade level math skills. In science, 77.3% of fourth graders showed on grade level understanding. Among Pennsylvania third (3rd) graders, 62% were reading on grade level, while 48.5% demonstrated on grade level math skills.[137]
- 2014 School Performance Profile
Millville Area Elementary School achieved a SPP score of 68.3 out of 100. The score reflects on grade level: reading, science, writing and mathematics achievement. In 2013-14, only 68% of the students were reading on grade level in grades 3rd through 6th. In 3rd grade, 64.4% of the pupils were reading on grade level. In math, 67.7% were on grade level (3rd-6th grades). In 4th grade science, just 93.7% of the pupils demonstrated on grade level understanding. In writing, only 47% of 5th grade pupils demonstrated on grade level skills.[138]
- 2013 School Performance Profile
Millville Area Elementary School achieved a score of 82.6 out of 100. The score reflects on grade level: reading, science, writing and mathematics achievement. In 2012-13, 71% of the students were reading on grade level in grades 3rd through 6th. In 3rd grade, 77.78% of the pupils were reading on grade level. In math, 84% were on grade level (3rd-6th grades). In 4th grade science, 95.45% of the pupils demonstrated on grade level understanding. Only 62% of 5th grade pupils demonstrated on grade level writing skills.[139]
- AYP History
In 2012, Millville Area Elementary School declined to Warning AYP status due to lagging reading achievement. In 2010 and 2011, Millville Area Elementary School achieved AYP status.[140] The attendance rate was 96% both years.[141]
- PSSA History
Each year, in the Spring, the 3rd graders and sixth graders take the PSSAs in math and reading. The fourth grade is tested in reading, math and science. The fifth grade is evaluated in reading, mathematics and writing. Pennsylvania System of School Assessments, commonly called PSSAs are No Child Left Behind Act related examinations which were administered beginning 2003 to all Pennsylvania public school students in grades 3rd-8th.[142] The goal was for 100% of students to be on grade level or better in reading and mathematics, by the Spring of 2014.[143][144][145] The tests focused on the state's Academic Standards for reading, writing, mathematics and science. The Science exam is given to 4th grades and includes content in science, technology, ecology and the environmental studies.[146]
|
6th Grade Reading: |
6th Grade Math:
|
|
5th Grade Reading:
|
5th Grade Math:
|
|
|
- 4th Grade Science
- 2012 - 97%, 65% advanced. State - 82%
- 2011 - 98%, 67% advanced (0% below basic). State – 82.9%
- 2010 - 95%, 78% advanced (0% below basic). State - 81%
- 2009 - 97%, 67% advanced (0% below basic), State - 83%
|
|
Wellness policy
Millville Area School Board established a district wellness policy in 2006 - Policy 246.[151] The policy deals with nutritious meals served at school, the control of access to some foods and beverages during school hours, age appropriate nutrition education for all students, and physical education for students K-12. The policy is in response to state mandates and federal legislation (P.L. 108 - 265). The law dictates that each school district participating in a program authorized by the Richard B. Russell National School Lunch Act (42 U.S.C. 1751 et seq) or the Child Nutrition Act of 1966 (42 U.S.C. 1771 et seq) "shall establish a local school wellness policy by School Year 2006." Most districts identified the superintendent and school foodservice director as responsible for ensuring local wellness policy implementation.[152]
The legislation placed the responsibility of developing a wellness policy at the local level so the individual needs of each district can be addressed. According to the requirements for the Local Wellness Policy, school districts must set goals for nutrition education, physical activity, campus food provision, and other school-based activities designed to promote student wellness. Additionally, districts are required to involve a broad group of individuals in policy development and to have a plan for measuring policy implementation. Districts were offered a choice of levels of implementation for limiting or prohibiting low nutrition foods on the school campus. In final implementation these regulations prohibit some foods and beverages on the school campus.[153] The Pennsylvania Department of Education required the district to submit a copy of the policy for approval.
The District offers a free school breakfast and free or reduced-price lunch to children in low income families. All students attending the school can eat breakfast and lunch. Children from families with incomes at or below 130 percent of the federal poverty level are provided a breakfast and lunch at no cost to the family. Children from families with incomes between 130 and 185 percent of the federal poverty level can be charged no more than 30 cents per breakfast. A foster child whose care and placement is the responsibility of the State or who is placed by a court with a caretaker household is eligible for both a free breakfast and a free lunch. Runaway, homeless and Migrant Youth are also automatically eligible for free meals.[154] The meals are partially funded with federal dollars through the United States Department of Agriculture (USDA).[155]
In 2013, the USDA issued new restrictions to foods in public schools. The rules apply to foods and beverages sold on all public school district campuses during the day. They limit vending machine snacks to a maximum of 200 calories per item. Additionally, all snack foods sold at school must meet competitive nutrient standards, meaning they must have fruits, vegetables, dairy or protein in them or contain at least 10 percent of the daily value of fiber, calcium, potassium, and Vitamin D.[156]
In 2014, President Obama ordered a prohibition of advertisements for unhealthy foods on public school campuses during the school day.[157] The Food and Drug Administration requires that students take milk as their beverage at lunch. In accordance with this law, any student requesting water in place of milk with their lunch must present a written request, signed by a doctor, documenting the need for water instead of milk.[158][159]
Millville Area School District provides health services as mandated by the Commonwealth and the federal government. A nurse is available in each building to conduct annual health screenings (data reported to the PDE and state Department of Health) and to dispense prescribed medications to students during the school day. Students can be excluded from school unless they comply with all the State Department of Health's extensive immunization mandates. School nurses monitor each pupil for this compliance.[160][161] Nurses also monitor each child's weight.[162]
Highmark Healthy High 5 grant
In 2011, the Millville Area School District received funding through a Highmark Healthy High 5 grant. Millville Area High School received $8,300 which was used to purchase equipment for Fit for Life, a required semester long course for all ninth-grade students.[163] Beginning in 2006, Highmark Foundation engaged in a 5-year, $100 million program to promote lifelong healthy behaviors in children and adolescents through local nonprofits and schools.
Special education
In December 2015, the District administration reported that 145 pupils or 20% of the district's pupils received Special Education services, with 53.8% of the identified students having a specific learning disability.[164]
In December 2012, Millville Area School District administration reported that 146 pupils or 20% of the district's pupils received Special Education services, with 52.7% having a specific learning disability.[165] In December 2010, Millville Area School District administration reported that 144 pupils or 19% of the district's pupils received Special Education services, with 49% having a specific learning disability. In December 2009, the district administration reported that 153 pupils or 20% of the district's pupils received Special Education services.[166] The district has identified that 17% of pupils have a Speech or Language disability.
In 2007, Pennsylvania Secretary of Education Gerald Zahorchak testified before the Pennsylvania House Education Committee regarding full day kindergarten. He claimed that districts which offered the program would see a significant decrease in special education students due to early identification and early intervention. He asserted the high cost of full day kindergarten would be recouped by Districts in lower special education costs.[167] The District has offered full day kindergarten since 2003.[168] Millville Area School District has seen an increase in the percentage of special education students it serves, yielding no savings in special education costs.
The District engages in identification procedures to ensure that eligible students receive an appropriate educational program consisting of special education and related services, individualized to meet student needs. At no cost to the parents, these services are provided in compliance with state and federal law; and are reasonably calculated to yield meaningful educational benefit and student progress.[169] To identify students who may be eligible for special education, various screening activities are conducted on an ongoing basis. These screening activities include: review of group-based data (cumulative records, enrollment records, health records, report cards, ability and achievement test scores); hearing, vision, motor, and speech/language screening; and review by the Instructional Support Team or Student Assistance Team. When screening results suggest that the student may be eligible, the District seeks parental consent to conduct a multidisciplinary evaluation. Parents who suspect their child is eligible may verbally request a multidisciplinary evaluation from a professional employee of the District or contact the building principal. Students in the Millville Area School District receive services through a combination of district operated programs and services contracted through the Central Susquehanna Intermediate Unit. Special education is designed to meet the needs of each exceptional student, including specifically designed instruction conducted in the classroom, home, community settings, hospitals, and other appropriate settings.
In 2010, the state of Pennsylvania provided $1,026,815,000 for Special Education services. The funds were distributed to districts based on a state policy which estimates that 16% of the district's pupils are receiving special education services. This funding is in addition to the state's basic education per pupil funding, as well as, all other state and federal funding.[170] The Pennsylvania Special Education funding system assumes that 16% of the district's students receive special education services. It also assumes that each student's needs accrue the same level of costs.[171] The state requires each district to have a three-year special education plan to meet the unique needs of its special education students.[172] Overidentification of students in order to increase state funding has been an issue in the Commonwealth. Some districts have more than 20% of its students receiving special education services while others have 10% supported through special education.[173] Millville Area School District has a high identification rate at 20% of pupils receiving special education services.[174]
The state requires each public school district and charter school to have a three-year special education plan to meet the unique needs of its special education students.[175] In 2012, the Obama Administration's US Department of Education issued a directive that schools shall include students with disabilities in extracurricular activities, including sports.[176]
Millville Area School District received a $465,142 supplement for special education services in 2010.[177] For the 2010-11, 2012–13, 2013–14 and 2014–15 school years, all Pennsylvania public school districts received the same level of funding for special education that they received in 2010. This level funding is provided regardless of changes in the number of pupils who need special education services and regardless of the level of services the respective students required.[178] In 2014, Millville Area School District received an increase to $476,333 in state special education funding.[179]
- 2016-17 school year, Millville Area School District received a 1.5% increase in state special education funding to $492,358.[180]
In 2013, the state's Special Education Funding Reform Commission provided a report on the state of funding for special education in the Commonwealth.[181] Funding for special education is borne largely on a local basis at 60%, with the state contributing $1 billion or 30% and the federal government providing 10% of the funding.
Gifted education
The District Administration reported that 16 or 2.15% of its students were gifted in 2009.[182] By law, the district must provide mentally gifted programs at all grade levels. The referral process for a gifted evaluation can be initiated by teachers or parents by contacting the student's building principal and requesting an evaluation. All requests must be made in writing. The principal acts as the case manager for the referral process. A 60 calendar day time-line begins when the signed Permission to Evaluate form is received. To be eligible for mentally gifted programs in Pennsylvania, a student must have a cognitive ability of at least 130 as measured on a standardized ability test by a certified school psychologist. Other factors that indicate giftedness will also be considered for eligibility.[183] Through the strategic planning process, the Superintendent must ensure that Columbia Borough School District provides a continuum of program and service options to meet the needs of all mentally gifted students for enrichment, acceleration, or both. The district's program is based on student needs and provides differentiated curriculum using acceleration, enrichment and pull-out options.[184]
Bullying Policy
The Millville Area School District administration reported there were zero incidents of bullying in the District in 2012. Additionally, there were no sexual incidents involving students. The local law enforcement was involved in three incidents at the schools, which resulted in two arrests.[185]
The Millville Area School District Administration reported that there were no incidents of bullying occurring in the schools in 2011. The District also reports there were 5 arrests at the schools.[186][187] Each year the school safety data is reported by the district to the Safe School Center which publishes the reports online.
Millville Area School Board prohibits bullying by district students and employees. The Board directs that complaints of bullying and harassment shall be investigated promptly, and corrective action shall be taken when allegations are verified. No reprisals or retaliation shall occur as a result of good faith reports of bullying.[188] All Pennsylvania schools are required to have an anti-bullying policy incorporated into their Code of Student Conduct. The policy must identify disciplinary actions for bullying and designate a school staff person to receive complaints of bullying. The policy must be available on the school's website and posted in every classroom. All Pennsylvania public schools must provide a copy of its anti-bullying policy to the Office for Safe Schools every year, and shall review their policy every three years. Additionally, the district must conduct an annual review of that policy with students.[189] District administration are required to annually provide the following information with the district's Safe School Report: the board's bullying policy, a report of bullying incidents in the school district, and information on the development and implementation of any bullying prevention, intervention or education programs. The Center for Schools and Communities works in partnership with the Pennsylvania Commission on Crime & Delinquency and the Pennsylvania Department of Education to assist schools and communities as they research, select and implement bullying prevention programs and initiatives.[190]
Pennsylvania state academic standards relating to student safety and antiharassment programs are described in the 10.3. Safety and Injury Prevention in the Pennsylvania Academic Standards for Health, Safety and Physical Education.[191][192]
Budget
Pennsylvania public school districts budget and expend funds according to procedures mandated by the General Assembly and the Pennsylvania Department of Education (PDE). An annual operating budget is prepared by school district administrative officials. A uniform form is furnished by the PDE and submitted to the board of school directors for approval prior to the beginning of each fiscal year on July 1.
Under Pennsylvania's Taxpayer Relief Act 1 of the Special Session of 2006, all school districts of the first class A, second class, third class and fourth class must adopt a preliminary budget proposal. The proposal must include estimated revenues and expenditures and the proposed tax rates. This proposed budget must be considered by the Board no later than 90 days prior to the date of the election immediately preceding the fiscal year. The preliminary budget proposal must also be printed and made available for public inspection at least 20 days prior to its adoption. The board of school directors may hold a public hearing on the budget, but are not required to do so. The board must give at least 10 days’ public notice of its intent to adopt the final budget according to Act 1 of 2006.[193]
- Labor agreement
In February 2016, the Millville Area School Board and Millville Area Teachers Union entered into a seven-year contract covering 2012 - 2019.[194] The contract is posted online in the School Board's website. The contract calls for 186 days with 182 student days with a 7.5 hours work day. Teacher who are required to work outside the contract days are paid at a $25 per hour rate. Teachers have a daily preparation period. Teachers receive: 5 bereavement leave days, 3 personal leave days, emergency leave days, child care leave days, and 2 professional leave days. Teachers pay 13% of their health insurance policy cost. They also receive: vision insurance, dental insurance and life insurance. For 2016-17 the salary range is $41,561 to $64,217.
- State Labor arbiter report
In August 2015, the Pennsylvania State Labor relations Board released a fact-finders report on the contract conflict between the Board and the Millville Area Teacher's Union.[195] The report was rejected by the Millville Area School District School Board.[196]
- Labor strike
In August 2014, the Millville Area School District teacher's union went on strike over wages and benefits, delaying the start of school.[197] In April 2015, Millville Area Teachers' Union again declared a strike starting Monday the 6th.[198] According to a report released in August 2012, by the Allegheny Institute for Public Policy, of the nearly 140 teacher strikes that occurred nationally between 2000 and 2007, 60 percent took place in Pennsylvania.[199] Pennsylvania is one of 13 states in which teacher strikes are legal. Pennsylvania has the highest rate of teacher strikes in the United States.[200] In the Commonwealth of Pennsylvania, there were three teacher union strikes in 2010; one teacher union strike in 2011, one teacher union strike in 2012 and three teacher union strikes in 2013.[201] Crestwood School District in Luzerne County went on strike in 2009. Neshaminy School District teachers union went on strike twice in 2012.[202][203] Wyoming Area School District, Old Forge School District and Shaler Area School District went on strike in the fall of 2013.[204] Wyoming Area School District and Danville Area School District teachers went on strike in the spring of 2014.[205] In the fall of 2014, three Pennsylvania public school district teachers unions went on strike including: Millville Area SD, East Allegheny School District and Old Forge School District.[206] State law gives the Pennsylvania Department of Education the power to order the teachers to return so that students will complete 180 days of instruction, by June 15.[207]
In 2013, the average teacher salary in Millville Area School District was $49,894 a year, while the cost of the benefits teachers receive was $22,692 per employee, for a total annual average teacher compensation of $72,586[208] Millville Area School District teacher and administrator retirement benefits are equal to at least 2.00% x Final Average Salary x Total Credited Service. (Some teachers benefits utilize a 2.50% benefit factor.) [209] After 40 years of service, a teacher can retire with 100% of the average salary of their final 3 years of employment. According to a study conducted at the American Enterprise Institute, in 2011, public school teachers’ total compensation is roughly 50 percent higher than they would likely receive in the private sector. The study found that the most generous benefits that teachers receive are not accounted for in many studies of compensation including: pension, retiree health benefits and job security.[210]
In 2011, the average teacher salary in Millville Area School District was $50,704 a year, while the cost of the benefits teachers receive was $15,084 per employee, for a total annual average teacher compensation of $65,788.[211]
In 2009, the Millville Area School District reports employing over 80 teachers with a starting salary of $35,000 for 186 days with 182 student instructional days.[212] The median salary was $52,663 and the top salary was $116,400.[213] The teachers work a 7-hour 30 minute days. Teachers earn extra pay for additional duties such as: department head, advising the clubs, writing curriculum or coaching athletics teams. The amount ranges from several hundred dollars a year to thousands. When a team progresses past the regular season the coaches are paid additional dollars for each week the team continues to play. In addition to salary, the teachers receive an extensive benefits package which includes: health insurance, life insurance, a defined benefit pension(teachers invest 7.5% of salary), 10 paid sick, 2 paid personal days, unlimited paid emergency leave, 2 paid professional leave days, reimbursement for college courses and more.[214]
In 2007, Millville Area School District employed 65 teachers. The average teacher salary in the district was $47,384 for 180 days worked.[215]
Per pupil spending Millville Area School District administrative costs per pupil were $873.09 in 2008. The district ranked 119th of 501 school districts for administrative spending. The lowest administrative cost per pupil in Pennsylvania was $398 per pupil.[216] In July 2007, the Millville School Board awarded a five-year contract to Dr. Kathleen Stark, as superintendent. In addition to the salary, she receives an extensive benefits package.[217] In 2009, the District reported Stark's salary as $116,400. John Fetterman, elementary principal's salary was $88,624. Brian Seely, high school principal's salary was $83,388.[218]
In 2008, Millville Area School District reported spending $13,674 per pupil. This ranked 218th in the commonwealth.[219] In 2010, the per pupil spending was $13,687.41.[220] The U.S. Census Bureau reported that Pennsylvania spent $8,191 per pupil in school year 2000-01.[221]
Among the fifty states, Pennsylvania's total per pupil revenue (including all sources) ranked 11th at $15,023 per student, in 2008-09.[222] Pennsylvania's total revenue per pupil rose to $16,186 ranking 9th in the nation in 2011.[223]
Reserves - In 2008, the Millville Area School District reported an unreserved designated fund balance of $1,087,526.00 and an unreserved-undesignated fund balance of $1,417,396.00.[224] In 2010, the reserves increased to: $2,011,436 unreserved designated fund and $1,278,035.00 unreserved-undesignated fund. By 2012, Millville Area School District's reserves were $4,234,716.[225] In 2014-15, MASD reported reserves of $6.75 million.[226] Pennsylvania public school district reserve funds are divided into two categories – designated and undesignated. The undesignated funds are not committed to any planned project. Designated funds and any other funds, such as capital reserves, are allocated to specific projects. School districts are required by state law to keep 5 percent of their annual spending in the undesignated reserve funds to preserve bond ratings. By law the state limits the total unreserved-undesignated fund balance at 8% of the annual budget for school districts that have budgets over $19 million a year. According to the Pennsylvania Department of Education, from 2003 to 2010, as a whole, Pennsylvania school districts amassed nearly $3 billion in reserved funds.[227] By 2013, reserves held by Pennsylvania public school districts, as a whole, had increased to over $3.8 billion.[228][229] In 2014, Millville Area School Board reported having $5,193,062 in reserve funds.
Bank bid-rigging settlement In January 2011, Millville Area School District was identified as a victim of an illegal bid-rigging scheme conducted by Bank of America.[230] Millville Area School District was to receive $28,245.84 from the Securities and Exchange Commission and Office of the Comptroller of the Currency portions of the settlement with Bank of America.
Audit In April 2009, the Pennsylvania Auditor General conducted a performance audit of the district. Findings were reported to the school board and administration.[231] In November 2011, the district was audited again. According to District officials, in school year 2009-10 the MASD provided basic educational services to 736 pupils through the employment of 76 teachers, 66 full-time and part-time support personnel, and 7 administrators. A failure to update memos of Understanding with area police departments was cited.[232]
Walking trail project The Millville Area School District is embarking on a taxpayer funded walking trail project which uses the school district's campus to provide a 1.5 mile walking trail. It will be partially funded by a grant from the Community Conservation Partnership Program from the Pennsylvania Department of Conservation and Natural Resources, Bureau of Recreation and Conservation.[233] The project must comply with the National Pollutant Discharge Elimination System as directed by the U.S. Environmental Protection Agency.[234]
Tuition Students who live in the Millville Area School District's attendance area may choose to attend one of Pennsylvania's 157 public charter schools. A student living in a neighboring public school district or a foreign exchange student may seek admission to Millville Area School District. For these cases, the Pennsylvania Department of Education sets an annual tuition rate for each school district. It is the amount the public school district pays to a charter school for each resident student that attends the charter and it is the amount a nonresident student's parents must pay to attend the Millville Area School District's schools. The 2012 tuition rates are Elementary School - $9,255, High School - $11,309.[235]
Health Contract In June 2013 the Board agreed to a contract with Geisinger Health Center to provide various health related services to students and employees at a cost of $96.51 per hour.[236]
Millville Area School District is funded by a combination of: a local earned income tax 1.2%,[237] a property tax, a real estate transfer tax 0.5%, and grants coupled with substantial funding from the Commonwealth of Pennsylvania and the federal government.[238] Grants can provide an opportunity to supplement school funding without raising local taxes. Interest earnings on accounts also provide nontax income to the District. In the Commonwealth of Pennsylvania, pension income and Social Security income are exempted from state personal income tax and local earned income tax, regardless of the level of the individual's personal wealth.[239] The average Pennsylvania public school teacher pension in 2011 exceeds $60,000 a year plus they receive federal Social Security benefits: both are free of Pennsylvania state income tax and local income tax which funds local public schools.[240] Effective 2016, active duty military are also exempted from paying the local earned income tax in Pennsylvania.[241][242]
State basic education funding
According to a report from Representative Todd Stephens office, Millville Area School District receives 53.4% of its annual revenue from the state.[243] This exceeds some education advocates goal of the state providing 50% of district funding.[244]
In December 2014, the Pennsylvania Education Funding Reform Commission conducted a hearing.[245][246] The commission developed a new basic education funding formula which sets a new way to distribute state basic education dollars. It abolished the practice of "hold harmless" funding, which gave districts at least the same as they got the previous school year regardless of declining enrollment. The plan became law in June 2016 (House Bill 1552).[247][248][249]
For the 2016-17 school year, Millville Area School District received $4,100,407 in Basic Education Funding from the Commonwealth of Pennsylvania. This is a 1.7% increase over 2015-16 funding to the District. The highest percentage of BEF increase in Columbia County was 3% awarded to Benton Area School District and Bloomsburg Area School District under the state’s Basic Education Funding formula. For the 2016-17 school year, Pennsylvania increased its public education spending to a record high of $5,895 billion. It was a $200 million increase, 3.51% increase over the 2015-16 appropriation.[250] The state also funded Ready to Learn grants at $250 million and Special Education funding received a $20 million increase.[251] The state also paid $492 million to the school employee social security fund and another $2.064 billion to the teacher’s pension fund.[252] Statewide Conestoga Valley School District received a 13.3% increase in state BEF funding. Five PA public school districts received an increase of 10% or greater in Basic Education funding over their 2015-16 funding.
In compliance with a legislative mandate that was passed with veto proof majorities in the PA House and Senate,[253] the final BEF funding was determined for 2015-16, in April 2016, MIllville Area School District received $4,030,033 in Basic Education Funds for the 2015-16 school year. This was a 1.35% increase yielding a $53,764 increase over the previous school year funding. The District also received $115,997 in Ready to Learn funding from the state.[254]
For the 2015-16 school year, Governor Tom Wolf released a partial Basic Education Funding (BEF) of $1,894,672 to Millville Area School District, in January 2016.[255] This was part of $10.3 billion in school funding withheld from the public schools, by the Governor since the summer of 2015.[256] The dispersement did not follow the new Basic Education Fair Funding formula which had been established by the Pennsylvania General Assemby in June 2015.[257] The District also received another $97,967 in state Ready to Learn Grant funding. In April 2016, Governor Wolf announced his finalized dispersement of 2015-16 state Basic Education Funding. Millville Area School District received a 0.88% increase for a total funding of $4,103,792.[258] This was $42,139 less than the District was to receive by law under the state's Fair Funding Formula approved in 2015.[259][260] The highest increase in funding statewide was to be awarded by Governor Wolf to Wilkinsburg Borough School District which was to get a 44.1% increase in state Basic Education Funding. The average BEF increase among the Commonwealth's 500 public school districts for 2015-16 was 2.21%. In Columbia County, the highest percentage increase in state school funding was awarded to Berwick Area School District - 2.62%.
For the 2014-15 school year, Millville Area School District received $3,976,270 in state Basic Education Funding (BEF). The District also received $91,794 in new Ready To Learn Block grant. The State's enacted Education Budget included $5,526,129,000 for the 2014-2015 Basic Education Funding.[261] The Education budget also includes Accountability Block Grant funding at $100 million and $241 million in new Ready to Learn funding for public schools that focus on student achievement and academic success. The State is paying $500.8 million to Social Security on the school employees behalf and another $1.16 billion to the state teachers pension system (PSERS). In total, Pennsylvania's Education budget for K-12 public schools is $10 billion. This was a $305 million increase over 2013-2014 state spending and the greatest amount ever allotted by the Commonwealth for its public schools.[262]
For the 2013-14 school year, the Millville Area School District received a 1.2% increase or $3,977,306 in Pennsylvania Basic Education Funding. This was $47,784 more than its 2012-13 state BEF to the District. Additionally, Millville Area School District received $47,261 in Accountability Block Grant funding to focus on academic achievement and level funding for special education services. Among the public school districts in Columbia County, Southern Columbia Area School District received the highest percentage BEF increase at 2.1%. The District has the option of applying for several other state and federal grants to increase revenues. The Commonwealth's budget increased Basic Education Funding statewide by $123 million to over $5.5 billion. Most of Pennsylvania's 500 public school districts received an increase of Basic Education Funding in a range of 0.9% to 4%. Eight public school districts received exceptionally high funding of 10% to 16%. Statewide the highest increase in state funding was awarded to Austin Area School District which received a 22.5% increase in Basic Education Funding.[263] The state funded the PSERS (Pennsylvania school employee pension fund) with $1,017,000,000 and Social Security payments for school employees of $495 million.[264]
For the 2012-13 school year, Millville Area School District received $3,976,783 in state BEF dollars.[265] The Governor's Executive Budget for 2012-2013 included $9.34 billion for kindergarten through 12th grade public education, including $5.4 billion in basic education funding, which was an increase of $49 million over the 2011-12 budget. In addition, the Commonwealth provided $100 million for the Accountability Block Grant (ABG) program. Millville Area School District also received $47,261 in ABG funds. The state also provided a $544.4 million payment for School Employees’ Social Security and $856 million for School Employees’ Retirement fund called PSERS.[266] This amount was a $21,823,000 increase (0.34%) over the 2011-2012 appropriations for Basic Education Funding, School Employees' Social Security, Pupil Transportation, Nonpublic and Charter School Pupil Transportation. Since taking office, Corbett's first two budgets have restored more than $918 million in support of public schools, compensating for the $1 billion in federal stimulus dollars lost at the end of the 2010-11 school year.
For the 2011-12 school year, Millville Area School District received a $3,929,522 allocation of state Basic Education Funding.[267][268] Additionally, Millville Area School District received $47,260 in Accountability Block Grant funding. The enacted Pennsylvania state Education budget includes $5,354,629,000 for the 2011-2012 Basic Education Funding appropriation. This amount is a $233,290,000 increase (4.6%) over the enacted State appropriation for 2010-2011.[269] The highest increase in state basic education funding was awarded to Duquesne City School District, which got a 49% increase in state funding for 2011-12.[270] In 2010, the District reported that 266 students received free or reduced-price lunches, due to the family meeting the federal poverty level.[271]
For the 2010-11 school year, Millville Area School District received a 2.66% increase in state basic education funding for a total of $4,120,561. One hundred fifty Pennsylvania school districts received the base 2% increase. The highest increase in Columbia County was awarded to Southern Columbia Area School District at 7.38%. Among Pennsylvania school districts, the highest increase in 2010-11 went to Kennett Consolidated School District in Chester County which received a 23.65% increase in state basic education funding.[272] Fifteen (15) Pennsylvania public school districts received a BEF increase of greater than 10%. The state's hold harmless policy regarding state basic education funding continued where each district received at least the same amount as it received the prior school year, even where enrollment had significantly declined. The amount of increase each school district received was determined by then Governor Edward Rendell and the Secretary of Education Gerald Zahorchak, through the allocation set in the state budget proposal made in February each year.[273] This was the second year of Governor Rendell's policy to fund some public school districts at a far greater rate than others.[274]
In the 2009-2010 school year, the Commonwealth of Pennsylvania provided Millville Area School District with a 2.15% increase in Basic Education Funding for a total of $4,013,934. Among Columbia County school districts, the largest increase a 6.11%, went to Berwick Area School District. In Pennsylvania, fifteen school districts received basic education funding increases over 10% in 2009. The largest increase went to Muhlenberg School District of Berks County which received 22.31% increase in 2009-10.[275] The amount of increase each school district received was set by then Governor Edward G Rendell and the Secretary of Education, Gerald Zahorchak, as a part of the state budget proposal given each February.[276] According to the U.S. Census Bureau, Pennsylvania spent $7,824 Per Pupil in the year 2000. This amount increased up to $12,085 by the year 2008.[277][278]
The state Basic Education Funding to the Millville Area School District in 2008-09 was $3,929,521.72.[279] According to the Pennsylvania Department of Education, Millville Area School District had 259 students receiving free or reduced-price lunches due to low family income in the 2007-2008 school year.
Accountability Block Grants
Beginning in 2004-05, the state launched the Accountability Block Grant school funding. This program has provided $1.5 billion to Pennsylvania's school districts. The Accountability Block Grant program requires that its taxpayer dollars are focused on specific interventions that are most likely to increase student academic achievement. These interventions include: teacher training, all-day kindergarten, lower class size K-3rd grade, literacy and math coaching programs that provide teachers with individualized job-embedded professional development to improve their instruction, before or after school tutoring assistance to struggling students. For the 2010-11 school year, the Millville Area School District applied for and received $128,277, in addition to all other state and federal funding. The District used the funding to provide all-day kindergarten for the seventh year, to revise the science curriculum and to reform the high school instructional program.[280][281][282]
Ready to Learn grant
Beginning in the 2014-2015 budget, the State funded a new Ready to Learn Grant for public schools. A total of $100 million is allocated through a formula to districts based on the number of students, level of poverty of community as calculated by its market value/personal income aid ratio (MV/PI AR) and the number of English language learners. Ready to Learn Block Grant funds may be used by the Districts for: school safety; Ready by 3 early childhood intervention programs; individualized learning programs; and science, technology, engineering and math (STEM) programs.[283]
Classrooms for the Future grant
The Classroom for the Future state program provided districts with hundreds of thousands of extra state funding to buy laptop computers for each core curriculum high school class (English, Science, History, Math) and paid for teacher training to optimize the computers use. The state grant requires the district hire a part-time technology coach, whose role is to assist the teachers in using the equipment and software effectively to improve their instruction. The salary is covered by the grant.[284] The program was funded from 2006-2009. Millville Area School District did not apply for funding in 2006-07. The District received $107,274 in 2007-08 and $45,413 in 2008-09 for a total funding of $152,687.[285] In Columbia County the highest award was given to Berwick Area School District an $403,446 award. The highest funding statewide was awarded to Philadelphia City School District in Philadelphia County - $9,409,073. The grant program was discontinued by Governor Edward Rendell as part of the 2009-10 state budget.
Project 720
Project 720 was a high school reform program implemented for three years under the Rendell administration. The intent was to increase academic rigor and improve the instruction of teachers in the Commonwealth's high schools. Teachers were expected touse data driven instructional practices and to meet the needs of diverse learners.[286] The 720 in the name referred to the number of days a student was in high school in ninth through 12th grades. High schools applied for funding and were to agree to report to the PDE their plans, their actions and the outcomes. In 2007-08 budget year, the Commonwealth provided $11 million in funding. Millville Area School District was one of 161 PA public school district to apply, receiving $57,601 in funding over three years.[287][288] For 2010-11, Project 720 funding was decreased to $1.7 million by Governor Rendell. The grant program was discontinued effective with the 2011-12 state budget.[289]
Other grants
The District has not participated in Science its Elementary grant (discontinued effective with 2009-10 budget by Governor Rendell), Environmental Education grants, Education Assistance Grants, Pre K Counts grants, 21st Century Community Learning Centers Grants or federal Striving Readers Comprehensive Literacy grant. The District also did not participate in the state's 2013 Safe Schools Targeted Grant.[290]
Federal grants
The Millville Area School District received $762,483 in ARRA (Federal Stimulus) funding. This was in addition to all other state and federal education funding programs.[291] The funding was limited to the 2009-10 and 2010-11 school years.[292] Due to the temporary nature of the funding, schools were repeatedly advised to use the funds for one-time expenditures like acquiring equipment, making repairs to buildings, training teachers to provide more effective instruction or purchasing books and software.
Race to the Top grant
The Millville Area School Board and School District Administration chose to not participate in the federal government grant program called Race to the Top. The grant would have meant hundreds of thousands in additional federal dollars that would have been focused on improving student academic achievement.[293] Participation required the administration, the school board and the local teachers' union to sign an agreement to prioritize improving student academic success.[294][295] In Pennsylvania, 120 public school districts and 56 charter schools agreed to participate. Pennsylvania was not approved for the grant. The failure of many school districts to agree to participate was cited as one reason that Pennsylvania was not approved.[296]
Title II grants
The Federal government provides annual grants to schools to be used to improve the quality of teacher instructions to pupils. The goal is provide each child in public schools with "Highly Quality" teachers and principals as defined by the state.[297] The funds are sent to the state Department of Education which distributes them to each school district and charter school.[298] Beginning in 2002, the federal funding committed to Title II was $3,175,000,000.
Public school district administrations must apply to the state annually for the Title II funds. In 2012-13, Millville Area School District received $51,494 in federal Title II funding.[299] In 2014-15, Millville Area School District applied for and received $48,024.[300]
English language learners grant
The Federal government provides annual grants to schools to assist in educating immigrant children and children who are identified as limited English proficient.[301] Upon registering for school a language survey is done for all new enrollment pupils, typically in kindergarten or preschool. They identify the primary language spoken at home. This data is collected and submitted to the Pennsylvania Department of Education, which in turn notifies the federal government.[302]
In 2012-13, Millville Area School District received $272 in Title III funding for English language learners.[303]
Common Cents state initiative
The Millville Area School Board chose to not participate in the Pennsylvania Department of Education Common Cents program. The program called for the state to audit the district, at no cost to local taxpayers, to identify ways the district could save tax dollars.[304] After the review of the information, the district was not required to implement any of the recommended cost savings changes.
Real estate taxes
Property tax rates in 2016-17 were set by the Millville Area School Board at 47.4500 mills.[305] A mill is $1 of tax for every $1,000 of a property's assessed value. Irregular property reassessments have become a serious issue, in the Commonwealth, as it creates a significant disparity in taxation within a community and across a region.[306] Property taxes, in the Commonwealth of Pennsylvania, apply only to real estate - land and buildings. The property tax is not levied on cars, business inventory, or other personal property. Certain types of property are exempt from property taxes, including: places of worship, places of burial, private social clubs, charitable and educational institutions and government property. Additionally, service related, disabled US military veterans may seek an exemption from paying property taxes. Unlike other states, under Pennsylvania state tax policy, natural gas and oil pipelines are exempted from property taxes.[307] There are a plethora of gas pipelines in the District due to marcellus shale gas development.[308] Pipeline companies prohibit development within the 100 foot wide right-of-way, there by limiting future development options for the landowner. This limits future potential property tax revenues for the school district, by constraining future land development. Located in the marcellus shale region. Millville Area School District is adversely impacted this way.[309][310][311] The Atlantic Sunrise Gas Pipeline passes through Greenwood Township.[312]
Pennsylvania school district revenues are dominated by two main sources: 1) Property tax collections, which account for the vast majority (between 75-85%) of local revenues; and 2) Act 511 tax collections, which are around 15% of revenues for school districts.[313] When a Pennsylvania public school district includes municipalities in two counties, each of which has different rates of property tax assessment, a state board equalizes the tax rates between the counties.[314] In 2010, miscalculations by the State Tax Equalization Board (STEB) were widespread in the Commonwealth and adversely impacted funding for many school districts, including those that did not cross county borders.[315]
The average yearly property tax paid by Columbia County residents amounts to about 2.72% of their yearly income. Columbia County ranked 776th out of the 3143 United States counties for property taxes as a percentage of median income.[325] According to a report prepared by the Pennsylvania Department of Education, the total real estate taxes collected by all school districts in Pennsylvania rose from $6,474,133,936 in 1999-00 to $10,438,463,356 in 2008-09 and to $11,153,412,490 in 2011.[326] Property taxes in Pennsylvania are relatively high on a national scale. According to the Tax Foundation, Pennsylvania ranked 11th in the U.S. in 2008 in terms of property taxes paid as a percentage of home value (1.34%) and 12th in the country in terms of property taxes as a percentage of income (3.55%).[327]
Act 1 Adjusted index
The Act 1 of 2006 Index regulates the rates at which each school district can raise property taxes in Pennsylvania. Districts are not allowed to raise taxes above that index unless they allow voters to vote by referendum, or they seek an exception from the state Department of Education. The base index for the 2010-2011 school year is 2.9 percent, but it can be adjusted higher, depending on a number of factors, such as property values and the personal income of district residents. Act 1 included 10 exceptions, including: increasing pension costs, increases in special education costs, a catastrophe like a fire or flood, increasing rising health care costs for contracts in effect in 2006 or dwindling tax bases. The base index is the average of the percentage increase in the statewide average weekly wage, as determined by the PA Department of Labor and Industry, for the preceding calendar year and the percentage increase in the Employment Cost Index for Elementary and Secondary Schools, as determined by the Bureau of Labor Statistics in the U.S. Department of Labor, for the previous 12-month period ending June 30. For a school district with a market value/personal income aid ratio (MV/PI AR) greater than 0.4000, its index equals the base index multiplied by the sum of .75 and its MV/PI AR for the current year.[328] In June 2011, the Pennsylvania General Assembly eliminated six of the ten the exceptions to the Act 1 Index.[329] The following exceptions were maintained: 1) costs to pay interest and principal on indebtedness incurred prior to September 4, 2004 for Act 72 schools and prior to June 27, 2006 for non-Act 72 schools; 2) costs to pay interest and principal on electoral debt; 3) costs incurred in providing special education programs and services (beyond what is already paid by the State); and 4) costs due to increases of more than the Index in the school's share of payments to PSERS taking into account on the PSERS contribution rate.[330][331] The legislature also froze the payroll amount public school districts use to calculate the pension-plan exception at the 2012 payroll levels. Further increases in payroll cannot be used to raise the district's exception for pension payments.
A specific timeline for Act I Index decisions is published annually, by the Pennsylvania Department of Education.[332]
The School District Adjusted Index for the Millville Area School District 2006-2007 through 2010-2011.[333]
For the 2016-17 budget year, Millville Area School Board did not apply for any exceptions to exceed the District's Act 1 Index limit.[344] Statewide 299 school districts adopted a resolution to not exceed their Act I index in 2016-17. For the school budget 2016-17, 299 Pennsylvania public school districts adopted a resolution certifying that tax rates would not be increased above its Act 1 Index limit. Another 198 school districts adopted a preliminary budget leaving open the option of exceeding the District's Act 1 Index limit. Of the 198 school districts that adopted a preliminary budget, 179 adopted real estate taxes that exceeded the school district's index.
For the 2015-16 budget year, Millville Area School Board did not apply for any exceptions to exceed their Act 1 Index limit. For the school budget 2015-16, 310 Pennsylvania public school districts adopted a resolution certifying that tax rates would not be increased above its Act 1 Index limit. Another 187 school districts adopted a preliminary budget leaving open the option of exceeding the Index limit. Regarding the pension costs exception, 172 school districts received approval to exceed the Index limit in full, while others received a partial approval of their request. For special education costs, 119 districts received approval to exceed their tax limit. No Pennsylvania public school districts received an approval for the grandfathered construction debts exception.[345]
For the 2014-15 budget year, Millville Area School Board did not apply for exceptions to exceed their Act 1 Index limit. For the school budget 2014-15, 316 Pennsylvania public school districts adopted a resolution certifying that tax rates would not be increased above its Act 1 Index limit. Another 181 school districts adopted a preliminary budget leaving open the option of exceeding the Index limit. Districts may apply for multiple exceptions each year. For the pension costs exception, 163 school districts received approval to exceed the Index in full, while others received a partial approval of their request. For special education costs, 104 districts received approval to exceed their tax limit. Seven Pennsylvania public school districts received an approval for the grandfathered construction debts exception.[346]
For the 2013-14 budget year, Millville Area School Board did not apply for exceptions to exceed their Act 1 Index limit. For the school budget year 2013-14, 311 Pennsylvania public school districts adopted a resolution certifying that tax rates would not be increased above their index. Another 171 school districts adopted a preliminary budget leaving open the option of exceeded the Index limit. For the exception for pension costs, 89 school districts received approval to exceed the Index in full while others received a partial approval of their request. For special education costs, 75 districts received approval to exceed their tax limit. For the pension costs exception, 169 school districts received approval to exceed the Index. Eleven Pennsylvania public school districts received an approval for grandfathered construction debts.[347]
For the 2012-13 budget year, Millville Area School Board did not apply for exceptions to exceed the Act 1 Index. For 2012-2013, 274 school districts adopted a resolution certifying that tax rates would not be increased above their index; 223 school districts adopted a preliminary budget leaving open the option of exceeded the Index limit. For the exception for pension costs, 194 school districts received approval to exceed the Index. For special education costs, 129 districts received approval to exceed the tax limit.[348]
For the 2011-12 school year, the Millville Area School Board applied for two exceptions to exceed the Act 1 Index. The PDE approved the increase for pension costs, but it denied the special education costs request.[349] Each year, the Millville Area School Board has the option of adopting either 1) a resolution in January certifying they will not increase taxes above their index or 2) a preliminary budget in February. A school district adopting the resolution may not apply for referendum exceptions or ask voters for a tax increase above the inflation index. A specific timeline for these decisions is published annually, by the Pennsylvania Department of Education.[350]
According to a state report, for the 2011-2012 school year budgets, 247 school districts adopted a resolution certifying that tax rates would not be increased above their index; 250 school districts adopted a preliminary budget. Of the 250 school districts that adopted a preliminary budget, 231 adopted real estate tax rates that exceeded their index. Tax rate increases in the other 19 school districts that adopted a preliminary budget did not exceed the school district's index. Of the districts who sought exceptions: 221 used the pension costs exemption and 171 sought a Special Education costs exemption. Only 1 school district sought an exemption for Nonacademic School Construction Project, while 1 sought an exception for Electoral debt for school construction.[351]
Millville Area School Board did not apply for exceptions to exceed the Act 1 index for the budgets in 2009-10 or in 2010-11.[352][353] In the Spring of 2010, 135 Pennsylvania school boards asked to exceed their adjusted index. Approval was granted to 133 of them and 128 sought an exception for pension costs increases.[354]
Property tax relief
In 2013, the Homestead/Farmstead Property Tax Relief from gambling for the Millville Area School District was $185 per approved permanent primary residence and farmstead. There were 1,569 approved properties.[355] In 2010, the Homestead/Farmstead Property Tax Relief from gambling for the Millville Area School District was $185 per approved permanent primary residence and farmstead.[356] In the district, 1,565 property owners applied for the tax relief. In 2009 the district tax relief was set at $190.[357] In Columbia County, neighboring Benton Area School District received the highest relief at $225 for 2010. The relief was subtracted from the total annual school property tax bill. Property owners apply for the relief through the county Treasurer's office. Farmers can qualify for a farmstead exemption on building used for agricultural purposes. The farm must be at least 10 contiguous acres and must be the primary residence of the owner. Farmers can qualify for both the homestead exemption and the farmstead exemption. In Columbia County 71% of eligible property owners applied for tax relief in 2009.[358] Pennsylvania awarded the highest property tax relief to residents of the Chester-Upland School District in Delaware County at $632 per homestead and farmstead in 2010.[359] This was the second year they were the top recipient.
In Pennsylvania, the homestead exclusion reduces the assessed values of homestead properties, reducing the property tax on these homes. The homestead exclusion allows homeowners real property tax relief of up to one half of the median assessed value of homesteads in the taxing jurisdiction (county, school district, city, borough, or township).[360]
Extracurriculars
The Millville Area School District offers a variety of clubs, activities and sports programs. The Millville Area School Board determines eligibility policies to participate in these programs.[361] The District reports spending over $300,000 a year providing student activities.[362]
By Pennsylvania law, all K-12 students in the district, including those who attend a private nonpublic school, cyber charter school, charter school and those homeschooled, are eligible to participate in the District's extracurricular programs, including all athletics. They must meet the same eligibility rules as the students enrolled in the District's schools.[363]
Sports
Junior varsity and varsity athletic activities are under the Pennsylvania Interscholastic Athletic Association and the regional Pennsylvania Heartland Athletic Conference. Coaches receive compensation as outlined in the teachers' union contract. When athletic competition exceeds the regular season, additional compensation is paid.[364] According to Pennsylvania's Safety in Youth Sports Act, all sports coaches, paid and volunteer, are required to annually complete the Concussion Management Certification Training and present the certification before coaching.[365] Millville Area School District provides its athletics disclosure form on its web site.[366] Article XVI-C of the Public School Code requires the disclosure of interscholastic athletic opportunities for all public secondary school entities in Pennsylvania. All school entities with grades 7-12 are required to annually collect data concerning team and financial information for all male and female athletes beginning with the 2012-13 school year and submit the information to the Pennsylvania Department of Education. Beginning with the 2013-14 school year, all non-school (booster club and alumni) contributions and purchases must also be reported to PDE.[367]
The District funds:
|
|
- Junior High School Sports
|
|
According to PIAA directory July 2012 [368]
Enrollment
The Pennsylvania Department of Education reports that there are less than 700 students enrolled in K-12 through 2019.[369] The administrative infrastructure costs per pupil are in the top 20% of Pennsylvania school districts. With limited resources, opportunities for students at the high school are limited. Consolidation of administrations with an adjacent school district like Benton Area School District (which also has fewer than 800 students) would achieve substantial administrative cost savings for people in both communities. These excessive administrative overhead dollars could be redirected to improving student academic achievement, enriching the curriculum programs or to reducing local property taxes. Consolidation of two central administrations into one would not require the closing of any schools.[370]
In 2007, Standard and Poors, at the request of the General Assembly, studied consolidation of small school districts. The study examined consolidation with Benton Area School District and found annual savings of over $1,433,719. The study also examined a potential consolidation with East Lycoming School District estimating savings of $1,970,040.[371] Over the next 10 years, rural Pennsylvania school enrollment is projected to decrease 8 percent.[372] As the enrollment declines, per pupil administrative costs of the schools will continue to rise.
In March 2011, the Pennsylvania Institute of Certified Public Accountants Fiscal Responsibility Task Force released a report which found that consolidating school district administrations with one neighboring district would save the Commonwealth $1.2 billion without forcing the consolidation of any schools.[373]
Pennsylvania has one of the highest numbers of school districts in the nation. In Pennsylvania, 80% of the school districts serve student populations under 5,000, and 40% serve less than 2,000. This results in excessive school administration bureaucracy and not enough course diversity.[374] In a survey of 88 superintendents of small districts, 42% of the 49 respondents stated that they thought consolidation would save money without closing any schools.[375] Pennsylvania schools added 17,345 professional employees and 15,582 support workers over this time, while enrollment declined by 26,960.
Pennsylvania's birth rate has been declining for two decades. According to data from the Pennsylvania Department of Health, in 1990, the Commonwealth of Pennsylvania's birth rate was 171,053.[376] In 2000, Pennsylvania's birth rate was 145,874.[377] Finally in 2011, the State's birth rate declined further to 142,021.[378] From 2000 to 2009, the number of babies born in rural counties declined 5 percent.[379] Urban counties have also experienced a decline in the number of school aged children. From 2000-2010 urban Pennsylvania counties had a 3 percent decline in the number of residents under 18 years old. In 2010, there were 2.07 million residents, or 22 percent of the urban population, who were under age 18.[380] In 1990, the birth rate in Columbia County was 750 births. In 2000, the County's birth rate declined to 614 births. In 2011, Columbia County's birth rate was 620 births.[381]
References
- ↑ Millville Area School Board (2014). "Contract for Employment of District superintendent" (PDF).
- ↑ Triblive News (2015). "Pennsylvania teacher salary search".
- ↑ NCES, Common Core of Data - Millville Area School District, 2014
- ↑ National Center For Education Statistics, Common Core of Data - Millville Area School District, 2013
- ↑ National Center For Education Statistics, Common Core of Data - Millville Area School District, 2011
- ↑ Pennsylvania Department of Education (October 14, 2015). "District Fast Facts 2016 Millville Area School District".
- ↑ Pennsylvania Department of Education (November 4, 2015). "District Fast Facts 2015 Millville Area School District".
- ↑ Pennsylvania Department of Education (November 6, 2014). "District Fast Facts 2014 Millville Area School District".
- ↑ PDE, District Fast Facts 2013 Millville Area School District, October 4, 2013
- ↑ Pennsylvania Department of Education, Enrollment and Projections by LEA, 2011
- ↑ Pennsylvania Department of Education, Enrollment and Projections by LEA, July 2011
- ↑ PDE, Enrollment by LEA 2015, 2015
- ↑ Millville Area School Administration (May 12, 2016). "Millville Area School Board Budget Report to PDE 2016-17" (PDF).
- ↑ Millville Area School Administration, Millville Area School Board Budget report to PDE 2015-16, June 2015
- ↑ Millville Area School Administration, Millville Area School Board Budget report to PDE, May 13, 2013
- ↑ Millville Area School Board Secretary, Millville Area School Board Meeting minutes, June 25, 2012
- ↑ US Census Bureau, 2010 Census Poverty Data by Local Educational Agency, 2011
- ↑ proximityone (2014). "School District Comparative Analysis Profiles".
- ↑ Pennsylvania Budget and Policy Center, Education Facts Student Poverty Concentration by LEA, 2012
- ↑ US Census Bureau, American Fact Finder, 2009
- ↑ US Census Bureau, (2010). "American Fact Finder, State and County quick facts".
- ↑ US Census Bureau (September 2011). "Income, Poverty, and Health Insurance Coverage in the United States: 2010" (PDF).
- ↑ Pennsylvania Public School Code Governance 2010
- ↑ Pennsylvania General Assembly, Pennsylvania School Code, 2013
- ↑ The Commonwealth Foundation for Public Policy Alternatives, The Pennsylvania Project, May 20, 2010
- ↑ Pittsburgh Business Times (April 12, 2016). "Chester County district leads statewide Honor Roll 2016".
- ↑ Pittsburgh Business Times (April 11, 2014). "Guide to Pennsylvania Schools Statewide School District Ranking 2014".
- ↑ Pittsburgh Business Times, Guide to Pennsylvania Schools Statewide School District Ranking 2015, April 10, 2015
- ↑ Pittsburgh Business Times (April 11, 2014). "Western Pennsylvania School Guide 2014".
- ↑ Pittsburgh Business Times (April 5, 2013). "Statewide Honor Roll Rankings 2013".
- ↑ Pittsburgh Business Times, Guide to Pennsylvania Schools- Statewide School Districts Ranking 2012, April 5, 2012
- ↑ Pittsburgh Business Times, Pennsylvania Public School Honor Roll Rankings 2011, April 4, 2011
- ↑ Pittsburgh Business Times, Pennsylvania Public School Honor Roll Rankings 2010, May 6, 2010
- ↑ Pittsburgh Business Times (May 23, 2007). "Three of top school districts in state hail from Allegheny County".
- ↑ Pittsburgh Business Times (2013). "Millville Area School District ranking 2013".
- ↑ Pittsburgh Business Times, Overachiever statewide ranking, May 6, 2010
- ↑ "2009 PSSA RESULTS Millville Area School District". The Morning Call. April 2011.
- ↑ Pennsylvania Department of education (2012). "Millville Area School District AYP Overview 2012".
- ↑ Pennsylvania Department of Education, Pennsylvania Public School District AYP History, 2011
- ↑ PDE, School Performance Profile Millville Area School District Fast Facts 2016, October 14, 2016
- ↑ PDE, School Performance Profile Millville Area School District Fast Facts 2015, November 4, 2015
- ↑ PDE, School Performance Profile Millville Area School District Fast Facts 2014, November 6, 2014
- ↑ PDE, School Performance Profile Millville Area School District Fast Facts 2013, October 4, 2013
- ↑ Pennsylvania Department of Education, Millville Area School District AYP Data Table 2012, September 21, 2012
- ↑ Pennsylvania Department of Education, Millville Area School District AYP Data Table 2011, September 29, 2011
- ↑ Pennsylvania Department of Education (March 15, 2011). "New 4-year Cohort Graduation Rate Calculation Now Being Implemented".
- ↑ Pennsylvania Department of Education, Millville Area School District Report Card Data Table 2010, October 20, 2010
- ↑ Pennsylvania Department of Education, Millville Area School District Report Card Data Table 2009, 2009
- ↑ Pennsylvania Partnerships for Children (2008). "High School Graduation rate 2007" (PDF).
- ↑ Pennsylvania Department of Education, Millville Area Junior Senior high School Report Card 2006, 2006
- ↑ Millville Area School District Strategic Plan http://www.millville.k12.pa.us/millville/Administration/Strategic%20Plans/
- ↑ US News and World Report, Best High Schools, 2014
- ↑ National Center for Education Statistics, Common Core Data - Millville Area Junior Senior High School, 2010
- ↑ Pennsylvania Department of Education, Professional Qualifications of Teachers Millville Area Junior Senior High School 2012, September 21, 2012
- ↑ Pennsylvania Department of Education (September 29, 2016). "2016 PSSA AND KEYSTONE Results".
- ↑ Pennsylvania Department of Education (August 2016). "Findings and Recommendations Pursuant to Act 1 of 2016" (PDF).
- ↑ Jan Murphy (October 16, 2016). "How District schools fared overall".
- ↑ Pennsylvania Department of Education (September 29, 2016). "2016 PSSA AND KEYSTONE Results".
- ↑ Pennsylvania Department of Education (November 4, 2015). "Millville Area High School School Performance Profile 2015".
- ↑ Jan Murphy (November 4, 2015). "Report card for state's high schools show overall decline". Pennlive.com.
- ↑ Pennsylvania Department of Education (November 4, 2015). "2015 Keystone Exam School Level Data".
- ↑ Pennsylvania Department of Education (November 6, 2014). "Millville Area High School Academic Performance Data 2014".
- ↑ Evamarie Socha (November 6, 2014). "Half of Valley districts see state test scores decline". The Daily Item.
- ↑ Eleanor Chute (November 21, 2014). "Pennsylvania student scores declined with reduced funding, test results show". Pittsburgh Post-Gazette.
- ↑ Acting Secretary of Education Carolyn Dumaresq, Acting Secretary of Education Announces Results of 2013-14 School Performance Profile; Strong Performance in 72 Percent of Schools, November 6, 2014
- ↑ Kathy Boccella; Dylan Purcell & Kristen A. Graham (November 6, 2014). "Pa. school rankings: Downingtown STEM No. 1; Phila. falters". Philadelphia Inquirer.
- ↑ Jan Murphy (November 6, 2014). "More Pa. school scores decline than improve, state report card shows". Pennlive.com.
- ↑ Pennsylvania Department of Education (October 4, 2013). "Millville Area Junior Senior High School Academic Performance Data 2013".
- ↑ Pennsylvania Department of Education (September 21, 2012). "MILLVILLE Area Junior Senior High School AYP Overview".
- ↑ Pennsylvania Department of Education, MILLVILLE AREA Junior Senior High School AYP Overview, September 29, 2011
- ↑ Eleventh grade ranking in Pennsylvania, SchoolDigger.com. Accessed April 2010
- ↑ Pennsylvania Department of Education (2014). "State Academic Standards".
- ↑ Pennsylvania Department of Education (2014). "State Assessment System".
- ↑ Pittsburgh Post Gazette (October 15, 2012). "How is your school doing?".
- ↑ Pennsylvania Department of Education (2010). "Millville Area Junior Senior High School" (PDF).
- ↑ Pennsylvania Department of Education, Central Pennsylvania High Schools Math Ranking 2009, 2010
- ↑ Pennsylvania Department of Education, Central Pennsylvania Public High School Math Ranking 2009
- ↑ Pennsylvania Department of Education (September 29, 2012). "2011-2012 PSSA and AYP Results".
- ↑ Pennsylvania Department of Education (September 29, 2011). "2010-2011 PSSA and AYP Results".
- ↑ Pennsylvania Department of Education, Millville High School Data Table 2009, September 14, 2009
- ↑ Pennsylvania Department of Education, 11th Grade Reading PSSA 2008 Central Susquehanna Valley IU16 Region ranking, August 2008
- ↑ Pennsylvania Department of Education. "Millville Area School District Report Card 2006-07" (PDF).
- ↑ Pennsylvania Department of Education (September 21, 2012). "Millville Area Junior Senior High School Academic Achievement Report Card 2012" (PDF).
- ↑ Pennsylvania Department of Education (September 29, 2011). "2010-2011 PSSA results in Science".
- ↑ Pennsylvania Department of Education (September 15, 2010). "2009-10 School Level Science PSSA Results".
- ↑ The Times-Tribune. (2009). "Grading Our Schools database, 2009 Science PSSA results,".
- ↑ "Central Pennsylvania Public High School Science Ranking 2009".
- ↑ The Pennsylvania Basic Education/Higher Education Science and Technology Partnership, Science in Motion annual report, 2012
- ↑ http://www.scribd.com/doc/23970364/Pennsylvania-College-Remediation-Report Pennsylvania College Remediation Report
- ↑ National Center for Education Statistics
- ↑ 2010-2011 Pennsylvania Department of Education - Dual Enrollment Guidelines.
- ↑ Pennsylvania Transfer and Articulation Agreement. Site accessed March 2010.
- ↑ Bloomsburg University Administration (2011). "Summer College and Advanced College Experience (ACE) program".
- ↑ Pennsylvania Department of Education (2010). "Dual Enrollment Guidelines,".
- ↑ Pennsylvania College of Technology administration (2014). "Penn College NOW Dual Enrollment".
- ↑ Millville Area School District Administration, Advanced Placement Courses information for Parents and Students, 2013
- ↑ PDE, School Performance Profile - Academic Performance Data - Millville Area High School, December 2013
- ↑ Pennsylvania Department of Education (2015). "SAT and AP Scores 2015".
- ↑ College Board, SAT 2015 Total Group report Pennsylvania, 2016
- ↑ PDE, School Performance profile, November 6, 2014
- ↑ College Board (2014). "2014 College-Bound Seniors State Profile Report" (PDF).
- ↑ College Board (2013). "The 2013 SAT Report on College & Career Readiness".
- ↑ Pennsylvania Department of Education (2011). "Public School SAT Scores 2011".
- ↑ College Board (September 2011). "SAT Scores State By State - Pennsylvania".
- ↑ "While U.S. SAT scores dip across the board, N.J. test-takers hold steady". September 2011.
- ↑ The Center for Rural Pennsylvania (August 2006). "SAT Scores and Other School Data".
- ↑ Millville Area School District Administration (2010). "Millville Area School District Student Handbook 2010-11" (PDF).
- ↑ Pennsylvania State Board of Education. "Pennsylvania Code §4.24 (a) High school graduation requirements".
- ↑ Millville Area School District Administration. "Millville Area School District Strategic Plan - Chapter 4 Educational Strategic Plan" (PDF).
- ↑ Pennsylvania State Board of Education, Proposed changes to Chapter 4, May 10, 2012
- ↑ Jan Murphy (February 3, 2016). "Wolf signs bill to suspend use of Keystone Exams as a graduation requirement". Pennlive.com.
- ↑ Pennsylvania Department of Education (2010). "Keystone Exam Overview" (PDF).
- ↑ Pennsylvania Department of Education (September 2011). "Pennsylvania Keystone Exams Overview".
- ↑ Pennsylvania State Board of Education (2010). "Rules and Regulation Title 22 PA School Code CH. 4".
- ↑ Pennsylvania Department of Education, State Board of Education Finalizes Adoption of Pennsylvania Common Core State Academic Standards and High School Graduation Requirements, March 14, 2013
- ↑ Pennsylvania Department of Education (2011). "Keystone Exams".
- ↑ Pennsylvania Department of Education (October 1, 2015). "2015 PSSA School Level Data".
- ↑ Pennsylvania Department of Education (October 1, 2015). "2015 PSSA State Level Data".
- ↑ Pennsylvania Department of Education (May 11, 2014). "IU16-PSSA 95-96 Results by School".
- ↑ Pennsylvania Department of Education (2014). "Standards Aligned Systems".
- ↑ Pennsylvania Department of Education (2014). "State Academic Standards".
- ↑ Pennsylvania Department of Education (2014). "State Academic Standards Mathematics".
- ↑ Pennsylvania Department of Education (March 2011). "Millville Junior High School Academic Achievement Report Card 2011" (PDF).
- ↑ Pennsylvania Department of Education, Millville Junior High School Academic Achievement Report Card 2010, March 2011
- ↑ Pennsylvania Department of Education, Millville Junior High School Academic Achievement Report Card 2009, February 2009
- ↑ Pennsylvania Department of Education (February 2011). "PSSA Results Math and Reading School 2008".
- ↑ Pennsylvania Department of Education (February 2011). "PSSA Science results 2008-09".
- ↑ Pennsylvania Department of Education (February 2011). "Science Results by School and Grade 2008".
- ↑ Pennsylvania Department of Education (November 6, 2014). "Millville Area Elementary School Fast Facts 2014".
- ↑ Pennsylvania Department of Education, School Performance Profile, Millville Area Elementary School Fast Facts, 2014
- ↑ National Center for Education Statistics, Common Core Data – Millville Area Elementary School, 2013
- ↑ Pennsylvania Department of Education, Professional Qualifications of Teachers Millville Area Elementary School, September 21, 2012
- ↑ Pennsylvania Partnership for Children, Full-Day Kindergarten Enrollment, 2010
- ↑ Pennsylvania Department of Education, 2016 PSSA AND KEYSTONE Results, September 29, 2016
- ↑ Jan Murphy (September 29, 2016). "Standardized test scores show Pa. schools have more work to do". Pennlive.com.
- ↑ Pennsylvania Department of Education (October 1, 2015). "2015 PSSA School Level Data".
- ↑ Pennsylvania Department of Education (October 1, 2015). "2015 PSSA State Level Data".
- ↑ Pennsylvania Department of Education (November 6, 2014). "Millville Area Elementary School Academic Performance Data 2014".
- ↑ Pennsylvania Department of Education (October 4, 2013). "Millville Area Elementary School Academic Performance Data 2013,".
- ↑ Pennsylvania Department of Education (September 29, 2011). "MILLVILLE AREA Elementary School AYP Overview".
- ↑ Pennsylvania Department of Education (September 29, 2011). "MILLVILLE Area Elementary School AYP DataTable".
- ↑ Pennsylvania State Board of Education (2003). "PSSA results 2003".
- ↑ New America Foundation (2003). "No Child Left Behind Overview".
- ↑ The Goals of No Child Left Behind (Jul 20, 2010). "The Goals of No Child Left Behind".
- ↑ Learning Point Associates (220). "Understanding the No Child Left Behind Act" (PDF).
- ↑ Pennsylvania State Board of Education (January 11, 2003). "Pennsylvania Academic Standards Science and Technology, Ecology and Environment".
- ↑ Pennsylvania Department of Education (September 21, 2012). "MILLVILLE AREA Elementary School Academic Achievement Report Card 2012" (PDF).
- ↑ Pennsylvania Department of Education, MILLVILLE AREA Elementary School Academic Achievement Report Card 2011, September 29, 2011
- ↑ Pennsylvania Department of Education, MILLVILLE AREA Elementary School Academic Achievement Report Card 2010, October 20, 2010
- ↑ Pennsylvania Department of Education, MILLVILLE AREA Elementary School Academic Achievement Report Card 2009, September 14, 2009
- ↑ Millville Area School Board Policy Manual
- ↑ Probart C, McDonnell E, Weirich JE, Schilling L, Fekete V (September 2008). "Statewide assessment of local wellness policies in Pennsylvania public school districts.". J Am Diet Assoc. 108 (9): 1497–502. doi:10.1016/j.jada.2008.06.429. PMID 18755322.
- ↑ Nutrition Standards for Competitive Foods in Pennsylvania Schools for the School Nutrition Incentive, Pennsylvania Department of Education — Division of Food and Nutrition. July 2008
- ↑ USDA, Child Nutrition Programs - Eligibility Manual for School Meals, 2012
- ↑ Pennsylvania Hunger Action Center, The Pennsylvania School Breakfast Report Card, 2009
- ↑ USDA, Child Nutrition Programs, June 27, 2013
- ↑ Denver Nicks (February 25, 2014). "White House Sets New Limits on Junk Food Ads in Schools". Time Magazine.
- ↑ USDA Food and Nutrition Service (2014). "School Meals FAQ".
- ↑ Monica Eng (November 26, 2012). "Lactose intolerance: When drinking school milk makes students feel sick". Chicago Tribune.
- ↑ Pennsylvania State Department of Health (2010). "Pennsylvania Bulletin Doc. No. 10-984 School Immunizations; Communicable and Noncommunicable Diseases".
- ↑ Pennsylvania Department of Health (2014). "School Immunization Requirements".
- ↑ Pennsylvania Department of Health (2014). "MANDATED SCHOOL HEALTH SCREENINGS".
- ↑ Highmark Foundation, 2011 School Challenge Grants, 2011
- ↑ Pennsylvania Bureau of Special Education Services (2015). "Millville Area School District Special Education Data Report LEA Performance on State Performance Plan (SPP) Targets".
- ↑ Bureau of Special Education (2012). "Millville Area School District Special Education Report 2012-13" (PDF).
- ↑ Bureau of Special Education (January 2009). "Millville Area SD Special Education Data Report LEA Performance on State Performance Plan (SPP) Targets School Year 2008-2009" (PDF).
- ↑ Gerald L. Zahorchak, D. Ed. (May 30, 2007). "House Education Committee Hearing on Governor's Proposed Increase for Accountability Block Grants Testimony for Gerald L. Zahorchak, D. Ed. Secretary, Pennsylvania Department of Education" (PDF).
- ↑ PDE, ABG Grant report 2010, July 2010.
- ↑ Millville Area School Administration. "Millville Area School District Special Education Information".
- ↑ Pennsylvania Department of Education. "Pennsylvania Special Education Funding".
- ↑ Senator Patrick Browne (November 1, 2011). "Senate Education Committee Holds Hearing on Special Education Funding & Accountability".
- ↑ Pennsylvania Department of Education Amy Morton, Executive Deputy Secretary (November 11, 2011). "Public Hearing: Special Education Funding & Accountability Testimony".
- ↑ Baruch Kintisch Education Law Center (November 11, 2011). "Public Hearing: Special Education Funding & Accountability Testimony" (PDF).
- ↑ Pennsylvania Bureau of Special Education (May 27, 2011). "Millville Area School District Special education report 2010" (PDF).
- ↑ Amy Morton, Executive Deputy Secretary, Public Hearing: Special Education Funding & Accountability Testimony, Pennsylvania Department of Education, November 11, 2011
- ↑ US Department of Education, U.S. Department of Education Clarifies Schools' Obligation to Provide Equal Opportunity to Students with Disabilities to Participate in Extracurricular Athletics, January 25, 2013
- ↑ Pennsylvania Department of Education (July 2010). "Special Education Funding from Pennsylvania State_2010-2011".
- ↑ Pennsylvania Department of Education (2011). "Special Education Funding 2011-2012 Fiscal Year".
- ↑ PDE, Investing in Pennsylvania Students 2014, 2014
- ↑ Pennsylvania Department of Education, BEF, Special Education Funding, RTL Grants 2016-17, July 2016
- ↑ Special Education Funding Reform Commission (December 11, 2015). "Special Education Funding Reform Commission Report" (PDF).
- ↑ Pennsylvania Department of Education (July 2010). "Gifted Students as Percentage of Total Enrollment by School District/Charter School" (PDF).
- ↑ Pennsylvania Department of Education and Pennsylvania School Board (February 4, 2011). "CHAPTER 16. Special Education For Gifted Students".
- ↑ Pennsylvania Department of Education (2010). "Gifted Guidelines".
- ↑ Center for Safe Schools (2013). "Millville Area SD School Safety Report 2013" (PDF).
- ↑ Pennsylvania Center for Safe Schools (2011). "Millville Area School District Safety Reports 2011" (PDF).
- ↑ Pennsylvania Center for Safe Schools (2012). "Pennsylvania Safe Schools Online Reports".
- ↑ Bullying/Cyberbullying Policy 248, Millville Area School Board, April 27, 2009
- ↑ Pennsylvania General Assembly (2008). "Regular Session 2007-2008 House Bill 1067, Act 61 Section 6 page 8".
- ↑ Center for Safe Schools of Pennsylvania,. "Bullying Prevention advisory".
- ↑ Pennsylvania State Board of Education (January 11, 2003). "Pennsylvania Academic Standards".
- ↑ Pennsylvania Department of Education (2013). "State Academic Standards".
- ↑ Pennsylvania General Assembly, Taxpayer Relief Act, Act 1 of the Special Session of 2006, June 27, 2006
- ↑ Millville Area School Board (February 2016). "Millville Area School Board and Millville Area Teachers Union Contract Agreement" (PDF).
- ↑ PENNSYLVANIA LABOR RELATIONS BOARD (August 2015). "Millville Area School District versus Millville area Teacher Association Report" (PDF).
- ↑ Pennsylvania Labor Relations Board (August 2015). "Fact Finder Report Press release".
- ↑ JACKIE DE TORE (August 20, 2014). "Millville Area Teachers go on Strike". WNEP TV 16.com.
- ↑ WNEP TV, Millville Area Teachers Set to Strike, April 6, 2015
- ↑ Allegheny Institute for Public Policy (May 2012). "Teacher Strikes".
- ↑ Elizabeth Weaver (December 2008). "Pennsylvania: Still the Leader in Teacher Strikes" (PDF). Allegheny Institute for Public Policy.
- ↑ Mary Niederberger., Laws, tax limits hinder negotiations, Pittsburgh Post-Gazette, September 5, 2013
- ↑ Sarah Leitner (February 4, 2014). "How One Pennsylvania School Board Used Public Opinion in Contract Negotiations". Media Trackers.com.
- ↑ Diana Rocco (June 5, 2012). "Neshaminy Teachers On Strike Again, Parents And Students Frustrated". CBS Philly News.
- ↑ Associated Press (September 3, 2013). "Teachers in 3 Pennsylvania school districts on strike". Pennlive.com.
- ↑ Media Tracker (April 24, 2014). "Pennsylvania Teachers Go On Strike in Danville".
- ↑ Phyllis Scherrer (September 8, 2014). "Teachers strike in three Pennsylvania school districts". International Committee of the Fourth International.
- ↑ Megan Harris (Aug 4, 2013). "Strike-free school year in Western Pa. called an anomaly, not a trend". Pittsburgh TribLive.com.
- ↑ Pennsylvania Department of Education (2014). "Investing in Pennsylvania Students 2014".
- ↑ Pennsylvania School Employees Retirement System (2014). "Your PSERS Benefits & Leaving Employment".
- ↑ American Enterprise Institute (2011). "Assessing the Compensation of Public School Teachers".
- ↑ Pennsylvania Department of Education (2012). "Investing in Pennsylvania Students".
- ↑ Asbury Park Press (2009). "Pa. Public School Salaries, 2009".
- ↑ openpagov.org (May 2011). "Millville Area School District data".
- ↑ Millville Area School District School Board and administration (May 3, 2011). "Millville Area School District teacher union contract".
- ↑ Fenton, Jacob., Average classroom teacher salary in Allegheny County, 2006-07., The Morning Call, March 2009
- ↑ Fenton, Jacob., Pennsylvania School District Data: Will School Consolidation Save Money?, The Morning Call, February 2009
- ↑ "The Benefits of Learning,". The Altoona Mirror. August 2007.
- ↑ Pa. Public School Salaries, 2009, Asbury Park Press, accessed May 17, 2010.
- ↑ "Per Pupil Spending in Pennsylvania Public Schools in 2008 Sort by Administrative Spending".
- ↑ Pennsylvania Department of Education (2010). "2009-10 Selected Data - 2009-10 Total Expenditures per ADM".
- ↑ US Census Bureau (March 2003). "Public Education Finances 2000-01 Annual Survey of Local Government Finances" (PDF).
- ↑ United States Census Bureau (2009). "States Ranked According to Per Pupil Elementary-Secondary Public School System Finance Amounts: 2008-09" (PDF).
- ↑ US Census Bureau (May 2013). "States Ranked According to Per Pupil Public Elementary-Secondary School System Finance Amounts: Fiscal Year 2011" (PDF).
- ↑ Pennsylvania Department of Education (2008). "General Reserved Fund Balance by School District 1996-2008".
- ↑ Pennsylvania Department of Education, Investing in Pennsylvania Students, 2013
- ↑ Jan Murphy (June 15, 2016). "Search the database: How much is in your school district's fund balance?".
- ↑ Murphy, Jan., Pennsylvania's public schools boost reserves, CentreDaily Times, September 22, 2010
- ↑ Melissa Daniels (June 1, 2013). "PA school districts look to cash stash to balance budgets". PA Independent.
- ↑ Commonwealth Foundation (May 17, 2012). "Chart: School District Fund Balances Nearly Tripled in 14 Years".
- ↑ Pennsylvania Attorney General Office Press release (January 5, 2011). "School districts and local governments to receive more than $8.4 million in first phase of Bank of America bid-rigging settlement".
- ↑ Pennsylvania Auditor General Office (April 2009). "MILLVILLE AREA SCHOOL DISTRICT Columbia County, PENNSYLVANIA PERFORMANCE AUDIT REPORT".
- ↑ Office of the Auditor General of Pennsylvania (November 9, 2011). "Millville Area School District, Columbia County, Performance Audit" (PDF).
- ↑ Millville Area School District Administration (December 2011). "Millville Active School/Active Community Walking Trails Project bid notice" (PDF).
- ↑ EPA (January 4, 2011). "NPDES Permit Program Basics".
- ↑ Pennsylvania Department of Education (May 2012). "Pennsylvania Public School District Tuition Rates".
- ↑ Millville Area School Board Secretary, Millville Area School Board Meeting Minutes, June 10, 2013
- ↑ Pennsylvania of Community & Economic Development (2012). "Earned Income Tax".
- ↑ Penn State Cooperative Extension (2010). "What are the Local Taxes in Pennsylvania?, Local Tax Reform Education Project" (PDF).
- ↑ Pennsylvania Department of Revenue (April 2010). "Personal Income Taxation Guidelines".
- ↑ John Finnerty (2013). "PA teachers pensions". CNHI Harrisburg Bureau.
- ↑ Herald-Mail Media (February 24, 2016). "Kauffman law exempts military pay from Pa. earned-income taxes".
- ↑ Myle Snyder (February 23, 2016). "Gov. Wolf signs bill to exempt active duty military pay from local tax". ABC27 News.
- ↑ Pennsylvania Representative Todd Stephens (January 23, 2014). "LEEF Funding Chart 2014".
- ↑ JANICE BISSETT & ARNOLD HILLMAN (2006). "A Summary of the History and Financing of Education in Pennsylvania 1682- 2013" (PDF). PA Association of Rural and Small Schools.
- ↑ Nathan Benefield and James Paul Senior Policy Analyst (December 3, 2014). "School Funding Reform & Weighted Student Funding" (PDF).
- ↑ Pennsylvania General Assembly - Education Reform Commission (December 2014). "Basic Education Funding Commission Public Hearing Funding Issues related to Enrollment and Growth".
- ↑ Basic Education Funding Commission, Commission minutes, 2016
- ↑ York Dispatch, Governor Wolf Signs Fair Funding Formula, June 2016
- ↑ Pennsylvania General Assembly (June 2016). "House Bill 1552, Act 35 of 2016".
- ↑ Pennsylvania Department of Eductaion, Education Budget 2016-17, July 2016
- ↑ PDE, Special Education Funding fiscal year 2016-17, July 2017
- ↑ PA Office of Budget, Commonwealth 2016-17 Enacted Budget Line-Item Appropriations, July 2016
- ↑ Jan Murphy (April 15, 2016). "House, Senate cast veto-proof majority votes on school funding bill". Pennlive.com.
- ↑ PDE, Ed Budget 2015-16 , May 2016
- ↑ Jan Murphey (January 4, 2016). "Here's the payout your school district gets from the partial 2015-16 state budget". Pennlive.com.
- ↑ Jennifer Wakeman (January 4, 2016). "Harrisburg releases $3.3 billion in delayed funds".
- ↑ Pennsylvania General Assembly (June 26, 2015). "Basic Education Funding Commission".
- ↑ Pennsylvania Department of Education, EdBudget 2015-16 BEF, April 6, 2016
- ↑ Jan Murphy (April 6, 2016). "Governor's 2015-16 Basic Eductaion Funding & Ready to Learn Block Grant Distributions Compared to HB1801 Districtbutions". Pennlive.com.
- ↑ Jan Murphy (April 6, 2016). "Here's what the difference between school funding formulas means to your district".
- ↑ PDE (July 7, 2014). "Enacted Education Budget 2014-2015".
- ↑ Pennsylvania Department of Education, 2014-15 Enacted Education Budget Fast Facts, July 14, 2014
- ↑ Democrat Appropriations Committee, Report on Education funding by LEA, July 2, 2013
- ↑ Pennsylvania Office of the Budget, 2013-14 State Budget Highlights, 2013
- ↑ Senator Jake Corman (June 28, 2012). "Pennsylvania Education funding by Local School District" (PDF).
- ↑ Pennsylvania General Assembly Sen Jake Corman (June 29, 2012). "SB1466 of 2012 General Fund Appropriation".
- ↑ PA Senate Appropriations Committee (June 28, 2011). "School District 2011-12 Funding Report".
- ↑ Pennsylvania Department of Education (July 2011). "Basic Education Funding".
- ↑ Pennsylvania Department of Education (June 30, 2011). "Basic Education Funding".
- ↑ Pennsylvania Department of Education (June 30, 2011). "Basic Education Funding 2011-2012 Fiscal Year".
- ↑ Pennsylvania Department of Education, District Allocations Report 2009, 2009-10
- ↑ Pennsylvania House Appropriations Committee Education (September 2010). "2010-2011 Basic Education Subsidy".
- ↑ Office of the Budget (February 2010). "Pennsylvania Budget Proposal 2010,".
- ↑ Office of the Budget (February 2010). "Pennsylvania Budget Proposal 2010,".
- ↑ Pennsylvania Department of Education - Basic Education Funding by School District, October 2009
- ↑ Office of Budget, (February 2009). "The Pennsylvania Department of Education Budget Proposal 2009.".
- ↑ U.S. Census Bureau., Annual Survey of Local Government Finances., 2000
- ↑ U.S. Census Bureau., 2008 Survey of Local Government Finances – School Systems, 2010
- ↑ Pennsylvania Department of Education (October 2009). "Basic Education Funding per School District.".
- ↑ Pennsylvania Department of Education. "Accountability Block Grant report 2010, Grantee list 2010".
- ↑ "Accountability Block Grant Mid Year report".
- ↑ Pennsylvania Department of Education. "Accountability Block Grant Mid Year Report 2009-10" (PDF).
- ↑ Pennsylvania Department of Education (2013). "Passport for Learning Block Grant".
- ↑ Scott, Rob, "New Software enhances Core Subjects," The Daily Item, September 7, 2007.
- ↑ Pennsylvania Auditor General Office (December 22, 2008). "Classroom for the Future grants audit" (PDF).
- ↑ CAIU 15 (2007). "Project 720".
- ↑ Pennsylvania Department of Education (2007). "Transforming Pennsylvania High Schools".
- ↑ Robert Hayes Postupac, PROJECT 720: A CASE STUDY OF HIGH SCHOOL REFORM, University of Pittsburgh, 2011
- ↑ PA Office of the Budget, 2011-12 Budget General Fund - State Appropriations, June 28, 2011
- ↑ Pennsylvania Department of Education (February 21, 2014). "Acting Secretary of Education Announces $2.6 Million in Safe Schools Targeted Grants".
- ↑ Commonwealth of Pennsylvania. "Millville Area School District Federal Stimulus Award".
- ↑ "School stimulus money". Pittsburgh Post-Gazette. March 12, 2009.
- ↑ Governor's Press Office release (January 20, 2010). "Pennsylvania's 'Race to the Top' Fueled by Effective Reforms, Strong Local Support".
- ↑ Gerald Zahorchak (December 2008). "Pennsylvania Race to the Top Letter to Superintendents" (PDF).
- ↑ Governor's Press Office release (January 20, 2010). "Pennsylvania's 'Race to the Top' Fueled by Effective Reforms, Strong Local Support,".
- ↑ U.S. Department of Education (March 29, 2010). "Race to the Top Fund,".
- ↑ PDE (2015). "TITLE II, PART A - TEACHER AND PRINCIAL TRAINING & RECRUITING".
- ↑ PDE (2015). "Federal Programs".
- ↑ PDE, Title IIA egrants 2012-13, 2012
- ↑ PDE, Title IIA egrants 2014-15, 2014
- ↑ US Department of Education (September 15, 2004). "Title III — Language Instruction for Limited English Proficient and Immigrant Students".
- ↑ PDE, English As A Second Language (ESL), 2015
- ↑ PDE (2015). "Title III Supplemental Program".
- ↑ Pennsylvania Department of Education (February 1, 2011). "Common Cents program - Making Every Dollar Count".
- ↑ Pennsylvania Department of Education (2016). "Financial Elements Reports".
- ↑ Pennsylvania Department of Education (2011). "Real Estate Tax Rates by School District 2011-12 Real Estate Mills".
- ↑ Katie Colaneri (June 11, 2015). "New pipeline could mean tax bonanza for NJ towns, but for Pa.? Not so much". State Impact NPR.org.
- ↑ Penn State Extension (2012). "Marcellus Shale Gas Development: What Does It Mean for Pennsylvania Schools?".
- ↑ The Nature Conservancy – Pennsylvania Chapter, Natural Gas Pipelines Pennsylvania Energy Impacts Assessment, December 16, 2011
- ↑ The Nature Conservancy, Marcellus Shale Gas Development in Bradford County, December 16, 2011
- ↑ TIMOTHY PUKO (December 11, 2011). "Shale gas pipelines pose challenges to state's forests, wildlife". TribLive.com.
- ↑ Columbia County GIS department (2016). "Geographic Information Systems Atlantic Sunrise Gas Pipeline Map".
- ↑ Pennsylvania Department of Education (2004). "Act 511 Tax Report".
- ↑ State Tax Equalization Board (2011). "State Tax Equalization Board About US".
- ↑ Pennsylvania Auditor General office - Bureau of Audits (February 2011). "A Special Performance Audit of the Pennsylvania State Tax Equalization Boards" (PDF).
- ↑ Pennsylvania Department of Education (2015). "Financial Elements Reports 2015-16".
- ↑ Pennsylvania Department of Education (2014). "Financial Elements Reports 2014-15".
- ↑ Pennsylvania Department of Education, Financial Elements Reports 2013-14, 2013
- ↑ Pennsylvania Department of Education, Real Estate Tax Millage by School District, 2012
- ↑ Pennsylvania Department of Education, Real Estate Tax Millage by School District, 2011
- ↑ Pennsylvania Department of Education, Real Estate Tax Millage by School District, 2010
- ↑ Pennsylvania Department of Education (2010). "Financial Elements Reports".
- ↑ Pennsylvania Department of Education (2009). "Financial Elements Reports 2008-09 Real Estate Mills".
- ↑ Pennsylvania Department of Education, Real Estate Tax Millage by School District, 2008
- ↑ Tax-rates.org., The 2013 Tax Resource County Property Taxes 2012, 2012
- ↑ Pennsylvania Department of Education, Pennsylvania School Finances - Summaries of Annual Financial Report Data 2010-11, 2011
- ↑ New Census Data on Property Taxes on Homeowners, Tax Foundation, September 22, 2009.
- ↑ Pennsylvania Department of Education 2010-11 Act 1 of 2006 Referendum Exception Guidelines.
- ↑ Kaitlynn Riely (August 4, 2011). "Law could restrict school construction projects". Pittsburgh Post-Gazette.
- ↑ Pennsylvania General Assembly (June 2011). "SB330 of 2011".
- ↑ Eric Boehm (July 1, 2011). "Property tax reform final piece of state budget". PA Independent.
- ↑ Pennsylvania Department of Education (2011). "Special Session Act 1 of 2006 the Taxpayer Relief Act information".
- ↑ Pennsylvania Department of Education (May 2010). "Special Session Act 1 of 2006 School District Adjusted Index for 2006-2007 through 2010-2011,".
- ↑ Pennsylvania Department of Education, 2008-2009 School District Adjusted Index, September 2007
- ↑ Pennsylvania Department of Education, 2009-2010 School District Adjusted Index, September 2008
- ↑ Pennsylvania Department of Education, 2010-2011 School District Adjusted Index, September 2009
- ↑ Pennsylvania Department of Education, 2011-2012 School District Adjusted Index, September 2010
- ↑ Pennsylvania Department of Education (October 2016). "2006-2017 School District Adjusted Index Listing".
- ↑ Pennsylvania Department of Education, 2013-2014 School District Adjusted Index, September 2012
- ↑ Pennsylvania Department of Education, 2014-2015 School District Adjusted Index, September 2013
- ↑ Pennsylvania Department of Education, 2015-2016 School District Adjusted Index, September 2014
- ↑ Pennsylvania Department of Education (September 5, 2015). "2016-2017 School District Adjusted Index,".
- ↑ Pennsylvania Department of Education (2015). "Property Tax Relief".
- ↑ Pennsylvania Department of Education (April 2016). "Report on Referendum Exceptions For School Year 2016-2017" (PDF).
- ↑ Pennsylvania Department of Education (April 2015). "Taxpayer Relief Act Special Session Act 1 of 2006 Report on Referendum Exceptions For School Year 2015-2016" (PDF).
- ↑ Pennsylvania Department of Education (April 30, 2014). "Report on Referendum Exceptions For School Year 2014-2015".
- ↑ Pennsylvania Department of Education, Report on Referendum Exceptions For School Year 2013-2014, April 2013
- ↑ Pennsylvania Department of Education, Report on Referendum Exceptions For School Year 2012-2013, March 30, 2012
- ↑ Pennsylvania Department of Education, Referendum Exceptions for School Year 2011-2012 Sought From and Approved, May 2011
- ↑ Pennsylvania Department of Education (2011). "Special Session Act 1 of 2006 the Taxpayer Relief Act information".
- ↑ Pennsylvania Department of Education (April 2011). "Report on Exceptions".
- ↑ Pennsylvania Department of Education (April 2010). "Pennsylvania SSAct1_Act1 Exceptions Report 2010-2011 April 2010".
- ↑ Pennsylvania Department of Education (April 2010). "Pennsylvania SSAct1_Act1 Exceptions Report 2009-2010 May 2009".
- ↑ Scarcella, Frank & Pursell, Tricia (May 25, 2010). "Local school tax assessments exceed state averages". The Daily Item.
- ↑ Pennsylvania Department of Education (May 1, 2013). "2013-2014 Estimated State Property Tax Relief per Homestead".
- ↑ Pennsylvania Department of Education (May 1, 2010). "Tax Relief per Homestead May 1, 2010,".
- ↑ Pennsylvania Department of Education (2009). "Estimated Tax Relief Per Homestead and Farmstead May 1, 2009" (PDF).
- ↑ Special Report Pennsylvania Property Tax Relief, Office of the Auditor General, Feb. 23, 2010.
- ↑ Tax Relief per Homestead May 1, 2010. Report Pennsylvania Department of Education, May 2010
- ↑ Penn State College of Agricultural Sciences Cooperative Extension (1998). "Understanding the Homestead and Farmstead Exclusions" (PDF).
- ↑ Policy Extracurriculars 122 and Policy Interscholastic Athletics 123. School District Policy Manual. 2010.
- ↑ Millville Area School Board, Millville Area School District Budget Report 2014-15, June 2014
- ↑ Pennsylvania Office of the Governor Press Release (November 10, 2005). "Home-Schooled, Charter School Children Can Participate in School District Extracurricular Activities".
- ↑ Millville Area School Board, Millville Area School District Teacher Union Contract, 2012
- ↑ PA General Assembly (July 1, 2012). "Senate Bill 200 of Session 2011 Safety in Youth Sports Act".
- ↑ Millville Area School District Administration (2014). "Millville Area School District Athletics" (PDF).
- ↑ Pennsylvania Department of Education (2013). "Interscholastic Athletic Opportunities Disclosure Form" (PDF).
- ↑ Pennsylvania Interscholastic Athletics Association (2012). "PIAA School Directory".
- ↑ Pennsylvania Department of Education Enrollment and Projections for Millville Area School District, January 2009
- ↑ Pennsylvania Department of Education (November 2010). "Millville Area School District Enrollment Data and Projections".
- ↑ Pennsylvania Legislative Budget & Finance Committee (2007). "Cost Effectiveness of Consolidating PA's School Districts-Vol. II" (PDF).
- ↑ The Center for Rural Pennsylvania. (October 2009). "Research Analyzes Rural School District Enrollment and Building Capacity" (PDF).
- ↑ "Report of the Fiscal Responsibility Task Force" (PDF). April 2011.
- ↑ Rendell, E. & Soderberg, M. (2009). Pennsylvania school district consolidation. 2009-10 Executive Budget Fast Facts. Pennsylvania Office of the Governor.
- ↑ Standard & Poor's School Evaluation Services. (2007). "Study of the cost-effectiveness of consolidating Pennsylvania districts." (PDF).
- ↑ Pennsylvania Department of Health, Health Statistics - Resident Live Birth rate by county, 1990
- ↑ Pennsylvania Department of Health, Health Statistics - Resident Live Birth rate by county, 2000
- ↑ Pennsylvania Department of Health, Health Statistics - Resident Live Birth rate by county, 2013
- ↑ Center for Rural Pennsylvania, Number of Children Decreasing, Number of Seniors Increasing in Rural Pennsylvania, July 2011
- ↑ Pennsylvania Department of Health, Birth Statistics, 2013
- ↑ Commonwealth of Pennsylvania Department of Health, Resident Live Births by Age of Mother Counties and Pennsylvania, 2011
Columbia County, Pennsylvania Schools | |||||||||||||||||||||||||||||||
|---|---|---|---|---|---|---|---|---|---|---|---|---|---|---|---|---|---|---|---|---|---|---|---|---|---|---|---|---|---|---|---|
| |||||||||||||||||||||||||||||||
| |||||||||||||||||||||||||||||||