Economic surplus
In mainstream economics, economic surplus, also known as total welfare or Marshallian surplus (named after Alfred Marshall), refers to two related quantities. Consumer surplus or consumers' surplus is the monetary gain obtained by consumers because they are able to purchase a product for a price that is less than the highest price that they would be willing to pay. Producer surplus or producers' surplus is the amount that producers benefit by selling at a market price that is higher than the least that they would be willing to sell for; this is roughly equal to profit (since producers are not normally willing to sell at a loss, and are normally indifferent to selling at a breakeven price).
In Marxian economics, the term surplus may also refer to surplus value, surplus product and surplus labour.
Overview
An engineer named Jules Dupuit came up with the concept of economic surplus, but it was the economist Alfred Marshall who gave the concept its fame in the steam of economics.
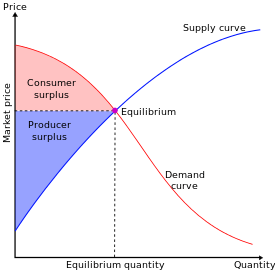
On a standard supply and demand diagram, consumer surplus is the area (triangular if the supply and demand curves are linear) above the equilibrium price of the good and below the demand curve. This reflects the fact that consumers would have been willing to buy a single unit of the good at a price higher than the equilibrium price, a second unit at a price below that but still above the equilibrium price, etc., yet they in fact pay just the equilibrium price for each unit they buy.
Likewise, in the supply-demand diagram, producer surplus is the area below the equilibrium price but above the supply curve. This reflects the fact that producers would have been willing to supply the first unit at a price lower than the equilibrium price, the second unit at a price above that but still below the equilibrium price, etc., yet they in fact receive the equilibrium price for all the units they sell.
Consumer surplus
Consumer surplus is the difference between the maximum price a consumer is willing to pay and the actual price they do pay. If a consumer would be willing to pay more than the current asking price, then they are getting more benefit from the purchased product than they initially paid. An example of a good with generally high consumer surplus is drinking water. People would pay very high prices for drinking water, as they need it to survive. The difference in the price that they would pay, if they had to, and the amount that they pay now is their consumer surplus. Note that the utility of the first few liters of drinking water is very high (as it prevents death), so the first few litres would likely have more consumer surplus than subsequent liters.
The maximum amount a consumer would be willing to pay for a given quantity of a good is the sum of the maximum price they would pay for the first unit, the (lower) maximum price they would be willing to pay for the second unit, etc. Typically these prices are decreasing; they are given by the individual demand curve. For a given price the consumer buys the amount for which the consumer surplus is highest, where consumer surplus is the sum, over all units, of the excess of the maximum willingness to pay over the equilibrium (market) price. The consumer's surplus is highest at the largest number of units for which, even for the last unit, the maximum willingness to pay is not below the market price.
The aggregate consumers' surplus is the sum of the consumer's surplus for all individual consumers. This can be represented graphically as shown in the above graph of the market demand and supply curves.
Calculation
Calculation from supply and demand
The consumer surplus (individual or aggregated) is the area under the (individual or aggregated) demand curve and above a horizontal line at the actual price (in the aggregated case: the equilibrium price). If the demand curve is a straight line, the consumer surplus is the area of a triangle:

where Pmkt is the equilibrium price (where supply equals demand), Qmkt is the total quantity purchased at the equilibrium price and Pmax is the price at which the quantity purchased would fall to 0 (that is, where the demand curve intercepts the price axis). For more general demand and supply functions, these areas are not triangles but can still be found using integral calculus. Consumer surplus is thus the definite integral of the demand function with respect to price, from the market price to the maximum reservation price (i.e. the price-intercept of the demand function):

where This shows that if we see a rise in the equilibrium price and a fall in the equilibrium quantity, then consumer surplus falls.

Distribution of benefits when price falls
When supply of a good expands, the price falls (assuming the demand curve is downward sloping) and consumer surplus increases. This benefits two groups of people: consumers who were already willing to buy at the initial price benefit from a price reduction, and they may buy more and receive even more consumer surplus; and additional consumers who were unwilling to buy at the initial price will buy at the new price and also receive some consumer surplus.
Consider an example of linear supply and demand curves. For an initial supply curve S0, consumer surplus is the triangle above the line formed by price P0 to the demand line (bounded on the left by the price axis and on the top by the demand line). If supply expands from S0 to S1, the consumers' surplus expands to the triangle above P1 and below the demand line (still bounded by the price axis). The change in consumer's surplus is difference in area between the two triangles, and that is the consumer welfare associated with expansion of supply.
Some people were willing to pay the higher price P0. When the price is reduced, their benefit is the area in the rectangle formed on the top by P0, on the bottom by P1, on the left by the price axis and on the right by line extending vertically upwards from Q0.
The second set of beneficiaries are consumers who buy more, and new consumers, those who will pay the new lower price (P1) but not the higher price (P0). Their additional consumption makes up the difference between Q1 and Q0. Their consumer surplus is the triangle bounded on the left by the line extending vertically upwards from Q0, on the right and top by the demand line, and on the bottom by the line extending horizontally to the right from P1.
Rule of one-half
The rule of one-half estimates the change in consumer surplus for small changes in supply with a constant demand curve. Note that in the special case where the consumer demand curve is linear, consumer surplus is the area of the triangle bounded by the vertical line Q=0, the horizontal line and the linear demand curve. Hence, the change in consumer surplus is the area of the trapezoid with i) height equal to the change in price and ii) mid-segment length equal to the average of the ex-post and ex-ante equilibrium quantities. Following the figure above,


where:
- CS = consumers' surplus;
- Q0 and Q1 are, respectively, the quantity demanded before and after a change in supply;
- P0 and P1 are, respectively, the prices before and after a change in supply.
See also
- Deadweight loss
- Gross operating surplus
- Induced demand
- Price discrimination
- Price support
- Shortage
- Surplus product
- Surplus value
- Utility
- Value added
- Welfare economics
References
1.Modern Microeconomics, second edition,A.Koutsyiannis.
2.Microeconomic Theory, A mathematical Approach,Third Edition, James M.Henderson and Richard E.Quandt.