Maltese general election, 2013
| | ||||||||||||||||||||||||||||||||||||||||||||
| ||||||||||||||||||||||||||||||||||||||||||||
| ||||||||||||||||||||||||||||||||||||||||||||
| ||||||||||||||||||||||||||||||||||||||||||||
The Maltese general election took place on Saturday, 9 March 2013. The Labour Party won a majority of seats thus defeating the Nationalist Party, which had been in power for 15 years.
Background
On 10 December 2012 Lawrence Gonzi's government was defeated in a vote on the 2013 Financial Estimates[1][2] when ruling party MP Franco Debono voted against the government's budget proposal in protest over transportation reform in giving a German operator the contract to manage the national bus service.[2] Faced with loss of supply, Gonzi announced that the House of Representatives would be dissolved on 7 January and a general election called for 9 March.[3]
Electoral system
The system of voting used was, as in previous elections, proportional representation through modified single transferable vote with five MPs to be returned from each of thirteen districts, i.e. 65 constituency seats in total, with a variable number of at-large seats added to ensure that the overall first-preference votes are reflected in the composition of the House of Representatives. There were also some minor changes to the boundaries of electoral districts from the previous general election and improved voting arrangements for hospital patients.[4]
Parties
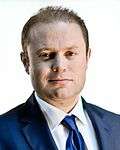
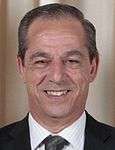
The two leading political parties contesting the election were the Nationalist Party of the incumbent prime minister,[5] Lawrence Gonzi and the Labour Party, led by Joseph Muscat,[6] for whom this was the first general election at the helm of the party. The Third party was Democratic Alternative, a Green Party, which was seeking to elect its first MP.[7] A small number of independent candidates also ran for election.
National Action, which stood candidates in the 2008 general election and 2009 European Parliamentary election, ceased activities in 2010 and did not contest this election.
Opinion polls
| Date(s) Released | Polling institute | Nationalist | Labour | Democratic Alternative | Undecided/ No answer | Lead |
|---|---|---|---|---|---|---|
| 7 January 2012 | The Sunday Times | 25.2% (46.9%)¤ |
29.5% (52.1%)¤ |
1.0% (1.0%)¤ |
44.3% | 4% |
| 8 July 2012 | Misco International | 22% | 32% | 1% | 45% | 10% |
| 14 October 2012 | Misco International | 22% | 34% | 1% | 43% | 12% |
| 13 January 2013 | The Sunday Times | 27% (44%)¤ |
33% (54%)¤ |
1% (1%)¤ |
38% | 6% |
| 3 March 2013 | Malta Today | 28.2% | 40.2% | 2.4% | 29.2% | 12% |
¤ Opinion polls adjusted for the preference of undecided voters.
Results

Following the preliminary result, in which Labour won 39 seats to 26 for the Nationalists, Labour party leader Joseph Muscat said from Naxxar: "I wasn't expecting such a landslide victory for Labour. We must all remain calm, tomorrow is another day." Nationalist party leader Lawrence Gonzi conceded the election in saying "The Nationalist Party needs to begin a reform process and at the same remain rooted in its values."[8] This was the first time the Labour party won a majority in the government since Malta joined the European Union,[9] as well as being the first Labour government since the new millennium (as the previous one should have ended in 2001, but ended prematurely in 1998). Furthermore, the Labour party won absolute majority of the votes in 23 of the 35 localities, increasing its overall share of the votes by 2.2% from the last elections.[10] The Nationalist Party was subsequently awarded four at-large seats, bringing it to 30 in all, to adjust for its share of the first-preference vote.
| Parties | Votes | % | +/– | Seats | +/– | |
|---|---|---|---|---|---|---|
| Labour Party | 167,533 | 54.83 | +6.04 | 39 | +5 | |
| Nationalist Party | 132,426 | 43.34 | –6.00 | 30 | –5 | |
| Democratic Alternative | 5,506 | 1.80 | +0.49 | 0 | 0 | |
| Ajkla Party | 47 | 0.02 | New | 0 | New | |
| Liberal Alliance | 12 | 0.00 | New | 0 | New | |
| Independents | 32 | 0.01 | +0.00 | 0 | 0 | |
| Invalid/blank votes | 4,044 | — | — | — | — | |
| Total | 309,600 | 100.0 | – | 69 | 0 | |
| Registered voters/turnout | 330,072 | 93.8 | – | – | – | |
| Source: Government of Malta, Parliament of Malta | ||||||
References
- ↑ "Budget rejected as Debono votes with Opposition". Times of Malta. Retrieved 10 December 2012.
- 1 2 Malta government falls after PM Gonzi loses majority
- ↑ "Parliament to be dissolved on 7 January, election on March 9". Times of Malta. Retrieved 10 December 2012.
- ↑ "OSCE/ODIHR NEEDS ASSESSMENT MISSION REPORT". OSCE Office for Democratic Institutions and Human Rights. January 2013. Retrieved 16 March 2013.
- ↑ (Maltese) Partit Nazzjonalista
- ↑ Partit Laburista
- ↑ Alternattiva Demokratika
- ↑ Labour returns to power in Malta after 15 years
- ↑ Malta’s May Elect Labour Party for First Time Since Euro Start
- ↑ "Labour Increases Vote by 2%". Malta Today. 16 March 2013. Retrieved 16 March 2013.

