Epidemiology of malnutrition

There were 795 million undernourished people in the world in 2014, a decrease of 216 million since 1990,[2] despite the fact that the world already produces enough food to feed everyone—7 billion people—and could feed more than that—12 billion people.[3]
| Year | 1990 | 1995 | 2005 | 2008 | 2014 |
|---|---|---|---|---|---|
| Undernourished people in the world (millions)[4] | 843 | 788 | 848 | 923 | 795 |
| Year | 1970 | 1980 | 1990 | 2005 | 2007 | 2014 |
|---|---|---|---|---|---|---|
| Percentage of people in the developing world who are undernourished[5][6] | 37 % | 28 % | 20 % | 16 % | 17 % | 13 % |
By country
The number of undernourished people (million) in 2010–2012 and 2014–2016 (projected). According to the FAO, these countries had 5 million or more undernourished people in 2001–2003 and in 2005–2007.[7]
| Country | 2010–2012 | 2014-2016 |
|---|---|---|
| India | 189.9 | 194.6 |
| China | 163.2 | 133.8 |
| Pakistan | 38.3 | 41.4 |
| Ethiopia | 32.1 | 31.6 |
| Indonesia | 26.9 | 19.4 |
| Bangladesh | 26.5 | 26.3 |
| Tanzania | 16.1 | 16.8 |
| Philippines | 12.7 | 13.7 |
| Vietnam | 12.2 | 10.3 |
| North Korea | 10.3 | 10.5 |
| Nigeria | 10.2 | 12.9 |
| Kenya | 10.0 | 9.9 |
| Sudan | N/A (10.2 in 2007-08) | N/A |
| Myanmar | 9.4 | 7.7 |
| Uganda | 8.7 | 10.3 |
| Iraq | 7.8 | 8.1 |
| Mozambique | 7.3 | 6.9 |
| Madagascar | 6.9 | 8.0 |
| Zambia | 6.9 | 7.4 |
| Yemen | 6.1 | 6.7 |
| Thailand | 6.0 | 5.0 |
| Colombia | 5.3 | 4.4 |
| Haiti | 4.9 | 5.7 |
| Zimbabwe | 4.5 | 5.0 |
Note: This table measures "undernourishment", as defined by FAO, and represents the number of people consuming (on average for years 2010 to 2012) less than the minimum amount of food energy (measured in kilocalories per capita per day) necessary for the average person to stay in good health while performing light physical activity. It is a conservative indicator that does not take into account the extra needs of people performing extraneous physical activity, nor seasonal variations in food consumption or other sources of variability such as inter-individual differences in energy requirements. Malnutrition and undernourishment are cumulative or average situations, and not the work of a single day's food intake (or lack thereof). This table does not represent the number of people who "went to bed hungry today."
The below is a list of countries by percentage of population with undernourishment, as defined by the United Nations World Food Programme and the UN Food and Agriculture Organization in its "The State of Food Insecurity in the World" 2009 report.
| Ranking | Country | Percentage of population suffering from undernourishment in 1990-92 | Percentage of population suffering from undernourishment in 2004-06 |
|---|---|---|---|
| 1 | 29% | 75% | |
| 2 | 67% | 66% | |
| 3 | 44% | 63% | |
| 4 | | 63% | 58% |
| 5 | 45% | 46% | |
| 6 | | 40% | 45% |
| 7 | | 66% | 44% |
| 8 | | 71% | 44% |
| 9 | | 47% | 41% |
| 10 | | 45% | 40% |
| 11 | | 40% | 39% |
| 12 | | 59% | 38% |
| 13 | | 30% | 38% |
| 14 | | 59% | 37% |
| 15 | | 45% | 37% |
| 16 | | 32% | 35% |
| 17 | | 28% | 35% |
| 18 | | 21% | 32% |
| 19 | | 30% | 32% |
| 20 | | 33% | 30% |
| 21 | | 45% | 29% |
| 22 | | 30% | 29% |
| 23 | | 20% | 29% |
| 24 | | 38% | 28% |
| 25 | | 36% | 26% |
| 26 | | 20% | 26% |
| 27 | 34% | 26% | |
| 28 | | 38% | 25% |
| 29 | | 28% | 25% |
| 30 | 29% | 24% | |
| 31 | | 27% | 25% |
| 32 | | 24% | 23% |
| 33 | | 34% | 23% |
| 34 | | 24% | 22% |
| 35 | | 40% | 21% |
| 36 | | 27% | 21% |
| 37 | | 52% | 21% |
| 38 | | 27% | 21% |
| 39 | | 31% | 20% |
| 40 | | 28% | 19% |
| 41 | | 27% | 19% |
| 42 | | 29% | 19% |
| 43 | | 12% | 18% |
| 44 | | 44% | 17% |
| 45 | | 18% | 17% |
| 46 | | 29% | 17% |
| Developing World | 20% | 16% | |
| 47 | | 14% | 16% |
| 48 | | 19% | 16% |
| 49 | | 21% | 16% |
| 50 | | 15% | 15% |
| 51 | | 21% | 15% |
| 52 | | 19% | 15% |
| 53 | | 15% | 14% |
| 54 | | 24% | 13% |
| 55 | | 28% | 13% |
| 56 | | 28% | 13% |
| 57 | | 5% | 13% |
| 58 | | 19% | 12% |
| 59 | | 47% | 12% |
| 60 | | 16% | 12% |
| 61 | | 14% | 12% |
| 31 | | 43% | 10% |
| 63 | | 15% | 10% |
| 64 | | 15% | 10% |
| 65 | | 9% | 10% |
| 66 | | 14% | 10% |
| 67 | | 11% | 10% |
| 68 | | 14% | 9% |
| 69 | | 34% | 8% |
| 70 | | 15% | 8% |
| 71 | | 11% | 7% |
| 72 | | 18% | 6% |
| 73 | | 7% | 6% |
| 74 | | 9% | 6% |
| 75 | | 11% | 5% |
| 76 | | <5% | <5% |
| 77 | | <5% | <5% |
| 78 | | 6% | <5% |
| 79 | | 7% | <5% |
| 80 | | 6% | <5% |
| 81 | | 5% | <5% |
| 82 | | <5% | <5% |
| 83 | | 5% | <5% |
| 84 | | <5% | <5% |
| 85 | | <5% | <5% |
| 86 | | <5% | <5% |
| 87 | | 9% | <5% |
| 88 | | 20% | <5% |
| 89 | | <5% | <5% |
| 90 | | <5% | <5% |
| 91 | | <5% | <5% |
| 92 | | 5% | <5% |
| 93 | | 5% | <5% |
| 94 | | <5% | <5% |
| 95 | | <5% | <5% |
| 96 | | <5% | <5% |
- Source: FAO: The State of Food Insecurity in the World 2009
- Source: FAO Statistics Division
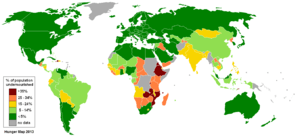
- Source: Nations World Food Programme - World Hunger Map
Middle East
Malnutrition rates in Iraq had risen from 19% before the US-led invasion to a national average of 28% four years later.[8] By 2010, according to the UN Food and Agriculture Organization, only 8% were malnourished. (See data above.)
South Asia
According to the Global Hunger Index, South Asia has the highest child malnutrition rate of world's regions.[9] India, a largely vegetarian country and second largest country in the world by population, contributes most number in malnutrition in the region.The 2006 report mentioned that "the low status of women in South Asian countries and their lack of nutritional knowledge are important determinants of high prevalence of underweight children in the region" and was concerned that South Asia has "inadequate feeding and caring practices for young children".[10]
30% children of India are underweight,[11] one of the highest rates in the world and nearly double the rate of Sub-Saharan Africa.[12]
Research on overcoming persistent under-nutrition published by the Institute of Development Studies, argues that the co-existence of India as an 'economic powerhouse' and home to one-third of the world's under-nourished children reflects a failure of the governance of nutrition: "A poor capacity to deliver the right services at the right time to the right populations, an inability to respond to citizens' needs and weak accountability are all features of weak nutrition governance."[13] The research suggests that to make under-nutrition history in India the governance of nutrition needs to be strengthened and new research needs to focus on the politics and governance of nutrition. At the current rate of progress the MDG1 target for nutrition will only be reached in 2042 with severe consequences for human wellbeing and economic growth.[13]
United States
Childhood malnutrition is generally thought of as being limited to developing countries, but although most malnutrition occurs there, it is also an ongoing presence in developed nations. For example, in the United States of America, one out of every six children is at risk of hunger. A study, based on 2005–2007 data from the U.S. Census Bureau and the Agriculture Department, shows that an estimated 3.5 million children under the age of five are at risk of hunger in the United States.[14]
In developed countries, this persistent hunger problem is not due to lack of food or food programs, but is largely due to an underutilization of existing programs designed to address the issue, such as food stamps or school meals. Many citizens of rich countries such as the United States of America attach stigmas to food programs or otherwise discourage their use. In the USA, only 60% of those eligible for the food stamp program actually receive benefits.[15]
The U.S. Department of Agriculture reported that in 2003, only 1 out of 200 U.S. households with children became so severely food insecure that any of the children went hungry even once during the year. A substantially larger proportion of these same households (3.8 percent) had adult members who were hungry at least one day during the year because of their households' inability to afford enough food.[16]
References
- ↑ "Mortality and Burden of Disease Estimates for WHO Member States in 2002" (xls). World Health Organization. 2002.
- ↑ Meeting the 2015 international hunger targets: taking stock of uneven progress Food and Agriculture Organization of the United Nations, Economic and Social Development Department, May 2015, Retrieved 15 October 2015
- ↑ Jean Ziegler."Promotion And Protection Of All Human Rights, Civil, Political, Economic, Social And Cultural Rights, Including The Right To Development: Report of the Special Rapporteur on the right to food, Jean Ziegler".Human Rights Council of the United Nations, January 10, 2008."According to the Food and Agriculture Organization of the United Nations (FAO), the world already produces enough food to feed every child, woman and man and could feed 12 billion people, or double the current world population."
- ↑ Food and Agriculture Organization Economic and Social Development Department. "The State of Food Insecurity in the World, 2015 : Meeting the 2015 international hunger targets: taking stock of uneven progress". Food and Agriculture Organization of the United Nations, 2015, p. 48.
- ↑ Food and Agriculture Organization Agricultural and Development Economics Division."The State of Food Insecurity in the World, 2006 : Eradicating world hunger – taking stock ten years after the World Food Summit". Food and Agriculture Organization of the United Nations, 2006, p. 8. "Because of population growth, the very small decrease in the number of hungry people has nevertheless resulted in a reduction in the proportion of undernourished people in the developing countries by 3 percentage points – from 20 percent in 1990–92 to 17 percent in 2001–03. (…) the prevalence of undernourishment declined by 9 percent (from 37 percent to 28 percent) between 1969–71 and 1979–81 and by a further 8 percentage points (to 20 percent) between 1979–81 and 1990–92.".
- ↑ Food and Agriculture Organization Economic and Social Development Department."The State of Food Insecurity in the World, 2008 : High food prices and food security — threats and opportunities". Food and Agriculture Organization of the United Nations, 2008, p. 3. "For the developing regions as a whole, the share of undernourished people in the total population has decreased from 23.3 percent in 1990–92 to 12.9 per cent.".
- ↑ "The State of Food Insecurity in the World" (PDF). FAO. 2015. Retrieved 2015-10-15.
- ↑ of Iraqi children now malnourished four years after US invasion Reuters. 16 March 2007
- ↑ "Global Hunger Index Key Findings & Facts". 2008.
- ↑ Pandey, Geeta (2006-10-13). "'Hunger critical' in South Asia". BBC. Retrieved 2010-05-12.
- ↑ "Survey Says Nearly Half of India's Children Are Malnourished". CBS News. 2007-02-10. Archived from the original on March 8, 2009.
- ↑ "India: Undernourished Children: A Call for Reform and Action". World Bank.
- 1 2 Haddad, L. and Zeitlyn, S. (2009-07-02). "Lifting the Curse: Overcoming Persistent Undernutrition in India". IDS Bulletin. 40 (4).
- ↑ "3.5M Kids Under 5 On Verge Of Going Hungry
Study: 11 Percent Of U.S. Households Lack Food For Healthy Lifestyle". Health. CBS NEWS. 2009-05-07. Retrieved 2009-05-08. - ↑ "Plan to End Childhood Hunger in America". Share Our Strength. 2009.
- ↑ http://www.ers.usda.gov/amber-waves/2005-april/data-feature.aspx