Lowellville, Ohio
| Lowellville, Ohio | |
|---|---|
| Village | |
|
Lowellville Municipal Building | |
 Location of Lowellville, Ohio | |
 Location of Lowellville in Mahoning County | |
| Coordinates: 41°2′23″N 80°32′25″W / 41.03972°N 80.54028°WCoordinates: 41°2′23″N 80°32′25″W / 41.03972°N 80.54028°W | |
| Country | United States |
| State | Ohio |
| County | Mahoning |
| Township | Poland |
| Government | |
| • Mayor | James Iudiciani |
| Area[1] | |
| • Total | 1.44 sq mi (3.73 km2) |
| • Land | 1.36 sq mi (3.52 km2) |
| • Water | 0.08 sq mi (0.21 km2) |
| Elevation[2] | 820 ft (250 m) |
| Population (2010)[3] | |
| • Total | 1,155 |
| • Estimate (2012[4]) | 1,135 |
| • Density | 849.3/sq mi (327.9/km2) |
| Time zone | Eastern (EST) (UTC-5) |
| • Summer (DST) | EDT (UTC-4) |
| ZIP code | 44436 |
| Area code(s) | 330 |
| FIPS code | 39-45178[5] |
| GNIS feature ID | 1048936[2] |
| Website | Website |

Lowellville is a village in Mahoning County, Ohio, United States, in the "Steel Valley" area of the northeast part of the state, southeast of Youngstown. The village is an older, predominantly Italian-American, working-class community built along the banks of the Mahoning River, and centered on the once productive Sharon Steel works. The population was 1,155 at the 2010 census. It is part of the Youngstown-Warren-Boardman, OH-PA Metropolitan Statistical Area.
Geography
Lowellville is located at 41°2′23″N 80°32′25″W / 41.03972°N 80.54028°W (41.039592, -80.540165),[6] and sits on the Pennsylvania-Ohio border, just west of Mahoningtown, Hillsville, and New Castle, Pennsylvania.
According to the United States Census Bureau, the village has a total area of 1.44 square miles (3.73 km2), of which 1.36 square miles (3.52 km2) is land and 0.08 square miles (0.21 km2) is water.[1]
Demographics
| Historical population | |||
|---|---|---|---|
| Census | Pop. | %± | |
| 1850 | 268 | — | |
| 1860 | 304 | 13.4% | |
| 1870 | 722 | 137.5% | |
| 1880 | 816 | 13.0% | |
| 1890 | 762 | −6.6% | |
| 1900 | 1,137 | 49.2% | |
| 1910 | 1,592 | 40.0% | |
| 1920 | 2,214 | 39.1% | |
| 1930 | 2,550 | 15.2% | |
| 1940 | 2,359 | −7.5% | |
| 1950 | 2,227 | −5.6% | |
| 1960 | 2,055 | −7.7% | |
| 1970 | 1,836 | −10.7% | |
| 1980 | 1,558 | −15.1% | |
| 1990 | 1,349 | −13.4% | |
| 2000 | 1,281 | −5.0% | |
| 2010 | 1,155 | −9.8% | |
| Est. 2015 | 1,107 | [7] | −4.2% |
2010 census
As of the census[3] of 2010, there were 1,155 people, 472 households, and 302 families residing in the village. The population density was 849.3 inhabitants per square mile (327.9/km2). There were 536 housing units at an average density of 394.1 per square mile (152.2/km2). The racial makeup of the village was 98.9% White, 0.3% African American, 0.1% Native American, 0.2% Asian, and 0.6% from two or more races. Hispanic or Latino of any race were 1.2% of the population.
There were 472 households of which 31.4% had children under the age of 18 living with them, 43.0% were married couples living together, 15.7% had a female householder with no husband present, 5.3% had a male householder with no wife present, and 36.0% were non-families. 33.9% of all households were made up of individuals and 19.5% had someone living alone who was 65 years of age or older. The average household size was 2.45 and the average family size was 3.14.
The median age in the village was 41.6 years. 23.2% of residents were under the age of 18; 9.6% were between the ages of 18 and 24; 21.7% were from 25 to 44; 28.6% were from 45 to 64; and 16.9% were 65 years of age or older. The gender makeup of the village was 45.7% male and 54.3% female.
2000 census
As of the census[5] of 2000, there were 1,281 people, 520 households, and 344 families residing in the village. The population density was 891.4 people per square mile (343.5/km²). There were 553 housing units at an average density of 384.8 per square mile (148.3/km²). The racial makeup of the village was 99.22% White, 0.08% African American, 0.08% Asian, and 0.62% from two or more races. Hispanic or Latino of any race were 1.41% of the population.
There were 520 households out of which 26.5% had children under the age of 18 living with them, 51.2% were married couples living together, 11.3% had a female householder with no husband present, and 33.8% were non-families. 32.5% of all households were made up of individuals and 19.4% had someone living alone who was 65 years of age or older. The average household size was 2.46 and the average family size was 3.15.
In the village the population was spread out with 24.4% under the age of 18, 8.4% from 18 to 24, 26.2% from 25 to 44, 18.5% from 45 to 64, and 22.6% who were 65 years of age or older. The median age was 38 years. For every 100 females there were 90.3 males. For every 100 females age 18 and over, there were 85.3 males.
The median income for a household in the village was $29,565, and the median income for a family was $38,000. Males had a median income of $34,167 versus $22,188 for females. The per capita income for the village was $14,422. About 5.8% of families and 9.4% of the population were below the poverty line, including 13.9% of those under age 18 and 8.1% of those age 65 or over.
Media
Lowellville is served by the Hometown Journal, a local weekly newspaper.
References
- 1 2 "US Gazetteer files 2010". United States Census Bureau. Retrieved 2013-01-06.
- 1 2 "US Board on Geographic Names". United States Geological Survey. 2007-10-25. Retrieved 2008-01-31.
- 1 2 "American FactFinder". United States Census Bureau. Retrieved 2013-01-06.
- ↑ "Population Estimates". United States Census Bureau. Retrieved 2013-06-17.
- 1 2 "American FactFinder". United States Census Bureau. Retrieved 2008-01-31.
- ↑ "US Gazetteer files: 2010, 2000, and 1990". United States Census Bureau. 2011-02-12. Retrieved 2011-04-23.
- ↑ "Annual Estimates of the Resident Population for Incorporated Places: April 1, 2010 to July 1, 2015". Retrieved July 2, 2016.
- ↑ "Census of Population and Housing". Census.gov. Retrieved June 4, 2015.
External links
Municipalities and communities of Mahoning County, Ohio, United States | ||
|---|---|---|
| Cities | 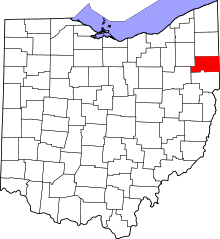 | |
| Villages | ||
| Townships | ||
| CDPs | ||
| Unincorporated communities |
| |
| Footnotes | ‡This populated place also has portions in an adjacent county or counties | |