Liverpool Riverside (UK Parliament constituency)
Coordinates: 53°21′18″N 2°56′49″W / 53.355°N 2.947°W
| Liverpool, Riverside | |
|---|---|
|
Borough constituency for the House of Commons | |
|
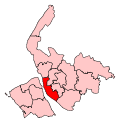
Boundary of Liverpool, Riverside in Merseyside. | |
|
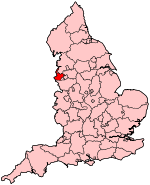
Location of Merseyside within England. | |
| County | Merseyside |
| Electorate | 73,406 (December 2010)[1] |
| Current constituency | |
| Created | 1983 |
| Member of parliament | Louise Ellman (Labour Co-op) |
| Number of members | One |
| Created from |
Liverpool Toxteth, Liverpool Scotland Exchange |
| Overlaps | |
| European Parliament constituency | North West England |
Liverpool Riverside is a constituency[n 1] represented in the House of Commons of the UK Parliament since 1997 by Louise Ellman of the Labour Party and the Co-operative Party.[n 2]
Boundaries
1983-1997: The City of Liverpool wards of Abercromby, Arundel, Dingle, Everton, Granby, and Vauxhall.
1997-2010: The City of Liverpool wards of Abercromby, Aigburth, Arundel, Dingle, Everton, Granby, Smithdown, and Vauxhall.
2010-present: The City of Liverpool wards of Central, Greenbank, Kirkdale, Mossley Hill, Princes Park, Riverside, and St Michael's.
The constituency is one of five covering the city of Liverpool. It covers the central area of the city, including some of the famous sights of the city such as the Royal Liver Building and Albert Dock, as well as the localities of Aigburth, Canning, Chinatown, Dingle, Kirkdale, Part of Mossley Hill, St Michael's Hamlet, Toxteth and Vauxhall. It also contains both the University of Liverpool and Liverpool John Moores University.
History
The constituency was created in 1983 merging most of the former Liverpool Scotland Exchange and Liverpool Toxteth constituencies. In their provisional recommendations, the Boundary Commission originally suggested calling the constituency Liverpool Abercromby. The name was changed during the local enquiry process, during which an alternate name of Liverpool Cathedrals was also proposed.[2]
It has always been held by the Labour Party; from 1983 until 1997 by Robert Parry (formerly MP for one of the predecessor seats from 1974), and since then by Louise Ellman. It is a safe seat covering a deprived urban area. In both the 2001 and 2005 general elections it had the lowest turnout of all constituencies in the United Kingdom.[3]
In the 2005 general election, there was a considerable swing (+8.1%) to the Liberal Democrats, however Labour were still comfortably ahead. Also in 2005, Liverpool Riverside was one of the few seats where the Green Party retained its deposit, scoring just over 5% of the vote.
Members of Parliament
| Election | Member[4] | Party | |
|---|---|---|---|
| 1983 | Robert Parry | Labour | |
| 1997 | Louise Ellman | Labour Co-op | |
Elections
Elections in the 2010s
| Party | Candidate | Votes | % | ± | |
|---|---|---|---|---|---|
| Labour Co-op | Louise Ellman | 29,835 | 67.4 | +8.1 | |
| Green | Martin Dobson | 5,372 | 12.1 | +8.6 | |
| Conservative | Jackson Ng | 4,245 | 9.6 | −1.3 | |
| UKIP | Joe Chiffers | 2,510 | 5.7 | +3.9 | |
| Liberal Democrat | Paul Childs | 1,719 | 3.9 | −18.9 | |
| TUSC | Tony Mulhearn | 582 | 1.3 | +1.3 | |
| Majority | 24,463 | 55.3 | +18.8 | ||
| Turnout | 44,263 | 62.4 | +10.3 | ||
| Labour Co-op hold | Swing | −0.3 | |||
| Party | Candidate | Votes | % | ± | |
|---|---|---|---|---|---|
| Labour Co-op | Louise Ellman | 22,998 | 59.3 | +0.0 | |
| Liberal Democrat | Richard David Marbrow | 8,825 | 22.7 | −0.6 | |
| Conservative | Kegang Wu | 4,243 | 10.9 | +1.9 | |
| Green | Tom Crone | 1,355 | 3.5 | −1.7 | |
| BNP | Peter Stafford | 706 | 1.8 | +1.8 | |
| UKIP | Patricia Ann Gaskell | 674 | 1.7 | +0.1 | |
| Majority | 14,173 | 36.5 | |||
| Turnout | 38,801 | 52.1 | +9.4 | ||
| Labour Co-op hold | Swing | +0.3 | |||
Elections in the 2000s
The turnout compared to the 2001 election had risen by 7.4% to 41.5% (an above average increase). However, this was still the lowest throughout the United Kingdom which averaged 61.3% with a 1.2% increase.
| Party | Candidate | Votes | % | ± | |
|---|---|---|---|---|---|
| Labour Co-op | Louise Ellman | 17,951 | 57.6 | −13.8 | |
| Liberal Democrat | Richard David Marbrow | 7,737 | 24.8 | +8.1 | |
| Conservative | Mrs. Gabrielle J.F. Howatson | 2,843 | 9.1 | +0.7 | |
| Green | Peter A.E. Cranie | 1,707 | 5.5 | N/A | |
| Socialist Labour | Miss Beth R. Marshall | 498 | 1.6 | N/A | |
| UKIP | Mrs. Ann R.F. Irving | 455 | 1.5 | N/A | |
| Majority | 10,214 | 32.7 | −17.7 | ||
| Turnout | 31,191 | 41.5 | +7.4 | ||
| Labour Co-op hold | Swing | ||||
In the 2001 election it had a turnout of 34.1% which was the lowest of the United Kingdom. The average turnout in that year was 59.2%.
| Party | Candidate | Votes | % | ± | |
|---|---|---|---|---|---|
| Labour Co-op | Louise Ellman | 18,201 | 71.4 | +1.0 | |
| Liberal Democrat | Richard David Marbrow | 4,251 | 16.7 | +3.4 | |
| Conservative | Miss Judith Caroline Edwards | 2,142 | 8.4 | −1.1 | |
| Socialist Alliance | Mrs. Cathy Wilson | 909 | 3.6 | +1.6 | |
| Majority | 13,950 | 54.7 | |||
| Turnout | 25,503 | 34.1 | |||
| Labour Co-op hold | Swing | ||||
Elections in the 1990s
| Party | Candidate | Votes | % | ± | |
|---|---|---|---|---|---|
| Labour Co-op | Louise Ellman | 26,858 | 70.4 | ||
| Liberal Democrat | Mrs. Beatrice L. Fraenkel | 5,059 | 13.3 | ||
| Conservative | David G. Sparrow | 3,635 | 9.5 | ||
| Socialist Alternative | Mrs. Cathy Wilson | 776 | 2.0 | ||
| Liberal | David W. Green | 594 | 1.6 | ||
| Referendum | George Skelly | 586 | 1.5 | ||
| ProLife Alliance | Miss Heather M. Neilson | 277 | 0.7 | ||
| Multi-Racial Anti-Corruption Alliance | David Oswald Braid | 179 | 0.5 | ||
| Natural Law | Geoffrey Norman Walter Gay | 171 | 0.5 | ||
| Majority | 21,799 | 57.2 | |||
| Turnout | 38,135 | 51.6 | |||
| Labour Co-op hold | Swing | ||||
| Party | Candidate | Votes | % | ± | |
|---|---|---|---|---|---|
| Labour | Robert Parry | 20,550 | 75.9 | +2.7 | |
| Conservative | Andrew Zsigmond | 3,113 | 11.5 | −2.3 | |
| Liberal Democrat | Mohammed Akbar Ali | 2,498 | 9.3 | −2.0 | |
| Green | Lawrence Brown | 738 | 2.7 | N/A | |
| Natural Law | John D. Collins | 169 | 0.6 | N/A | |
| Majority | 17,437 | 64.4 | +5.0 | ||
| Turnout | 27,068 | 54.6 | −4.8 | ||
| Labour hold | Swing | +2.5 | |||
Elections in the 1980s
| Party | Candidate | Votes | % | ± | |
|---|---|---|---|---|---|
| Labour | Robert Parry | 25,505 | 73.2 | +8.3 | |
| Conservative | Stephen Fitzsimmons | 4,816 | 13.8 | −6.0 | |
| Social Democratic | Baldey Singh Chahal | 3, 912 | 11.3 | −2.7 | |
| Communist | Katherine Anne Gardner | 601 | 1.7 | +1.0 | |
| Majority | 20,689 | 59.4 | |||
| Turnout | 34,834 | 65.3 | |||
| Labour hold | Swing | +7.5 | |||
| Party | Candidate | Votes | % | ± | |
|---|---|---|---|---|---|
| Labour | Robert Parry | 24,978 | 64.9 | −2.0 | |
| Conservative | Thomas Morrison | 7,600 | 19.8 | −0.7 | |
| Social Democratic | Peter Zentner | 5,381 | 14.0 | +3.2 | |
| Communist | John Christopher Blevin | 261 | 0.7 | N/A | |
| Workers Revolutionary | David Latchford | 234 | 0.6 | N/A | |
| Majority | 17,378 | 45.2 | N/A | ||
| Turnout | 38, 454 | 62.4 | N/A | ||
| Labour win (new seat) | |||||
See also
Notes and references
- Notes
- ↑ A borough constituency (for the purposes of election expenses and type of returning officer)
- ↑ As with all constituencies, the constituency elects one Member of Parliament (MP) by the first past the post system of election at least every five years.
- References
- ↑ "Electorate Figures - Boundary Commission for England". 2011 Electorate Figures. Boundary Commission for England. 4 March 2011. Retrieved 13 March 2011.
- ↑ Boundary Commission for England, Third Periodic Review, 1983
- ↑ Dawson, Katie (2010-05-05). "Can Liverpool Riverside improve its voting turnout?". BBC News. Retrieved 5 May 2010.
- ↑ Leigh Rayment's Historical List of MPs – Constituencies beginning with "R" (part 1)
- ↑ "Election Data 2015". Electoral Calculus. Archived from the original on 17 October 2015. Retrieved 17 October 2015.
- ↑ "Liverpool Riverside". BBC News. Retrieved 10 May 2015.
- ↑ "Election Data 2010". Electoral Calculus. Archived from the original on 17 October 2015. Retrieved 17 October 2015.
- ↑ "Election Data 2005". Electoral Calculus. Archived from the original on 15 October 2011. Retrieved 18 October 2015.
- ↑ "Election Data 2001". Electoral Calculus. Archived from the original on 15 October 2011. Retrieved 18 October 2015.
- ↑ "Election Data 1997". Electoral Calculus. Archived from the original on 15 October 2011. Retrieved 18 October 2015.
- ↑ "'Liverpool Riverside', May 1997 -". ElectionWeb Project. Cognitive Computing Limited. Retrieved 17 May 2016.
- ↑ "Election Data 1992". Electoral Calculus. Archived from the original on 15 October 2011. Retrieved 18 October 2015.
- ↑ "UK General Election results April 1992". Richard Kimber's Political Science Resources. Politics Resources. 9 April 1992. Retrieved 2010-12-06.
- ↑ "Election Data 1987". Electoral Calculus. Archived from the original on 15 October 2011. Retrieved 18 October 2015.
- ↑ "Election Data 1983". Electoral Calculus. Archived from the original on 15 October 2011. Retrieved 18 October 2015.