List of provincial results of the South African general election, 2014
The South African general election, 2014 occurred on 7 May of that year. In addition to the election of the National Assembly, which saw Jacob Zuma re-elected as President, elections were held for the provincial legislatures in each province.[1]
Eight of the nine provincial legislatures were won by the dominant party, the African National Congress. The other province, Western Cape was won by the main opposition, the Democratic Alliance.
Eastern Cape

Seats in the Eastern Cape Provincial Legislature 2014.
African National Congress
Democratic Alliance
Economic Freedom Fighters
Congress of the People (1)
African Independent Congress (1)

Leading party by ward in the Eastern Cape provincial election
African National Congress
Democratic Alliance
United Democratic Movement
African National Congress
Democratic Alliance
United Democratic Movement
| Party | Votes | % | +/− | Seats | +/− | |
|---|---|---|---|---|---|---|
| African National Congress | 1,528,345 | 70.09 | 45 | |||
| Democratic Alliance | 353,316 | 16.20 | [lower-alpha 1] |
10 | [lower-alpha 1] | |
| United Democratic Movement | 134,280 | 6.16 | 4 | |||
| Economic Freedom Fighters | 75,776 | 3.48 | New | 2 | New | |
| Congress of the People | 26,129 | 1.20 | 1 | |||
| African Independent Congress | 16,786 | 0.77 | 1 | |||
| Pan Africanist Congress | 9,691 | 0.44 | 0 | |||
| African Christian Democratic Party | 7,291 | 0.33 | 0 | |||
| Freedom Front Plus | 6,818 | 0.31 | 0 | |||
| African People's Convention | 5,000 | 0.23 | 0 | |||
| Kingdom Governance Movement | 3,932 | 0.18 | New | 0 | New | |
| National Freedom Party | 3,472 | 0.16 | New | 0 | New | |
| Azanian People's Organisation | 2,509 | 0.12 | 0 | |||
| Agang SA | 2,372 | 0.11 | New | 0 | New | |
| United Congress | 1,406 | 0.06 | New | 0 | New | |
| Inkatha Freedom Party | 1,388 | 0.06 | 0 | |||
| United Christian Democratic Party | 1,194 | 0.05 | 0 | |||
| Patriotic Movement of South Africa | 759 | 0.03 | 0 | |||
| Total | 2,180,464 | 100.00 | 63 | |||
| Valid votes | 2,180,464 | 98.52 | ||||
| Spoilt votes | 32,657 | 1.48 | ||||
| Total votes cast | 2,213,121 | 100.00 | ||||
| Registered voters/turnout | 3,240,059 | 68.30 | ||||
| Source: IEC | ||||||
Free State

Seats in the Free State Legislature 2014.
African National Congress
Democratic Alliance
Economic Freedom Fighters
Freedom Front Plus
Leading party by ward in the Free State provincial election
African National Congress
Democratic Alliance
African National Congress
Democratic Alliance
| Party | Votes | % | +/− | Seats | +/− | |
|---|---|---|---|---|---|---|
| African National Congress | 708,720 | 69.85 | 22 | |||
| Democratic Alliance | 164,672 | 16.23 | [lower-alpha 2] |
5 | [lower-alpha 2] | |
| Economic Freedom Fighters | 82,674 | 8.15 | New | 2 | New | |
| Freedom Front Plus | 21,339 | 2.10 | 1 | |||
| Congress of the People | 16,516 | 1.63 | 0 | |||
| African Christian Democratic Party | 5,150 | 0.51 | 0 | |||
| African People's Convention | 3,198 | 0.32 | 0 | |||
| Pan Africanist Congress | 2,133 | 0.21 | 0 | |||
| United Democratic Movement | 2,127 | 0.21 | 0 | |||
| Agang SA | 2,065 | 0.20 | New | 0 | New | |
| Azanian People's Organisation | 1,581 | 0.16 | New | 0 | New | |
| United Christian Democratic Party | 1,139 | 0.11 | 0 | |||
| Inkatha Freedom Party | 1,124 | 0.11 | 0 | |||
| National Freedom Party | 1,115 | 0.11 | New | 0 | New | |
| Patriotic Alliance | 651 | 0.06 | New | 0 | New | |
| Independent Civic Organisation | 459 | 0.05 | New | 0 | New | |
| Total | 1,014,663 | 100.00 | 30 | |||
| Valid votes | 1,014,663 | 98.58 | ||||
| Spoilt votes | 14,634 | 1.42 | ||||
| Total votes cast | 1,029,297 | 100.00 | ||||
| Registered voters/turnout | 1,449,488 | 71.01 | ||||
| Source: IEC | ||||||
Gauteng

Seats in the Gauteng Provincial Legislature 2014.
African National Congress
Democratic Alliance
Economic Freedom Fighters
Freedom Front Plus (1)
Inkatha Freedom Party (1)

Leading party by ward in the Gauteng provincial election
African National Congress
Democratic Alliance
African National Congress
Democratic Alliance
| Party | Votes | % | +/− | Seats | +/− | |
|---|---|---|---|---|---|---|
| African National Congress | 2,348,564 | 53.59 | 40 | |||
| Democratic Alliance | 1,349,001 | 30.78 | [lower-alpha 2] |
23 | [lower-alpha 2] | |
| Economic Freedom Fighters | 451,318 | 10.30 | New | 8 | New | |
| Freedom Front Plus | 52,436 | 1.20 | 1 | |||
| Inkatha Freedom Party | 34,240 | 0.78 | 1 | |||
| African Christian Democratic Party | 27,196 | 0.62 | 0 | |||
| Congress of the People | 21,652 | 0.49 | 0 | |||
| National Freedom Party | 20,733 | 0.47 | New | 0 | New | |
| United Democratic Movement | 19,486 | 0.44 | 0 | |||
| Agang SA | 18,258 | 0.42 | New | 0 | New | |
| Pan Africanist Congress | 11,241 | 0.26 | 0 | |||
| African People's Convention | 7,187 | 0.16 | 0 | |||
| Azanian People's Organisation | 5,110 | 0.12 | 0 | |||
| United Christian Democratic Party | 3,641 | 0.08 | 0 | |||
| Minority Front | 3,237 | 0.07 | New | 0 | New | |
| Front National | 2,285 | 0.05 | New | 0 | New | |
| Workers and Socialist Party | 1,988 | 0.05 | New | 0 | New | |
| Patriotic Alliance | 1,811 | 0.04 | New | 0 | New | |
| Independent Civic Organisation | 974 | 0.02 | New | 0 | New | |
| Kingdom Governance Movement | 815 | 0.02 | New | 0 | New | |
| Lekgotla for Democracy Advancement | 695 | 0.02 | New | 0 | New | |
| Merafong Civic Association | 295 | 0.01 | New | 0 | New | |
| Total | 4,382,163 | 100.00 | 73 | |||
| Valid votes | 4,382,163 | 99.04 | ||||
| Spoilt votes | 42,261 | 0.96 | ||||
| Total votes cast | 4,424,424 | 100.00 | ||||
| Registered voters/turnout | 6,063,739 | 72.97 | ||||
| Source: IEC | ||||||
KwaZulu-Natal

Seats in the KwaZulu-Natal Provincial Legislature 2014.
African National Congress
Democratic Alliance
Inkatha Freedom Party
National Freedom Party
Economic Freedom Fighters (2)
Minority Front (1)
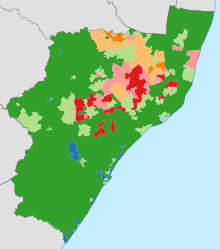
Leading party by ward in the KwaZulu-Natal provincial election
African National Congress
Democratic Alliance
Inkatha Freedom Party
National Freedom Party
African National Congress
Democratic Alliance
Inkatha Freedom Party
National Freedom Party
| Party | Votes | % | +/− | Seats | +/− | |
|---|---|---|---|---|---|---|
| African National Congress | 2,475,041 | 64.52 | 52 | |||
| Democratic Alliance | 489,430 | 12.76 | [lower-alpha 2] |
10 | [lower-alpha 2] | |
| Inkatha Freedom Party | 416,496 | 10.86 | 9 | |||
| National Freedom Party | 280,425 | 7.31 | New | 6 | New | |
| Economic Freedom Fighters | 70,823 | 1.85 | New | 2 | New | |
| Minority Front | 38,960 | 1.02 | 1 | |||
| African Christian Democratic Party | 16,803 | 0.44 | 0 | |||
| Freedom Front Plus | 7,695 | 0.20 | 0 | |||
| African People's Convention | 7,040 | 0.18 | 0 | |||
| United Democratic Movement | 6,632 | 0.17 | 0 | |||
| Congress of the People | 5,968 | 0.16 | 0 | |||
| Azanian People's Organisation | 5,873 | 0.15 | New | 0 | New | |
| Truly Alliance | 4,082 | 0.11 | New | 0 | New | |
| Pan Africanist Congress | 2,930 | 0.08 | 0 | |||
| KwaZulu-Natal Transport Alliance | 2,796 | 0.07 | New | 0 | New | |
| United Christian Democratic Party | 2,186 | 0.06 | 0 | |||
| Kingdom Governance Movement | 1,903 | 0.05 | New | 0 | New | |
| Ubumbano Lwesizwe Sabangoni | 926 | 0.02 | New | 0 | New | |
| Total | 3,836,009 | 100.00 | 80 | |||
| Valid votes | 3,836,009 | 98.67 | ||||
| Spoilt votes | 51,831 | 1.33 | ||||
| Total votes cast | 3,887,840 | 100.00 | ||||
| Registered voters/turnout | 5,117,131 | 75.98 | ||||
| Source: IEC | ||||||
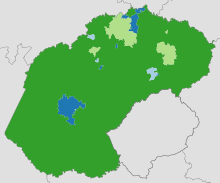
Limpopo

Seats in the Limpopo Provincial Legislature 2014.
African National Congress
Economic Freedom Fighters
Democratic Alliance
Congress of the People

Leading party by ward in the Limpopo provincial election
African National Congress
Democratic Alliance
African National Congress
Democratic Alliance
| Party | Votes | % | +/− | Seats | +/− | |
|---|---|---|---|---|---|---|
| African National Congress | 1,149,348 | 78.60 | 39 | |||
| Economic Freedom Fighters | 156,982 | 10.74 | New | 6 | New | |
| Democratic Alliance | 94,724 | 6.48 | 3 | |||
| Congress of the People | 12,573 | 0.86 | 1 | |||
| Freedom Front Plus | 10,102 | 0.69 | 0 | |||
| African Christian Democratic Party | 6,988 | 0.48 | 0 | |||
| Agang SA | 5,197 | 0.36 | New | 0 | New | |
| African People's Convention | 5,085 | 0.35 | 0 | |||
| Pan Africanist Congress | 4,266 | 0.29 | 0 | |||
| United Democratic Movement | 3,920 | 0.27 | 0 | |||
| Azanian People's Organisation | 3,851 | 0.26 | 0 | |||
| Ximoko Party | 3,044 | 0.21 | 0 | |||
| Workers and Socialist Party | 1,222 | 0.08 | New | 0 | New | |
| Inkatha Freedom Party | 1,219 | 0.08 | 0 | |||
| South African Maintenance and Estate Beneficiaries Association | 1,105 | 0.08 | New | 0 | New | |
| United Christian Democratic Party | 850 | 0.06 | 0 | |||
| National Freedom Party | 586 | 0.04 | New | 0 | New | |
| Lekgotla for Democracy Advancement | 556 | 0.04 | New | 0 | New | |
| Unemployed Movement SA | 349 | 0.02 | New | 0 | New | |
| Merafong Civic Association | 219 | 0.01 | New | 0 | New | |
| Total | 1,462,186 | 100.00 | 49 | |||
| Valid votes | 1,462,186 | 98.76 | ||||
| Spoilt votes | 18,409 | 1.24 | ||||
| Total votes cast | 1,480,595 | 100.00 | ||||
| Registered voters/turnout | 2,438,280 | 60.72 | ||||
| Source: IEC | ||||||
Mpumalanga

Seats in the Mpumalanga Provincial Legislature 2014.
African National Congress
Democratic Alliance
Economic Freedom Fighters
Bushbuckridge Residents Association

Leading party by ward in the Mpumalanga provincial election
African National Congress
Democratic Alliance
Bushbuckridge Residents Association
African National Congress
Democratic Alliance
Bushbuckridge Residents Association
| Party | Votes | % | +/− | Seats | +/− | |
|---|---|---|---|---|---|---|
| African National Congress | 1,045,409 | 78.23 | 24 | |||
| Democratic Alliance | 138,990 | 10.40 | [lower-alpha 2] |
3 | [lower-alpha 2] | |
| Economic Freedom Fighters | 83,589 | 6.26 | New | 2 | New | |
| Bushbuckridge Residents Association | 15,368 | 1.15 | New | 1 | New | |
| Freedom Front Plus | 11,018 | 0.82 | 0 | |||
| National Freedom Party | 10,066 | 0.75 | New | 0 | New | |
| African People's Convention | 5,940 | 0.44 | 0 | |||
| African Christian Democratic Party | 5,324 | 0.40 | 0 | |||
| Congress of the People | 4,288 | 0.32 | 0 | |||
| Sindawonye Progressive Party | 4,244 | 0.32 | 0 | |||
| Inkatha Freedom Party | 3,481 | 0.26 | 0 | |||
| Pan Africanist Congress | 3,109 | 0.23 | 0 | |||
| Agang SA | 1,705 | 0.13 | New | 0 | New | |
| United Democratic Movement | 1,701 | 0.13 | 0 | |||
| Azanian People's Organisation | 1,235 | 0.09 | 0 | |||
| United Christian Democratic Party | 792 | 0.06 | 0 | |||
| Total | 1,336,259 | 100.00 | 30 | |||
| Valid votes | 1,336,259 | 98.57 | ||||
| Spoilt votes | 19,333 | 1.43 | ||||
| Total votes cast | 1,355,592 | 100.00 | ||||
| Registered voters/turnout | 1,860,834 | 72.85 | ||||
| Source: IEC | ||||||
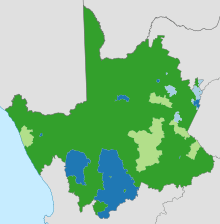
North West
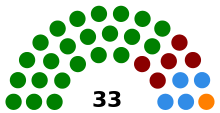
Seats in the North West Provincial Legislature 2014.
African National Congress
Economic Freedom Fighters
Democratic Alliance
Freedom Front Plus

Leading party by ward in the North West provincial election
African National Congress
Democratic Alliance
Economic Freedom Fighters
African National Congress
Democratic Alliance
Economic Freedom Fighters
| Party | Votes | % | +/− | Seats | +/− | |
|---|---|---|---|---|---|---|
| African National Congress | 733,490 | 67.39 | 23 | |||
| Economic Freedom Fighters | 143,765 | 13.21 | new | 5 | new | |
| Democratic Alliance | 138,521 | 12.73 | [lower-alpha 2] |
4 | [lower-alpha 2] | |
| Freedom Front Plus | 18,746 | 1.72 | 1 | |||
| United Christian Democratic Party | 12,811 | 1.18 | 0 | |||
| Congress of the People | 8,692 | 0.80 | 0 | |||
| United Democratic Movement | 9,615 | 0.88 | 0 | |||
| African Christian Democratic Party | 5,728 | 0.53 | 0 | |||
| Agang SA | 4,736 | 0.44 | new | 0 | new | |
| African People's Convention | 4,398 | 0.40 | 0 | |||
| Azanian People's Organisation | 1,796 | 0.17 | 0 | |||
| National Freedom Party | 1,582 | 0.15 | new | 0 | new | |
| Inkatha Freedom Party | 1,496 | 0.14 | 0 | |||
| Pan Africanist Congress | 1,473 | 0.14 | 0 | |||
| Workers and Socialist Party | 939 | 0.09 | new | 0 | new | |
| South African Political Party | 662 | 0.06 | 0 | |||
| Total | 1,088,450 | 100.00 | 33 | |||
| Valid votes | 1,088,450 | 98.32 | ||||
| Spoilt votes | 18,629 | 1.68 | ||||
| Total votes cast | 1,107,079 | 100.00 | ||||
| Registered voters/turnout | 1,669,349 | 66.32 | ||||
| Source: IEC | ||||||
Northern Cape

Seats in the Northern Cape Provincial Legislature 2014.
African National Congress
Democratic Alliance
Economic Freedom Fighters
Congress of the People
Leading party by ward in the Northern Cape provincial election
African National Congress
Democratic Alliance
African National Congress
Democratic Alliance
| Party | Votes | % | +/− | Seats | +/− | |
|---|---|---|---|---|---|---|
| African National Congress | 272,053 | 64.40 | 20 | |||
| Democratic Alliance | 100,916 | 23.89 | [lower-alpha 2] |
7 | [lower-alpha 2] | |
| Economic Freedom Fighters | 20,951 | 4.96 | New | 2 | New | |
| Congress of the People | 15,218 | 3.60 | 1 | |||
| Freedom Front Plus | 4,600 | 1.09 | 0 | |||
| African Christian Democratic Party | 2,421 | 0.57 | 0 | |||
| United Christian Democratic Party | 1,542 | 0.37 | 0 | |||
| African People's Convention | 1,191 | 0.28 | 0 | |||
| Azanian People's Organisation | 1,062 | 0.25 | 0 | |||
| Patriotic Alliance | 584 | 0.14 | New | 0 | New | |
| Independent Civic Organisation | 499 | 0.12 | New | 0 | New | |
| Pan Africanist Congress | 460 | 0.11 | 0 | |||
| United Democratic Movement | 366 | 0.09 | 0 | |||
| Inkatha Freedom Party | 239 | 0.06 | 0 | |||
| First Nation Liberation Alliance | 194 | 0.05 | New | 0 | New | |
| National Freedom Party | 139 | 0.03 | New | 0 | New | |
| Total | 422,431 | 100.00 | 30 | |||
| Valid votes | 422,431 | 98.58 | ||||
| Spoilt votes | 6,106 | 1.42 | ||||
| Total votes cast | 428,537 | 100.00 | ||||
| Registered voters/turnout | 601,080 | 71.29 | ||||
| Source: IEC | ||||||
Western Cape

Seats in the Western Cape Provincial Parliament 2014.
Democratic Alliance
African National Congress
Economic Freedom Fighters
African Christian Democratic Party

Leading party by ward in the Western Cape provincial election
African National Congress
Democratic Alliance
Independent Civic Organisation of South Africa
African National Congress
Democratic Alliance
Independent Civic Organisation of South Africa
| Party | Votes | % | +/− | Seats | +/− | |
|---|---|---|---|---|---|---|
| Democratic Alliance | 1,259,645 | 59.38 | [lower-alpha 2] |
26 | [lower-alpha 2] | |
| African National Congress | 697,664 | 32.89 | 14 | |||
| Economic Freedom Fighters | 44,762 | 2.11 | New | 1 | New | |
| African Christian Democratic Party | 21,696 | 1.02 | 1 | |||
| Al Jama-ah | 13,182 | 0.62 | [lower-alpha 3] |
0 | ||
| Congress of the People | 12,520 | 0.59 | 0 | |||
| Independent Civic Organisation | 11,949 | 0.56 | New | 0 | New | |
| Freedom Front Plus | 11,587 | 0.55 | 0 | |||
| United Democratic Movement | 10,199 | 0.48 | 0 | |||
| Patriotic Alliance | 8,510 | 0.40 | New | 0 | New | |
| African Independent Congress | 6,508 | 0.31 | New | 0 | New | |
| Agang SA | 6,398 | 0.30 | New | 0 | New | |
| Pan Africanist Congress | 3,591 | 0.17 | 0 | |||
| National Party | 2,694 | 0.13 | 0 | |||
| African People's Convention | 1,291 | 0.06 | 0 | |||
| African National Party | 1,249 | 0.06 | New | 0 | New | |
| Indigenous Peoples Organisation | 1,180 | 0.06 | New | 0 | New | |
| United Christian Democratic Party | 1,158 | 0.05 | 0 | |||
| Inkatha Freedom Party | 1,078 | 0.05 | 0 | |||
| Azanian People's Organisation | 844 | 0.04 | 0 | |||
| National Freedom Party | 763 | 0.04 | New | 0 | New | |
| South African Progressive Civic Organisation | 642 | 0.03 | New | 0 | New | |
| First Nation Liberation Alliance | 635 | 0.03 | New | 0 | New | |
| Kingdom Governance Movement | 490 | 0.02 | New | 0 | New | |
| Sibanye Civic Association | 478 | 0.02 | New | 0 | New | |
| Peoples Alliance | 440 | 0.02 | New | 0 | New | |
| Total | 2,121,153 | 100.00 | 42 | |||
| Valid votes | 2,121,153 | 99.12 | ||||
| Spoilt votes | 18,937 | 0.88 | ||||
| Total votes cast | 2,140,090 | 100.00 | ||||
| Registered voters/turnout | 2,941,333 | 72.76 | ||||
| Source: IEC | ||||||
Notes
- 1 2 Compared to the combined performance of the Democratic Alliance and the Independent Democrats in 2009.
- 1 2 3 4 5 6 7 8 9 10 11 12 13 14 Compared to the combined performance of the Democratic Alliance and the Independent Democrats in 2009.
- ↑ Compared to the combined performance of Al Jama-ah and the Africa Muslim Party in 2009.
References
- ↑ "Zuma signs election proclamation". News24. news24.com. 21 February 2014. Retrieved 1 January 2015.
This article is issued from Wikipedia - version of the 3/16/2016. The text is available under the Creative Commons Attribution/Share Alike but additional terms may apply for the media files.