List of municipalities in New Brunswick
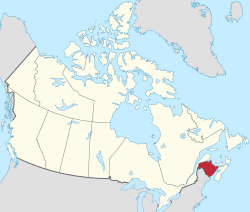
New Brunswick is the eighth-most populous province in Canada with 751,171 residents as of the 2011 Census. It is the third-smallest in land area at approximately 71,400 km2 (27,600 sq mi).[1] New Brunswick's 107 municipalities[2] cover only 8.6% of the province's land mass but are home to 65.3% of its population.
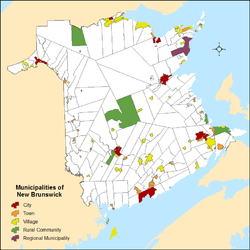
Municipalities in New Brunswick may incorporate under the Municipalities Act of 1973 as a city, town, village, regional municipality, or rural community.[3] Municipal governments are led by elected councils and are responsible for the delivery of services such as civic administration, land use planning, emergency measures, policing, road, and garbage collection.[4] New Brunswick has 8 cities, 26 towns, 65 villages, 1 regional municipality, and 7 rural communities.[4][5] Although rural communities are under the Municipalities Act, the provincial government distinguishes them from municipalities.[6]
In 1785, Saint John became the first community in what would eventually become Canada to incorporate as a city.[7] It is New Brunswick's largest municipality by population with 70,063 residents as of the 2011 census and largest urban municipality by land area at 315.82 km2 (121.94 sq mi).[8] Approximately one-third of the residents of New Brunswick do not live in municipalities but reside in local service districts, which are unincorporated communities administered by the Minister of Environment and Local Government and have no local government of their own.[4]
Cities
The Lieutenant-Governor in Council may incorporate a town as a city under the Municipal Act if it has a population of at least 10,000.[3] Cities already in existence on January 1, 1967 continue to be incorporated regardless of population.[3] New Brunswick had eight cities that had a cumulative population of 272,174 and an average population of 34,022 in the 2011 Census.[8] Saint John is New Brunswick's largest city by population and land area with 70,063 residents and 315.82 km2 (121.94 sq mi) respectively.[8] Campbellton is New Brunswick's smallest city by population and land area with 7,385 residents and 18.66 km2 (7.20 sq mi).[8]
Towns
The Lieutenant-Governor in Council may incorporate a village as a town under the Municipal Act if it has a population of 1,500 or more, and provides a level of services that the Minister of Environment and Local Government considers appropriate.[3] Towns already in existence on January 1, 1967 continue to be incorporated regardless of population.[3] New Brunswick had 26 towns that had a cumulative population of 129,311 and an average population of 4,974 in the 2011 Census.[8] New Brunswick's largest town by population is Riverview with 19,128 residents and largest town by area is Sackville with a land area of 74.32 km2 (28.70 sq mi).[8] New Brunswick's smallest town by population is Hartland with 947 residents and the smallest by land area is Saint-Quentin at 74.32 km2 (28.70 sq mi).[8]
Villages
New Brunswick had 66 villages at the time of the 2011 Census,[8] which dropped to 65 on July 1, 2012 when Kedgwick became a rural community.[9] In the 2011 Census, the province's 65 villages had a cumulative population of 71,956 and an average population of 1,107.[8] New Brunswick's largest village by population is Memramcook with 4,831 residents and largest village by area is Belledune with a land area of 189.33 km2 (73.10 sq mi).[8] New Brunswick's smallest village by population is Meductic with 228 residents and the smallest by land area is Saint-Louis de Kent at 2.00 km2 (0.77 sq mi).[8][10]
Regional municipalities
New Brunswick's first and only regional municipality was incorporated on May 12, 2014.[11] The Regional Municipality of Tracadie was formed through the amalgamation of the former Town of Tracadie–Sheila, eighteen local service districts and portions of two other local service districts.[11] Regional municipalities must have a population greater than 15,000 and a community grouping that includes at least one municipality.[4] Regional municipalities elect a local council but are responsible only for community administration, planning and emergency measures services, and all services previously provided by any former municipality that is now part of the regional municipality.[4] The Province of New Brunswick is responsible for police protection and road services, unless the regional municipality chooses to assume these responsibilities.[4]
Rural communities
New Brunswick had four rural communities at the time of the 2011 Census;[8] this increased to seven following the incorporations of Kedgwick in 2012 and Cocagne and Hanwell in 2014.[lower-alpha 1] These seven rural communities had a cumulative population of 12,406 and an average population of 1,772 in the 2011 Census.[8] New Brunswick's largest and smallest rural communities are Beaubassin East and Saint-André with populations of 6,200 and 819 respectively.[8] Rural communities elect local councils and are responsible for the delivery of some local services, including administrative services, community planning and emergency measures.[4] The province of New Brunswick ensures the delivery of other services including solid waste collection and recreation services unless the rural community chooses to take on these responsibilities.[4] Rural communities that include a former village or town are an exception, as they are responsible to provide all services that were previously provided by their former municipality.[4]
Haut-Madawaska
In a 2016 plebiscite, the residents of six parishes (Baker Brook, Clair, Lac Baker, Madawaska, Saint-François, and Saint-Hilaire) and four villages (Baker Brook, Clair, Saint-François de Madawaska and Saint-Hilaire) within the New Brunswick Panhandle voted 493 to 299 in favour of incorporating a new rural community under the name of Haut-Madawaska.[14] The plebiscite was the second in as many years. In 2015, a similar plebiscite was held that also included a fifth village, Lac Baker. The residents of all communities involved voted in favour of incorporation as a rural community with the exception of Lac Baker's residents, thereby defeating the proposal.[15]
List
-
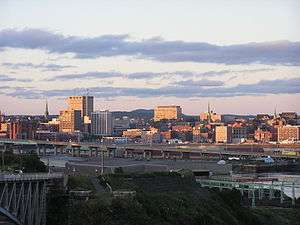
Skyline of Saint John, New Brunswick's largest municipality
-
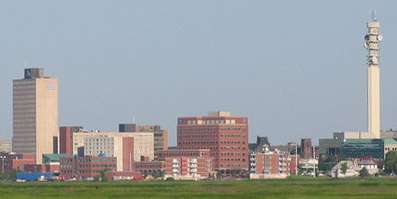
Skyline of Moncton, New Brunswick's second-largest municipality
-
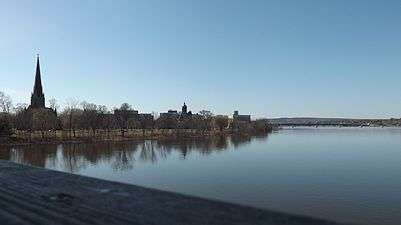
Skyline of Fredericton, New Brunswick's capital city and third-largest municipality
| Name | Status | Incorporation year[16] |
Population (2011)[8] |
Population (2006)[8] |
Change[8] | Land area (km²)[8] |
Population density[8] |
|---|---|---|---|---|---|---|---|
| Bathurst | City | 1912 | 12,275 | 12,714 | −3.5% | 91.86 | 133.6/km2 |
| Campbellton | City | 1888 | 7,385 | 7,384 | 0.0% | 18.66 | 395.8/km2 |
| Dieppe | City | 1952 | 23,310 | 18,565 | +25.6% | 54.11 | 430.8/km2 |
| Edmundston | City | 1952 | 16,032 | 16,643 | −3.7% | 107.00 | 149.8/km2 |
| Fredericton | City | 1848 | 56,224 | 50,535 | +11.3% | 131.67 | 427.0/km2 |
| Miramichi | City | 1995 | 17,811 | 18,129 | −1.8% | 179.93 | 99.0/km2 |
| Moncton | City | 1890 | 69,074 | 64,128 | +7.7% | 141.17 | 489.3/km2 |
| Saint John | City | 1785 | 70,063 | 68,043 | +3.0% | 315.82 | 221.8/km2 |
| Beresford | Town | 1967 | 4,351 | 4,264 | +2.0% | 19.20 | 226.6/km2 |
| Bouctouche | Town | 1966 | 2,423 | 2,383 | +1.7% | 18.34 | 132.1/km2 |
| Caraquet | Town | 1961 | 4,169 | 4,156 | +0.3% | 68.26 | 61.1/km2 |
| Dalhousie | Town | 1905 | 3,512 | 3,676 | −4.5% | 14.51 | 242.0/km2 |
| Florenceville-Bristol | Town | 2008 | 1,639 | 1,539 | +6.5% | 15.61 | 105.0/km2 |
| Grand Bay-Westfield | Town | 1998 | 5,117 | 4,981 | +2.7% | 59.86 | 85.5/km2 |
| Grand Falls | Town | 1890 | 5,706 | 5,650 | +1.0% | 18.06 | 315.9/km2 |
| Hampton | Town | 1966 | 4,292 | 4,004 | +7.2% | 21.00 | 204.4/km2 |
| Hartland | Town | 1918 | 947 | 947 | 0.0% | 9.63 | 98.3/km2 |
| Lamèque | Town | 1966 | 1,432 | 1,422 | +0.7% | 12.45 | 115.0/km2 |
| Nackawic | Town | 1976 | 1,049 | 977 | +7.4% | 8.40 | 124.9/km2 |
| Oromocto | Town | 1956 | 8,932 | 8,402 | +6.3% | 22.37 | 399.3/km2 |
| Quispamsis | Town | 1966 | 17,886 | 15,239 | +17.4% | 57.06 | 313.5/km2 |
| Richibucto | Town | 1966 | 1,286 | 1,290 | −0.3% | 11.83 | 108.7/km2 |
| Riverview | Town | 1973 | 19,128 | 17,832 | +7.3% | 33.88 | 564.6/km2 |
| Rothesay | Town | 1988 | 11,947 | 11,637 | +2.7% | 34.77 | 343.6/km2 |
| Sackville | Town | 1903 | 5,558 | 5,411 | +2.7% | 74.32 | 74.8/km2 |
| Saint Andrews | Town | 1903 | 1,889 | 1,798 | +5.1% | 8.35 | 226.2/km2 |
| St. George | Town | 1904 | 1,543 | 1,309 | +17.9% | 16.13 | 95.7/km2 |
| Saint-Léonard | Town | 1920 | 1,343 | 1,352 | −0.7% | 5.20 | 258.3/km2 |
| Saint-Quentin | Town | 1947 | 2,095 | 2,250 | −6.9% | 4.30 | 487.2/km2 |
| St. Stephen | Town | 1973[lower-alpha 2] | 4,817 | 4,780 | +0.8% | 13.45 | NAN.0/km2 |
| Shediac | Town | 1903 | 6,053 | 5,497 | +10.1% | 12.50 | 484.2/km2 |
| Shippagan | Town | 1947 | 2,631[10] | 2,754 | −4.5% | 9.94 | 264.7/km2 |
| Sussex | Town | 1904 | 4,312 | 4,241 | +1.7% | 9.03 | 477.5/km2 |
| Woodstock | Town | 1856 | 5,254 | 5,113 | +2.8% | 13.41 | 391.8/km2 |
| Alma | Village | 1966 | 232 | 301 | −22.9% | 47.64 | 4.9/km2 |
| Aroostook | Village | 1966 | 351 | 346 | +1.4% | 2.24 | 156.7/km2 |
| Atholville | Village | 1966 | 1,237 | 1,317 | −6.1% | 10.25 | 120.7/km2 |
| Baker Brook | Village | 1967 | 585 | 525 | +11.4% | 12.29 | 47.6/km2 |
| Balmoral | Village | 1972 | 1,719 | 1,706 | +0.8% | 43.53 | 39.5/km2 |
| Bas-Caraquet | Village | 1966 | 1,380 | 1,471 | −6.2% | 31.00 | 44.5/km2 |
| Bath | Village | 1966 | 532 | 512 | +3.9% | 2.03 | 262.1/km2 |
| Belledune | Village | 1968 | 1,548 | 1,711 | −9.5% | 189.33 | 8.2/km2 |
| Bertrand | Village | 1968 | 1,137 | 1,179 | −3.6% | 46.45 | 24.5/km2 |
| Blacks Harbour | Village | 1972 | 982 | 952 | +3.2% | 8.90 | 110.3/km2 |
| Blackville | Village | 1966 | 990 | 931 | +6.3% | 21.73 | 45.6/km2 |
| Cambridge-Narrows | Village | 1966 | 620 | 717 | −13.5% | 106.94 | 5.8/km2 |
| Canterbury | Village | 1966 | 336[10] | 360 | −6.7% | 5.34 | 62.9/km2 |
| Cap-Pelé | Village | 1969 | 2,256 | 2,279 | −1.0% | 23.78 | 94.9/km2 |
| Centreville | Village | 1966 | 542 | 523 | +3.6% | 2.69 | 201.5/km2 |
| Charlo | Village | 1966 | 1,324 | 1,386 | −4.5% | 31.24 | 42.4/km2 |
| Chipman | Village | 1966 | 1,236 | 1,291 | −4.3% | 19.58 | 63.1/km2 |
| Clair | Village | 1966 | 857 | 848 | +1.1% | 10.39 | 82.5/km2 |
| Doaktown | Village | 1966 | 793 | 888 | −10.7% | 28.74 | 27.6/km2 |
| Dorchester | Village | 1966 | 1,167 | 1,119 | +4.3% | 5.74 | 203.3/km2 |
| Drummond | Village | 1967 | 775 | 839 | −7.6% | 8.91 | 87.0/km2 |
| Eel River Crossing | Village | 1966 | 1,209 | 1,168 | +3.5% | 17.45 | 69.3/km2 |
| Fredericton Junction | Village | 1966 | 752 | 715 | +5.2% | 23.86 | 31.5/km2 |
| Gagetown | Village | 1966 | 698 | 719 | −2.9% | 49.48 | 14.1/km2 |
| Grand Manan | Village | 1995 | 2,377 | 2,460 | −3.4% | 150.86 | 15.8/km2 |
| Grande-Anse | Village | 1968 | 738 | 758 | −2.6% | 24.42 | 30.2/km2 |
| Harvey | Village | 1966 | 363 | 352 | +3.1% | 2.46 | 147.6/km2 |
| Hillsborough | Village | 1966 | 1,350 | 1,292 | +4.5% | 12.98 | 104.0/km2 |
| Lac Baker | Village | 1967 | 719 | 705 | +2.0% | 37.12 | 19.4/km2 |
| Le Goulet | Village | 1986 | 817 | 908 | −10.0% | 5.46 | 149.6/km2 |
| Maisonnette | Village | 1986 | 573 | 599 | −4.3% | 12.88 | 44.5/km2 |
| McAdam | Village | 1966 | 1,284 | 1,404 | −8.5% | 14.47 | 88.7/km2 |
| Meductic | Village | 1966 | 228[10] | 155 | +47.1% | 5.57 | 40.9/km2 |
| Memramcook | Village | 1995 | 4,831 | 4,638 | +4.2% | 185.71 | 26.0/km2 |
| Millville | Village | 1966 | 307 | 303 | +1.3% | 12.16 | 25.2/km2 |
| Minto | Village | 1966 | 2,505 | 2,681 | −6.6% | 31.53 | 79.4/km2 |
| Neguac | Village | 1967 | 1,678 | 1,623 | +3.4% | 26.69 | 62.9/km2 |
| New Maryland | Village | 1991 | 4,232 | 4,248 | −0.4% | 21.24 | 199.2/km2 |
| Nigadoo | Village | 1967 | 952 | 927 | +2.7% | 7.69 | 123.8/km2 |
| Norton | Village | 1966 | 1,301 | 1,314 | −1.0% | 75.35 | 17.3/km2 |
| Paquetville | Village | 1966 | 706 | 642 | +10.0% | 9.40 | 75.1/km2 |
| Perth-Andover | Village | 1966 | 1,778 | 1,797 | −1.1% | 8.89 | 200.0/km2 |
| Petitcodiac | Village | 1966 | 1,429 | 1,368 | +4.5% | 17.22 | 83.0/km2 |
| Petit-Rocher | Village | 1966 | 1,908 | 1,949 | −2.1% | 4.49 | 424.9/km2 |
| Plaster Rock | Village | 1966 | 1,135 | 1,150 | −1.3% | 3.09 | 367.3/km2 |
| Pointe-Verte | Village | 1966 | 976 | 971 | +0.5% | 13.79 | 70.8/km2 |
| Port Elgin | Village | 1922 | 418 | 451 | −7.3% | 2.61 | 160.2/km2 |
| Rexton | Village | 1966 | 818 | 862 | −5.1% | 6.14 | 133.2/km2 |
| Riverside-Albert | Village | 1966 | 353 | 320 | +10.3% | 3.41 | 103.5/km2 |
| Rivière-Verte | Village | 1966 | 744 | 798 | −6.8% | 7.00 | 106.3/km2 |
| Rogersville | Village | 1966 | 1,170 | 1,165 | +0.4% | 7.23 | 161.8/km2 |
| Sainte-Anne-de-Madawaska | Village | 1966 | 1,002 | 1,073 | −6.6% | 9.21 | 108.8/km2 |
| Saint-Antoine | Village | 1966[lower-alpha 3] | 1,770 | 1,546 | +14.5% | 6.43 | 275.3/km2 |
| Saint-François-de-Madawaska | Village | 1966 | 533 | 585 | −8.9% | 6.34 | 84.1/km2 |
| Saint-Hilaire | Village | 1967 | 303[10] | 231 | +31.2% | 5.67 | 53.4/km2 |
| Saint-Isidore | Village | 1966 | 748 | 796 | −6.0% | 22.58 | 33.1/km2 |
| Saint-Léolin | Village | 1978 | 684[10] | 733 | −6.7% | 19.78 | 34.6/km2 |
| Saint-Louis de Kent | Village | 1966 | 930 | 960 | −3.1% | 2.00 | 465.0/km2 |
| Sainte-Marie-Saint-Raphaël | Village | 1986 | 955 | 993 | −3.8% | 15.61 | 61.2/km2 |
| St. Martins | Village | 1966 | 314 | 386 | −18.7% | 2.29 | 137.1/km2 |
| Salisbury | Village | 1966 | 2,208 | 2,036 | +8.4% | 13.68 | 161.4/km2 |
| Stanley | Village | 1966 | 419 | 433 | −3.2% | 17.34 | 24.2/km2 |
| Sussex Corner | Village | 1966 | 1,495 | 1,413 | +5.8% | 9.43 | 158.5/km2 |
| Tide Head | Village | 1966 | 1,036 | 1,075 | −3.6% | 19.57 | 52.9/km2 |
| Tracy | Village | 1966 | 611 | 619 | −1.3% | 29.39 | 20.8/km2 |
| Tracadie | Regional municipality | 2014[17] | 16,137 | 24.65 | 200.1[18] | ||
| Beaubassin East | Rural community | 1995[19] | 6,200 | 6,429 | −3.6% | 291.12 | 21.3/km2 |
| Campobello Island | Rural community | 2010[20] | 925 | 1,056 | −12.4% | 39.67 | 23.3/km2 |
| Cocagne | Rural community | 2014[12] | 2,540[21] | ||||
| Hanwell | Rural community | 2014[13] | 4,740[21] | ||||
| Kedgwick[lower-alpha 4] | Rural community | 2012[9] | 2,089 | 2,251 | −7.2% | 657.76 | 3.2/km2 |
| Saint-André | Rural community | 2006[22] | 819 | 868 | −5.6% | 8.12 | 100.9/km2 |
| Upper Miramichi | Rural community | 2008[23] | 2,373 | 2,414 | −1.7% | 1,835.01 | 1.3/km2 |
| Total cities | — | — | 272,174 | 256,141 | +6.3% | 1,040.22 | 261.7/km2 |
| Total regional municipality | — | — | 4,933 | — | — | 24.65 | 200.1/km2 |
| Total rural communities[lower-alpha 5] | — | — | 12,406 | 13,018 | −4.7% | 2,831.68 | 4.4/km2 |
| Total towns | — | — | 129,311 | 122,904 | +5.2% | 591.86 | 218.5/km2 |
| Total villages | — | — | 71,956 | 72,522 | −0.8% | 1,638.71 | 43.9/km2 |
| Total municipalities | — | — | 490,780 | — | — | 6,127.12 | 80.1/km2 |
See also
- Demographics of New Brunswick
- Geography of New Brunswick
- List of census agglomerations in Atlantic Canada
- List of communities in New Brunswick
- List of designated places in New Brunswick
- List of local service districts in New Brunswick
- List of municipal amalgamations in New Brunswick
- List of parishes in New Brunswick
- List of population centres in New Brunswick
- List of rural communities in New Brunswick
- List of villages in New Brunswick
- New Brunswick municipal elections, 2016
Notes
- ↑ Kedgwick was incorporated as a rural community through the amalgamation of the former Village of Kedgwick with the former local service district of the parish of Grimmer,[9] while Cocagne and Hanwell were previously local service districts.[12][13]
- ↑ St. Stephen was incorporated as a town in 1871, but amalgamated with Milltown in 1973 and renamed St. Stephen-Milltown but the name reverted to St. Stephen in 1975.[16]
- ↑ Incorporated as St. Anthony but the name was changed to Saint-Antoine in 1969.[16]
- ↑ Figures include the local service district of the parish of Grimmer which was incorporated with Kedgwick in 2012[9]
- ↑ Totals exclude the 2006 populations and 2011 land areas of Cocagne and Hanwell as their 2006 populations and 2011 land areas are not available from Statistics Canada.
References
- ↑ "Population and dwelling counts, for Canada, provinces and territories, 2011 and 2006 censuses". Statistics Canada. Retrieved June 25, 2013.
- ↑ "Welcome to the Association of Municipal Administrators of New Brunswick". The Association of Municipal Administrators of New Brunswick. 2015. Retrieved August 16, 2015.
- 1 2 3 4 5 "Municipalities Act (R.S.N.B. 1973, c. M-22)". Government of New Brunswick. 1973. Retrieved April 24, 2015.
- 1 2 3 4 5 6 7 8 9 "Types of Local Governments". Government of New Brunswick. 2015. Retrieved March 20, 2015.
- ↑ "Community Profiles". Government of New Brunswick. 2015. Retrieved January 17, 2016.
- ↑ "Municipalities (Cities, Towns, Villages) and Rural Communities". Government of New Brunswick. Retrieved January 6, 2016.
- ↑ "Provincial Archives of New Brunswick". Government of New Brunswick. 2015. Retrieved January 17, 2016.
- 1 2 3 4 5 6 7 8 9 10 11 12 13 14 15 16 17 18 19 "Population and dwelling counts, for Canada, provinces and territories, and census subdivisions (municipalities), 2011 and 2006 censuses (New Brunswick)". Statistics Canada. May 28, 2012. Retrieved January 4, 2013.
- 1 2 3 4 "Rural Community of Kedgwick Regulation – Municipalities Act" (PDF). Queen's Printer for New Brunswick. March 15, 2012. p. 2. Retrieved September 22, 2014.
- 1 2 3 4 5 6 "Corrections and updates: Population and dwelling count amendments, 2011 Census". Statistics Canada. February 14, 2013. Retrieved February 15, 2013.
- 1 2 "Establishing the Regional Municipality of Grand Tracadie-Sheila" (PDF). New Brunswick Department of Environment and Local Government. February 2014. Retrieved September 20, 2014.
- 1 2 "Rural Community of Cocagne Regulation – Municipalities Act" (PDF). Queen's Printer for New Brunswick. March 28, 2014. p. 2. Retrieved September 22, 2014.
- 1 2 "Rural Community of Hanwell Regulation – Municipalities Act" (PDF). Queen's Printer for New Brunswick. March 28, 2014. p. 2. Retrieved September 22, 2014.
- ↑ "Miramichi picks Adam Lordon as new mayor". CBC. November 14, 2016. Retrieved November 21, 2016.
- ↑ "No amalgamation for Sussex area, Haut-Madawaska". CBC. November 9, 2015. Retrieved November 21, 2016.
- 1 2 3 "Provincial Archives of New Brunswick". Government of New Brunswick. 2015. Retrieved March 6, 2015.
- ↑ "Regional Municipality of Grand Tracadie-Sheila Regulation – Municipalities Act" (PDF). Government of New Brunswick Office of the Attorney General. March 28, 2014. p. 3. Retrieved September 17, 2014.
- ↑ "Municipal Profile". Ville de Tracadie-Sheila Inc. 2015. Retrieved September 22, 2015.
- ↑ "Rural Community of Beaubassin East Regulation – Municipalities Act" (PDF). Queen's Printer for New Brunswick. March 24, 1995. p. 6. Retrieved September 22, 2014.
- ↑ "Rural Community of Campobello Island Regulation – Municipalities Act" (PDF). Queen's Printer for New Brunswick. August 31, 2010. p. 2. Retrieved September 22, 2014.
- 1 2 "Interim List of Changes to Municipal Boundaries, Status, and Names, From January 2, 2014 to January 1, 2015 – Table 1 Changes to census subdivisions in alphabetical order by province and territory (with 8C and 9C)" (XLSX). Statistics Canada. May 27, 2015. Retrieved May 30, 2015.
- ↑ "Rural Community of Saint-André Regulation – Municipalities Act" (PDF). Queen's Printer for New Brunswick. May 26, 2006. p. 4. Retrieved September 22, 2014.
- ↑ "Rural Community of Upper Miramichi Regulation – Municipalities Act" (PDF). Queen's Printer for New Brunswick. March 17, 2008. p. 4. Retrieved September 22, 2014.
External links
| Provinces | |
|---|---|
| Territories | |
| |