Growth of photovoltaics
| |||||||||||||||||||||||||||||||||||||||||||||||||||||||||||||||||||||
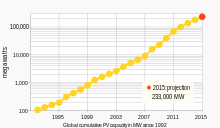
Worldwide growth of photovoltaics has been fitting an exponential curve for more than two decades. During this period of time, photovoltaics (PV), also known as solar PV, has evolved from a pure niche market of small scale applications towards becoming a mainstream electricity source. When solar PV systems were first recognized as a promising renewable energy technology, programs, such as feed-in tariffs, were implemented by a number of governments in order to provide economic incentives for investments. For several years, growth was mainly driven by Japan and pioneering European countries. As a consequence, cost of solar declined significantly due to improvements in technology and economies of scale, even more so when production of solar cells and modules started to ramp up in China.[5] Since then, deployment of photovoltaics is gaining momentum on a worldwide scale, particularly in Asia but also in North America and other regions, where solar PV is now increasingly competing with conventional energy sources as grid parity has already been reached in about 30 countries.[6]:9
Projections for photovoltaic growth are difficult and burdened with many uncertainties. Official agencies, such as the International Energy Agency consistently increased their estimates over the years, but still fell short of actual deployment.[7][8][9]
Historically, the United States had been the leader of installed photovoltaics for many years, and its total capacity amounted to 77 megawatts in 1996—more than any other country in the world at the time. Then, Japan stayed ahead as the world's leader of produced solar electricity until 2005, when Germany took the lead. The country is currently approaching the 40,000 megawatt mark. China is expected to continue its rapid growth and to triple its PV capacity to 70,000 megawatts by 2017.[10][11] In 2015, China became world's largest producer of photovoltaic power.[12][13][14] By the end of 2014, cumulative photovoltaic capacity reached at least 178 gigawatts (GW), sufficient to supply 1 percent of global electricity demands. Solar now contributes 7.9 percent and 7.0 percent to the respective annual domestic consumption in Italy and Germany.[3] For 2015, worldwide deployment of about 55 GW is being forecasted, and installed capacity is projected to more than double or even triple beyond 500 GW between now and 2020.[1] By 2050, solar power is anticipated to become the world's largest source of electricity, with solar photovoltaics and concentrated solar power contributing 16 and 11 percent, respectively. This will require PV capacity to grow to 4,600 GW, of which more than half is forecasted to be deployed in China and India.[15]
Current status
Current status describes worldwide, regional and domestic solar PV deployment as of the end of 2014 (see section Forecast for 2015). The unit of power, watt, is frequently used as multiples, such as kilowatt (kW), megawatt (MW), gigawatt (GW) and terawatt (TW). Nameplate capacity in the article is displayed as MW and has to be understood as direct current megawatt-peak (MWp), if not otherwise explicitly denoted as, for example, MWAC[2]:15[16]:10
For a complete history of deployment over the last two decades, also see section History of deployment.
Worldwide
In 2014, cumulative photovoltaic capacity increased by 40.1 GW or 28% and reached at least 178 GW by the end of the year, sufficient to supply 1 percent of the world's total electricity consumption of currently 18,400 TWh.[1][3]:5–6 Although this represents a new all-time record in the history of global PV deployment, overall expectations had been higher as module shipments amounted to 44–46 GW and suggested higher overall installations.[1] Annual installation for 2014 expanded slightly by 5% when compared to worldwide installation of 38.3 GW in 2013.[2]:9

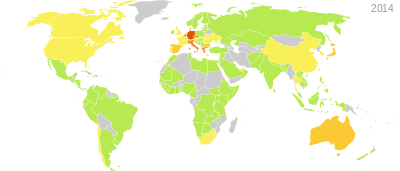
Cumulative PV capacity by region as of the end of 2014.[3]
| Report | Cumulative (MWp) | Installed (MWp) | Year-End Period |
Release date | Type | Ref |
|---|---|---|---|---|---|---|
| IEA-PVPS snapshot | >177,000 | >38,700 | 2014 | March 2015 | preliminary | [3] |
| SPE outlook(a) | 178,391 | 40,134 | 2014 | June 2015 | detailed | [1] |
| IEA-PVPS trends | >177,000 | ~40,000 | 2014 | October 2015 | final | [17] |
| Overview of reported annual installations and global cumulative figures in chronological order (a) SPE also noted that global PV-shipment was much higher, about 44–46 GW in 2014.[1]:5 | ||||||
Regions
In 2014, Asia was the fastest growing region, with more than 60% of global installations. China and Japan alone accounted for 20 GW or half of worldwide deployment. Europe continued to decline and installed 7 GW or 18% of the global PV market, three times less than in the record-year of 2011, when 22 GW had been installed. For the first time, North and South America combined accounted for at least as much as Europe, about 7.1 GW or about 18% of global total. This is due to the strong growth in the United States, supported by Canada, Chile and Mexico.[3]
In terms of cumulative capacity, Europe is still the most developed region with 88 GW or half of the global total of 178 GW. Solar PV now covers 3.5% and 7% of European electricity demand and peak electricity demand, respectively.[3]:6 The Asia-Pacific region (APAC) which includes countries such as Japan, India and Australia, follows second and accounts for about 20% percent of worldwide capacity. In third position ranks China with 16%, followed by the Americas with about 12%. Cumulative capacity in the MEA (Middle East and Africa) region and ROW (rest of the world) accounted for only about 3.3% of the global total. A great untapped potential remains for many of these countries, especially in the Sunbelt.
Countries
Added PV capacity by country in 2014 (clustered by region)[3]
As in the year before, the world's top installer of 2014 were China (+10.6 GW), followed by Japan (+9.6 GW) and the United States (+6.2 GW), while the United Kingdom (+2.3 GW) emerged as new European leader ahead of Germany (+1.9 GW) and France (+0.9 GW). Germany remains for one more year the world's largest producer of solar power with an overall installed capacity of 38.2 GW.[3]
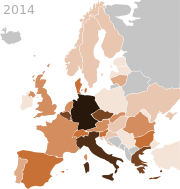
Chile (+0.4 GW) and South Africa (+0.8 GW) were the newcomers of 2014. South Africa entered the top 10 in added capacity rankings for the first time. There are now twenty countries around the world with a cumulative PV capacity of more than one gigawatt (see bar-chart below). Thailand (1,299 MW), The Netherlands (1,123 MW), and Switzerland (1,076 MW), all crossed the gigawatt threshold in 2014. Based on IEA's data, the available solar PV capacity in Italy, Germany and Greece is now sufficient to supply between 7% and 8% of their respective domestic electricity consumption.[3]
Other mentionable PV deployments above the 100-megawatt mark included Canada (500 MW), Thailand (475 MW), The Netherlands (400 MW), Taiwan (400 MW), Italy (385 MW), Chile (1,113 MW),[18] Switzerland (320 MW), Israel (250 MW), Austria (140 MW) and Portugal (110 MW).[3] Underperforming countries were Belgium (65 MW), Bulgaria (2 MW), the Czech Republic (2 MW), Greece (16 MW), Romania (69 MW), Slovakia (0.4 MW) and Spain (22 MW), with very low to almost non-existent additions compared to previous years.
|
Forecast
Forecast for 2016
In April 2016, Mercom Capital Group, forecasted global solar installations to reach 66.7 GW with China, the United States, Japan and India to make up the top four solar markets in 2016.[20] However, in December 2016, Mercom upped their 2016 forecast to 76GW. [21]
Market research firm IHS forecast in February global installations to reach 69 GW in 2016. Meanwhile, Greentech Media has a 2016 forecast of 64 GW.[22]
Forecast for 2015
historical cumulative capacity
average projection for 2015 (+55 GW, 233 GW)
low scenario reaches 396 GW by 2019
high scenario reaches 540 GW by 2019
In June 2015, SolarPower Europe (SPE) – the former European Photovoltaic Industry Association (EPIA) – released its new report, Global Market Outlook for Solar Power 2015–2019. The European PV organization expects global installations to grow between 41 GW and 60 GW, marked by their low and high scenario, respectively.[lower-alpha 2][1]:14 A year before, the European lobby association estimated 2015 to grow by 35–53 GW.[2]:39
The International Energy Agency (IEA) will still have to update its forecast in the course of 2015. This is expected to happen on 1 October 2015, when the Medium-Term Renewable Energy Market Report 2015 will be launched on the sidelines of the G20 summit in Istanbul, Turkey.[23] In August 2014, IEA forecasted 38 GW in its baseline scenario for 2015.[24] The IEA has been criticized for systematically underestimating the growth of photovoltaics in the past.[7]
IHS Technology forecasts global solar PV installations to grow by 59 GW or 33% in 2015.[25][26] The company also predicts an accelerated growth for concentrator photovoltaics, an increase in market-share of monocrystalline silicon technology over polycrystalline silicon, currently the leading semiconductor material used for solar cells (also see section Technologies), and that solar power in California will provide more than 10 percent of the state's annual power generation, higher than in Italy and Germany.[27]
| Projections for 2015 | |
|---|---|
| IEA(a) | 38 GW |
| SPE | 51 GW |
| DB | 54 GW |
| GTM | 55 GW |
| BNEF | 55 GW |
| MC | 58 GW |
| IHS | 59 GW |
| Ø for 2015 | 55 GW |
| (a) excluded from average | |
Deutsche Bank (DB) anticipates deployment to reach about 54 GW in 2015. An increase in investments and improvement of cost competitiveness is expected, while weaker oil prices are not seen to play a significant role for the solar sector.[28] They find that grid parity has arrived in 30 countries around the world (compared to 19 markets the year before[29]), as unsubsidized rooftop solar costs $0.08–$0.13 per kilowatt-hour, and is now below the retail prices of electricity in these markets. DB also estimates current installation cost to range from $1.00/W for utility-scale systems in China to $2.90/W for U.S. residential rooftop systems.[6]
For 2015, Mercom Capital (MC) predicts global installation to amount to 57.8 GW[30] (up from 54.5 GW predicted a few months earlier[31]), while Bloomberg New Energy Finance (BNEF) foresees solar PV to add more than 55 GW. The 10 Predictions For Clean Energy In 2015 by Michael Liebreich mentions the spread of PV to more and more localities in Africa, the trend of imposing taxes on rooftop systems, and the growing confidence among investors that solar is indeed a cheap source of power.[32][33] In June 2015, Greentech Media (GTM) Research estimated global PV installations at 55 GW for 2015 and notes that this corresponds to about half of the world's newly installed electricity generating capacity.[34]
About 40 countries are expected to install more than 100 megawatts in 2015 (compared to 25 countries in 2014).[27] In the United States, installations are predicted to grow by 7.9 GW (SEIA[35]) to 9.4 GW, up by about 30–45% over the record-year of 2014.[30][36][37] Both, the United Kingdom (2.9–3.5 GW) and Japan (9–10.4 GW) are being forecasted to set new records in 2015.[30][36] After three years of decline, installations in Europe are expected to grow again to 9.4 GW, up 19% over 2014.[26][38] The Chinese government set its own 2015 solar target to 17.8 GW, much higher than its original 2014 target it ultimately missed to achieve.[11] India is expected to install more than 2 GW, a tripling over the previous year.[39] A return of deployment in the gigawatt-scale is predicted for France, and record installations of 1.1 GW are expected for Thailand, while deployment in Australia and Germany would remain unchanged.[38] Latin America is forecasted to install 2.2 GW in 2015, with a significant contribution from the Central American region for the first time, while Chile and Mexico are expected to double and triple their installations, respectively. The projected top five Latin American installers of 2015 are Chile (1 GW), Honduras (460 MW), Mexico (195 MW), Guatemala (98 MW) and Panama (62 MW).[40] Rapid growth of solar PV is also expected to occur in Jordan, Pakistan and the Philippines.[27]:11[41]
Global short-term forecast (2020)
| Forecasting company or organization | Cumulative by 2020 | To be added 2015–20207 | Ø Annual installation |
|---|---|---|---|
| IEA (baseline, 2014) | 403 GW | 225 GW | 38 GW |
| GlobalData (2014) | 414 GW | 236 GW | 39 GW |
| SPE/EPIA (low scenario, 2015)1 | 444 GW | 266 GW | 44 GW |
| Frost & Sullivan (2015) | 446 GW | 268 GW | 45 GW |
| IEA (enhanced case, 2014)2 | 490 GW | 312 GW | 52 GW |
| Grand View Research (2015) | 490 GW | 312 GW | 52 GW |
| Citigroup (CitiResearch, 2013) | 500 GW | 322 GW | 54 GW |
| PVMA (medium scenario, 2015)3 | 536 GW | 358 GW | 60 GW |
| IHS (10.5% CAGR, 2015)4 | 566 GW | 388 GW | 65 GW |
| BNEF (New Energy Outlook 2015)5 | 589 GW | 411 GW | 69 GW |
| SPE/EPIA (high scenario, 2015)1 | 630 GW | 452 GW | 75 GW |
| Fraunhofer (17% CAGR, 2015)6 | 668 GW | 490 GW | 82 GW |
| GTM Research (June, 2015) | 696 GW | 518 GW | 86 GW |
| List ordered by ascending estimated capacities and publication date 1 SPE – extrapolated 2019-projection (396 GW and 540 GW, resp.) [1]:15 2 IEA – arithmetic mean of 465–515 GW [24] 3 PVMA – average of scenarios (444–630 GW), read from diagram [42] 4 IHS – extrapolated 2019-estimate, based on a CAGR of 10.5% [36][43] 5 BNEF – figures may include contribution from CSP [33] 6 FSH – external expert scenario based on a CAGR of 17% [44]:19,25 7 Difference to global cumulative as of the end of 2014 (178 GW) [1]:5 | |||
There are a number of short and medium term forecasts published by several organizations and market research companies. In addition, the International Energy Agency (IEA) and Solar Power Europe (SPE, the former EPIA) produce more than one scenario each. The summary table shows the different forecasts for global PV capacity by 2020. Projections are listed by ascending cumulative capacity. The table also shows the capacity that has to be installed from 2015–2020 and the average annual installation required to meet the projection. Conservative scenarios forecast capacity to reach 400 or more gigawatts, assuming declining annual installations from current levels, while more optimistic scenarios project cumulative capacity to grow beyond 500 GW. Only the most optimistic projections around 600 GW foresee annual installations to grow above 10 percent (p.a) in the near future.
The European Photovoltaic Industry Association expects the fastest PV growth to continue in China, South-East Asia, Latin America, the Middle-East, North Africa, and India. By 2019, worldwide capacity is projected to reach between 396 GW (low scenario) and 540 GW (high scenario). This corresponds to a more than doubling and tripling of installed capacity within five years, respectively.[1]:15
Consulting firm Frost & Sullivan projects global PV capacity to increase to 446 GW by 2020, with China, India and North America being the fastest growing regions, while Europe is expected to double its solar capacity from current levels.[45] Grand View Research, a market research and consulting firm, headquartered in San Francisco, published its solar PV forecast report in March 2015. The large PV potential in countries such as Brazil, Chile and Saudi Arabia has not expanded as expected and is supposed to be explored over the next six years. In addition, China's increase of manufacturing capacity is expected to further lowering global market prices. The consulting firm projects worldwide cumulative deployment to reach about 490 GW by 2020.[46]
The PV Market Alliance (PVMA), a recently founded consortium of several research bodies, sees global PV capacity to reach 444–630 GW by 2020. In its low scenario, annual installations are projected to grow from 40 to 50 gigawatts by the end of the decade, while its high scenario forecasts deployment to increase from 60 to 90 GW during the next five years. The medium scenario therefore expects annual PV installations to grow from 50 GW to 70 GW and to reach 536 GW by 2020.[42][47] PVMA's figures are in line with those published earlier by Solar Power Europe. In June 2015, Greentech Media (GTM) Research released its Global PV Demand Outlook for 2020. The company projects annual installations to increase from 40 GW to 135 GW and global cumulative capacity to reach almost 700 GW by 2020. GTM's outlook is the most aggressive of all forecasts to date, with projected deployment of 518 GW between 2015 and 2020, or more than twice as much as IEA's 225 GW baseline case scenario, published ten months earlier.[48]
| Year | 2013-edition | Diff | 2014-edition | 2015-edition |
|---|---|---|---|---|
| 2013 | 30 GW | +9 | 39 GW | - |
| 2014 | 30 GW | +9 | 39 GW | 39 GW |
| 2015 | 33 GW | +5 | 38 GW | 42 GW |
| 2016 | 36 GW | +3 | 39 GW | 42 GW |
| 2017 | 38 GW | -2 | 36 GW | 39 GW |
| 2018 | 40 GW | -3 | 37 GW | 41 GW |
| 2019 | n.a. | n.a. | 38 GW | 43 GW |
| 2020 | n.a. | n.a. | 39 GW | 45 GW |
| Source: IEA Medium Term Renewable Energy Market data from 2013-edition,[49] 2014-edition[24] and 2015-edition[50] | ||||
The International Energy Agency (IEA) sees overall stagnating annual installations in the range of 36–39 GW until 2020, when global capacity will reach 403 GW, according to the highlighted baseline case scenario of the Medium Term Renewable Energy Market 2014 report.[24][51] Paradoxically, since the report's 2013-edition, projected cumulative for 2018 has increased by 6% from 308 GW to 326 GW, while the corresponding annual deployment decreased.[49] This is due to the fact that the International Energy Agency adjusted annual installations upward on the near-end – in order to meet actual deployment, while reducing estimates on the far-end. The result is a flat curve that stays below 40 GW until 2020 (see table). For 2017, the projected low of 36 GW concurs with the scheduled expiration of the solar investment tax credit (ITC) in the U.S. and the expected end of the solar boom in Japan. IEA's projected annual installation of less than 40 GW also leads to a negative growth rate, since expectations for 2015 are much higher (see Forecast for 2015). Such a decline, however, is unprecedented and has never been observed in the recorded history of solar PV deployment. This scenario makes IEA's baseline case the most conservative of all projections. In the less featured enhanced high case scenario, IEA estimates that "solar PV could reach a cumulative 465 GW to 515 GW in 2020"[24]:8 and that "solar PV capacity could top 500 GW globally in 2020".[51]
By 2020, IEA's Technology Roadmap: Solar Photovoltaic Energy report expects China to account for over 110 GW of solar PV, while Japan and Germany would each reach around 50 GW. The United States would rank fourth at over 40 GW, followed by Italy and India with 25 GW and 15 GW. The United Kingdom, France and Australia, would have installed capacities of close to 10 GW each.[15]:17 IEA released this outlook in September 2014 (see section below for more detail on the report). Two months later, however, India announced its intention to install 100 GW of solar PV by 2022, and another six months later, SEIA forecasted that the United States would reach 40 GW of cumulative PV capacity already by the end of 2016.[52][53] Furthermore, in July 2015, the UK was forecast to reach 10 GW by early 2016.[54] IEA will release its next roadmap report on solar PV in 2018.
Global long-term forecast (2050)
In 2014, the International Energy Agency (IEA) released its latest edition of the Technology Roadmap: Solar Photovoltaic Energy report,[15] calling for clear, credible and consistent signals from policy makers.[55] The IEA also acknowledged to have previously underestimated PV deployment and reassessed its short-term and long-term goals.
IEA report Technology Roadmap: Solar Photovoltaic Energy (September 2014)[15]:1 —
- Much has happened since our 2010 IEA technology roadmap for PV energy. PV has been deployed faster than anticipated and by 2020 will probably reach twice the level previously expected. Rapid deployment and falling costs have each been driving the other. This progress, together with other important changes in the energy landscape, notably concerning the status and progress of nuclear power and CCS, have led the IEA to reassess the role of solar PV in mitigating climate change. This updated roadmap envisions PV's share of global electricity rising up to 16% by 2050, compared with 11% in the 2010 roadmap.
IEA's long-term scenario for 2050 describes worldwide solar photovoltaics (PV) and concentrated solar thermal (CSP) capacity to reach 4,600 GW and 1,000 GW, respectively. In order to achieve IEA's projection, PV deployment of 124 GW and investments of $225 billion are required annually. This is about three and two times of current levels, respectively. By 2050, levelized cost of electricity (LCOE) generated by solar PV would cost between US 4¢ and 16¢ per kilowatt-hour (kWh), or by segment and on average, 5.6¢ per kWh for utility-scale power plants (range of 4¢ to 9.7¢), and 7.8¢ per kWh for solar rooftop systems (range of 4.9¢ to 15.9¢)[15]:5,24 These estimates are based on a weighted average cost of capital (WACC) of 8%. The report notes that when the WACC exceeds 9%, over half the LCOE of PV is made of financial expenditures, and that more optimistic assumptions of a lower WACC would therefore significantly reduce the LCOE of solar PV in the future.[15]:24–25 The IEA also emphasizes that these new figures are not projections but rather scenarios they believe would occur if underlying economic, regulatory and political conditions played out.
In 2015, Fraunhofer ISE did a study commissioned by German renewable think tank Agora Energiewende and concluded that most scenarios fundamentally underestimate the role of solar power in future energy systems.[56] Fraunhofer's study (see summary of its conclusions below) differs significantly form IEA's roadmap report on solar PV technology despite being published only a few months apart. The report foresees worldwide installed PV capacity to reach as much as 30,700 GW by 2050. By then, Fraunhofer expects LCOE for utility-scale solar farms to reach €0.02 to €0.04 per kilowatt-hour, or about half of what the International Energy Agency has been projecting (4¢ to 9.7¢). Turnkey system costs would decrease by more than 50% to €436/kWp from currently €995/kWp.[44]:67 This is also noteworthy, as IEA's roadmap published significantly higher estimates of $1,400 to $3,300 per kWp for eight major markets around the world (see table Typical PV system prices in 2013 below).[15]:15 However, the study agrees with IEA's roadmap report by emphasizing the importance of the cost of capital (WACC), which strongly depends on regulatory regimes and may even outweigh local advantages of higher solar insolation.[44]:1, 53 In the study, a WACC of 5%, 7.5% and 10% is used to calculate the projected levelized cost of electricity for utility-scale solar PV in 18 different markets worldwide.[44]:65
Fraunhofer ISE: Current and Future Cost of Photovoltaics. Long-term Scenarios for Market Development, System Prices and LCOE of Utility-Scale PV Systems. Study on behalf of Agora Energiewende (February 2015)[44]:1 —
- Solar photovoltaics is already today a low-cost renewable energy technology. Cost of power from large scale photovoltaic installations in Germany fell from over 40 ct/kWh in 2005 to 9 cts/kWh in 2014. Even lower prices have been reported in sunnier regions of the world, since a major share of cost components is traded on global markets.
- Solar power will soon be the cheapest form of electricity in many regions of the world. Even in conservative scenarios and assuming no major technological breakthroughs, an end to cost reduction is not in sight. Depending on annual sunshine, power cost of 4–6 cts/kWh are expected by 2025, reaching 2–4 ct/kWh by 2050 (conservative estimate).
- Financial and regulatory environments will be key to reducing cost in the future. Cost of hardware sourced from global markets will decrease irrespective of local conditions. However, inadequate regulatory regimes may increase cost of power by up to 50 percent through higher cost of finance. This may even overcompensate the effect of better local solar resources.
- Most scenarios fundamentally underestimate the role of solar power in future energy systems. Based on outdated cost estimates, most scenarios modeling future domestic, regional or global power systems foresee only a small contribution of solar power. The results of our analysis indicate that a fundamental review of cost-optimal power system pathways is necessary.
Regional forecasts

- In October 2015, China's National Energy Administration (NDRC) set an ambitious 23.1 GW target for 2015, upgrading its previous target of 17.8 GW from March 2015, which was already more than the entire global PV capacity installed in 2010.[11][57] With this revised target, China will have surpassed Germany's total capacity of 40 GW by the end of the year and become the world's largest overall producer of photovoltaic power.
- As of October 2015, China plans to install 150 GW of solar power by 2020,[58] an increase of 50 GW compared to the 2020-target announced in October 2014, when China planned to install 100 GW of solar power—along with 200 GW of wind, 350 GW of hydro and 58 GW of nuclear power.[59]
- Overall, China has consistently increased its annual and short term targets. However estimates, targets and actual deployment have differed substantially in the past: in 2013 and 2014, China was expected to continue to install 10 GW per year.[2]:37 In February 2014, China's NDRC upgraded its 2014 target from 10 GW to 14 GW[60] (later adjusted to 13 GW[61]) and ended up installing an estimated 10.6 GW due to shortcomings in the distributed PV sector.[62]
- By 2016, India plans to have constructed the world’s largest solar farm with a capacity of 750 MW. The country plans to install 100 GW capacity of solar power by 2022, a five-time increase from a previous target.[63] However, India's solar PV deployment was below expectation and actually declined from 1,115 MW in 2013 to 616 MW in 2014, which contrasts with the country’s positive policy tone towards solar PV. In 2015, record installations are 3018 MW against expectation of 2 GW.[39] As of July 13, 2015, total commissioned capacity in India surpassed 4 GW and stands at 4,096 MW, with the state Rajasthan and Gujarat taking the lead with 1,164 MW and 1,000 MW, respectively.[64]
- For 2014, installations in Japan reached an all time record level of 9.7 GW, compared to 6.9 GW in 2013. By the end of 2014, Japan's installed PV capacity of 23.3 GW can now contribute about 2.5% to the overall domestic electricity demand.[3]:13 In 2014, Japan also overtook Italy (18.5 GW) as the world's third largest PV nation in terms of cumulative capacity. IHS forecasts that Japan will retain its position as the world's second largest solar market for new installations and grow by 4%, adding another 10.4 GW in 2015.[36]
- In March 2015, SEIA, the Solar Energy Industries Association and GTM Research, released their U.S. estimate for 2014. In the United States, a total of 6.2 gigawatts had been installed, up 30 percent over 2013 (vs. previous projection of 6.5 GW in September 2014). This brings the country’s cumulative PV total to 18.3 GW. However, according to IHS, U.S. deployment amounted to 7 GW in 2014, or 800 MW higher than SEIA reported.[36] In June 2014 Barclays downgraded bonds of U.S. utility companies. Barclays expects more competition by a growing self-consumption due to a combination of decentralized PV-systems and residential electricity storage. This could fundamentally change the utility's business model and transform the system over the next ten years, as prices for these systems are predicted to fall.[65] For 2015, annual PV installations are predicted to increase to 8.1 GW (cumulative of 26.4 GW) by the end of the year.[37] Other sources see U.S. deployment to increase by approximately 9 GW in 2015, before peaking in 2016.[30][36] In May 2015, SEIA predicted U.S. PV-market to grow by 25% to 50% in 2016, with a cumulative PV capactiy of 40 GW by the end of 2016. Roughly, this translates into 13 GW of added capacity in 2016.[53]

<0.1, n/a | 0.1–1 | 1–10 | 10–50 | 50–100 |
100–150 | 150–200 | 200–300 | 300–450 | >450 |
- By 2020, the European Photovoltaic Industry Association (EPIA) expects PV capacity to pass 150 GW. It finds the EC-supervised national action plans for renewables (NREAP) turned out to be too conservative, as the goal of 84 GW of solar PV by 2020 had already been surpassed in 2014 (prelim. figures account for close to 88 GW by the end of 2014).[3] For 2030, EPIA originally predicted solar PV to reach between 330 and 500 GW, supplying 10 to 15 percent of Europe's electricity demand. However, recent reassessments are more pessimistic and point to a 7 to 11 percent share, if no major policy changes are undertaken.[2]:35
- In 2014, overall European markets continued to decline despite strong growth in some countries. These countries, with their percentage-increase of total capacity, were, the United Kingdom (+80%), the Netherlands (+54%), Switzerland (+42%), Austria (+22%) and France (+20%), which rebounced significantly in terms of annual installations from 643 MW in 2013 to 927 MW in 2014. In most countries, however, deployment underperformed or, in some cases, growth of cumulative capacity even fell below the one percent mark. In descending percentage-order, cumulative installations only grew by 6.0% in Romania (69 MW), 5.2% in Germany (1,900 MW), 2.1% in Italy (385 MW), 2.1% in Belgium (65 MW), 0.4% in Spain (22 MW), 0.2% in Bulgaria (1.6 MW), 0.08% in Slovakia (0.4 MW), 0.06% in Greece (16 MW), and 0.01% in the Czech Republic (1.7 MW).[3]:15
- The United Kingdom had the strongest percentage growth and became the fourth largest PV installer worldwide after China, Japan and the United States. In 2014, the country installed more than 2.2 GW (vs. 1.1 GW in 2013) and cumulative installation increased by 80% to 5.1 GW by the end of the year.[66] The booming utility-scale installations were partially explained by the upcoming closure of the appealing renewable obligation certificates (ROC) scheme in March 2015.[61] This may also bring another record deployment in 2015, as IHS forecasts 3.5 GW of installations for the year.[36]
- In Germany and Italy, the rate of new installations continued to decline in 2014 and is expected to remain unchanged or even decline to 1.3 GW for 2015.[30] In 2014, Germany installed 1,926 MW, down 36 percent from 3,300 MW deployed in 2013. During the period of 2010–2012, the country was the world's leader installing more than 7 GW annually. New cumulative capacity of 38.2 GW corresponds to 475 watts per inhabitant. Italy installed 385 MW,[67] much less than previously expected and down from 1.5 GW deployed in 2013. Overall capacity of 18.5 GW translates into 304 watts per inhabitant. Solar PV now contributes significantly to domestic net-electricity consumption in Italy (7.9%), Greece (7.6%) and Germany (7.0%).[3]:15
History of leading countries
Since the 1950s, when the first solar cells were commercially manufactured, there has been a succession of countries leading the world as the largest producer of electricity from solar photovoltaics. First it was the United States, then Japan, followed by Germany, and currently China.
United States (1954–1996)
The United States, inventor of modern solar PV, was the leader of installed capacity for many years. Based on preceding work by Swedish and German engineers, the American engineer Russell Ohl at Bell Labs patented the first modern solar cell in 1946.[68][69] It was also there at Bell Labs where the first practical c-silicon cell was developed in 1954.[70][71] Hoffman Electronics, the leading manufacturer of silicon solar cells in the 1950s and 1960s, improved on the cell's efficiency, produced solar radios, and equipped Vanguard I, the first solar powered satellite launched into orbit in 1958.
UK USA Japan China Italy Germany
In 1977 US-President Jimmy Carter installed solar hot water panels on the White House promoting solar energy[72] and the National Renewable Energy Laboratory, originally named Solar Energy Research Institute was established at Golden, Colorado. In the 1980s and early 1990s, most photovoltaic modules were used in stand-alone power systems or powered consumer products such as watches, calculators and toys, but from around 1995, industry efforts have focused increasingly on developing grid-connected rooftop PV systems and power stations. By 1996, solar PV capacity in the US amounted to 77 megawatts–more than any other country in the world at the time. Then, Japan stayed ahead.
Japan (1997–2004)
Japan took the lead as the world's largest producer of PV electricity, after the city of Kobe was hit by the Great Hanshin earthquake in 1995. Kobe experienced severe power outages in the aftermath of the earthquake, and PV systems were then considered as a temporary supplier of power during such events, as the disruption of the electric grid paralyzed the entire infrastructure, including gas stations that depended on electricity to pump gasoline. Moreover, in December of that same year, an accident occurred at the multibillion-dollar experimental Monju Nuclear Power Plant. A sodium leak caused a major fire and forced a shutdown (classified as INES 1). There was massive public outrage when it was revealed that the semigovernmental agency in charge of Monju had tried to cover up the extent of the accident and resulting damage.[73][74] Japan remained world leader in photovoltaics until 2004, when its capacity amounted to 1,132 megawatts. Then, focus on PV deployment shifted to Europe.
Germany (2005–2014)
In 2005, Germany took the lead from Japan. With the introduction of the Renewable Energy Act in 2000, feed-in tariffs were adopted as a policy mechanism. This policy established that renewables have priority on the grid, and that a fixed price must be paid for the produced electricity over a 20-year period, providing a guaranteed return on investment irrespective of actual market prices. As a consequence, a high level of investment security lead to a soaring number of new photovoltaic installations that peaked in 2011, while investment costs in renewable technologies were brought down considerably. Germany's installed PV capacity is now approaching the 40,000 megawatt mark.
China (2015–present)
China surpassed Germany's capacity by the end of 2015, becoming the world's largest producer of photovoltaic power.[75] China's rapid PV growth is expected to continue.
History of market development
Prices and costs (1977–present)


| Type of cell or module | Price per watt |
|---|---|
| High efficiency multi-Si cell (>17.8%) | $0.325 |
| Taiwanese multi-Si cell | $0.322 |
| Chinese multi-Si cell | $0.294 |
| Mono-Si cell | $0.335 |
| Module (multi-Si) | $0.532 |
| Module (mono-Si) | $0.595 |
| Source: EnergyTrend, price quotes, average prices, 2015 [76] | |
The average price per watt has dropped drastically for solar cells over the last few decades. While in 1977 prices for crystalline silicon cells were about $77 per watt, average spot prices in June 2014 were as low as $0.36 per watt or 200 times less than almost forty years ago. Prices for thin-film solar cells and for c-Si solar panels were around $.60 per watt.[77] In 2015, module and cell prices declined even further (see price quotes in table).
This price trend is seen as evidence supporting Swanson's law, an observation similar to the famous Moore's Law that states that the per-watt cost of solar cells and panels fall by 20 percent for every doubling of cumulative photovoltaic production.[78] A 2015 study shows price/kWh dropping by 10% per year since 1980, and predicts that solar could contribute 20% of total electricity consumption by 2030.[79]
In its 2014 edition of the Technology Roadmap: Solar Photovoltaic Energy report, the International Energy Agency (IEA) published prices for residential, commercial and utility-scale PV systems for eight major markets as of 2013 (see table below).[15] However, IEA's figures for the U.S seem to be controversial, as DOE's SunShot Initiative report states lower prices, although being published at the same time and referring to the same period. Prices have since fallen further. For 2014, the SunShot Initiative modeled U.S. system prices to be in the range of $1.80 to $3.29 per watt.[80] Other sources identify similar price ranges of $1.70 to $3.50 for the different market segments in the U.S.,[81] and in the highly penetrated German market, prices for residential and small commercial rooftop systems of up to 100 kW declined to $1.36 per watt (€1.24/W) by the end of 2014.[82] In 2015, Deutsche Bank estimated costs for small residential rooftop systems in the U.S. around $2.90 per watt. Costs for utility-scale systems in China and India were estimated as low as $1.00 per watt.[6]:9 As of mid-2015, a residential 5 kW-system in Australia costs on average about AU$1.60, or US$1.23 per watt.[83]
| USD/W | Australia | China | France | Germany | Italy | Japan | United Kingdom | United States |
|---|---|---|---|---|---|---|---|---|
| Residential | 1.8 | 1.5 | 4.1 | 2.4 | 2.8 | 4.2 | 2.8 | 4.91 |
| Commercial | 1.7 | 1.4 | 2.7 | 1.8 | 1.9 | 3.6 | 2.4 | 4.51 |
| Utility-scale | 2.0 | 1.4 | 2.2 | 1.4 | 1.5 | 2.9 | 1.9 | 3.31 |
| Source: IEA – Technology Roadmap: Solar Photovoltaic Energy report, September 2014'[15]:15 1U.S figures are lower in DOE's Photovoltaic System Pricing Trends[80] | ||||||||
Technologies (1990–present)
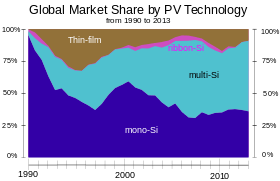
With the advances in conventional crystalline silicon (c-Si) technology in recent years, and the falling cost of the polysilicon since 2009, that followed after a period of severe shortage (see below) of silicon feedstock, pressure increased on manufacturers of commercial thin-film PV technologies, including amorphous thin-film silicon (a-Si), cadmium telluride (CdTe), and copper indium gallium diselenide (CIGS), leading to the bankruptcy of several, once highly touted thin-film companies.[84] The sector continues to face price competition from Chinese crystalline silicon cell and module manufacturers, and some companies together with their patents were sold below cost.[85]
In 2013 thin-film technologies accounted for about 9 percent of worldwide deployment, while 91 percent was held by crystalline silicon (mono-Si and multi-Si). With 5 percent of the overall market, CdTe holds more than half of the thin-film market, leaving 2 percent to each, CIGS and amorphous silicon.[87]:24–25
- Copper indium gallium selenide (CIGS) is the name of the semiconductor material the technology is based on. One of the largest producers of CIGS photovoltaics is the Japanese company Solar Frontier with a manufacturing capacity in the gigawatt-scale. The latest CIS line technology includes modules with conversion efficiencies of over 15%.[88] The company profits from the booming Japanese market and attempts to widen its international business. However, several prominent manufacturers couldn't stand the pressure caused by advances in conventional crystalline silicon technology of recent years. The company Solyndra ceased all business activity and filed for Chapter 11 bankruptcy in 2011, and Nanosolar, also a CIGS manufacturer, closed its doors in 2013. Although both companies produced CIGS solar cells, it has been pointed out, that the failure was not due to the technology but rather because of the companies themselves, using a flawed architecture, such as, for example, Solyndra's cylindrical substrates.[89]
- The U.S.-company First Solar, a leading manufacturer of CdTe, has been building several of the world's largest solar power stations, such as the Desert Sunlight Solar Farm and Topaz Solar Farm, both in the Californian desert with a staggering 550 MW capacity each, as well as the 102 MWAC Nyngan Solar Plant in Australia, the largest PV power station in the Southern Hemnisphere, commissioned in mid-2015.[90] The company successfully produces CdTe-panels with a steadily increasing efficiency and declining cost per watt, as reported in 2013.[91]:18–19 CdTe has the lowest energy payback time of all mass-produced PV technologies, and can be as short as eight months in favorable locations.[87]:31 The company Abound Solar, also a manufacturer of cadmium telluride modules, went bankrupt in 2012.[92]
- In 2012, ECD solar, once one of the world's leading manufacturer of amorphous silicon (a-Si) technology, filed for bankruptcy in Michigan, United States. Swiss OC Oerlikon divested its solar division that produced a-Si/μc-Si tandem cells to Tokyo Electron Limited.[93][94] In 2014, the Japanese electronics and semiconductor company announced the closure of its micromorph technology development program.[95] Other companies that left the amorphous silicon thin-film market include DuPont, BP, Flexcell, Inventux, Pramac, Schuco, Sencera, EPV Solar,[96] NovaSolar (formerly OptiSolar)[97] and Suntech Power that stopped manufacturing a-Si modules in 2010 to focus on crystalline silicon solar panels. In 2013, Suntech filed for bankruptcy in China.[98][99]
Silicon shortage (2005–2008)

In the early 2000s, prices for polysilicon, the raw material for conventional solar cells, were as low as $30 per kilogram and silicon manufacturers had initially no incentive to expand production by additional investments.
However, a severe silicon shortage came along in 2005, when governmental programmes sparked the deployment of solar PV to rise by 75% in Europe. In addition, the demand for silicon from semiconductor manufacturers was growing as well. Since the amount of silicon needed for semiconductors makes up a much smaller portion of production costs, manufacturers were able to outbid solar companies for the available silicon in the market.[100]
Initially, the incumbent polysilicon producers were slow to respond to rising demand for solar applications, because of their painful experiences with over-investment in the past. Silicon prices sharply rose to about $80 per kilogram, and reached as much as $400/kg for long-term contracts and spot prices. In 2007, the constraints on silicon became so severe that the solar industry was forced to idle about a quarter of its cell and module manufacturing capacity—an estimated 777 MW of the then available production capacity. The shortage also provided silicon specialists with both the cash and an incentive to develop new technologies and several new producers entered the market. Early responses from the solar industry focused on improvements in the recycling of silicon. When this potential was exhausted, companies have been taking a harder look at alternatives to the conventional Siemens process.[101]
As it takes about three years to build a new polysilicon plant, the shortage prolonged until 2008. Prices for conventional solar cells remained constant or even rose slightly during the period of silicon shortage from 2005 to 2008. This is notably seen as a "shoulder" that sticks out in the Swanson's PV-learning curve and it was feared that a prolonged shortage could delay solar power to become competitive with conventional energy prices without subsidies.
In the meantime the solar industry lowered the number of grams-per-watt by reducing wafer thickness and kerf loss, increased yields in all manufacturing steps, reducing module loss, and continuously raised panel efficiency. Finally, the ramp up of polysilicon production alleviated worldwide markets from the scarcity of silicon in 2009 and subsequently lead to an overcapacity with sharply declining prices in the photovoltaic industry for the following years.
Solar overcapacity (2009–2013)
As the polysilicon industry had started to build additional large production capacities during the shortage period, prices dropped as low as $15 per kilogram forcing some producers to suspend production or exit the sector. Since then, prices for silicon have stabilized around $20 per kilogram and the booming solar PV market has also helped to reduce the enormous global overcapacity since 2009. However, overcapacity in the PV industry continues to persist. In 2013, global record deployment of 38 GW (updated EPIA figure[2]) was still much lower than China's annual production capacity of approximately 60 GW. Continued overcapacity was further reduced by significantly lowering solar module prices and, as a consequence, many manufacturers could no longer cover costs or remain competitive. As worldwide growth of PV deployment continues and will likely break another record in 2014, the gap between overcapacity and global demand is expected to close in the next few years.[103]
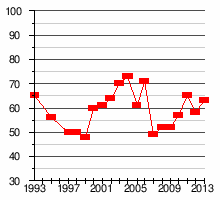
IEA-PVPS published historical data for the worldwide utilization of solar PV module production capacity that displays a slow return to normalization in manufacture in recent years. The utilization rate is the ratio of production capacities versus actual production output for a given year. A low of 49% was reached in 2007 and reflects the peak of the silicon shortage that idled a significant share of the module production capacity. As of 2013, the utilization rate had recovered somewhat and increased to 63%.[102]:47
Anti-dumping duties (2012–present)
After anti-dumping petition were filed and investigations carried out,[104] the United States imposed tariffs of 31 percent to 250 percent on solar products imported from China in 2012.[105] A year later, the EU also imposed definitive anti-dumping and anti-subsidy measures on imports of solar panels from China at an average of 47.7 percent for a two-year time span.[106]
Shortly thereafter, China, in turn, levied duties on U.S. polysilicon imports, the feedstock for the production of solar cells.[107] In January 2014, the Chinese Ministry of Commerce set its anti-dumping tariff on U.S. polysilicon producers, such as Hemlock Semiconductor Corporation to 57%, while other major polysilicon producing companies, such as German Wacker Chemie and Korean OCI were much less affected.[108] All this has caused much controversy between proponents and opponents and is subject of current debate.
History of deployment
Deployment figures on a global, regional and nationwide scale are well documented since the early 1990s. While worldwide photovoltaic capacity has been growing continuously, deployment figures by country are much more dynamic, as they depend strongly on national policies. A number of organizations release comprehensive reports on PV deployment on a yearly basis. They include annual and cumulative deployed PV capacity, typically given in watt-peak, a break-down by markets, as well as in-depth analysis and forecasts about future trends.
Worldwide annual deployment
Due to the exponential nature of PV deployment, about 83 percent of the overall capacity has been installed during the last five years from 2011 to 2015 (see pie-chart; projected figure for 2015). Since the 1990s, and except for 2012, each year has been a record-breaking year in terms of newly installed PV capacity.
Worldwide cumulative
Worldwide growth of solar PV capacity has been fitting an exponential curve since 1992. Tables below show global cumulative nominal capacity by the end of each year in megawatts, and the year-to-year increase in percent. In 2014, global capacity is expected to grow by 33 percent from 138,856 to 185,000 MW. This corresponds to an exponential growth rate of 29 percent or about 2.4 years for current worldwide PV capacity to double. Exponential growth rate: P(t) = P0ert, where P0 is 139 GW, growth-rate r 0.29 (results in doubling time t of 2.4 years).
The following table contains data from four different sources. For 1992–1995: compiled figures of 16 main markets (see section All time PV installations by country). For 1996–1999: BP-Statistical Review of world energy (Historical Data Workbook)[109] for 2000–2013: EPIA Global Outlook on Photovoltaics Report[2]:17 and for 2014, preliminary figures are based on IEA-PVPS' snapshot report[3]
| Year | CapacityA MWp |
Δ%B | Refs |
|---|---|---|---|
| 1991 | n.a. | – | C |
| 1992 | 105 | n.a. | C |
| 1993 | 130 | 24% | C |
| 1994 | 158 | 22% | C |
| 1995 | 192 | 22% | C |
| 1996 | 309 | 61% | [109] |
| 1997 | 422 | 37% | [109] |
| 1998 | 566 | 34% | [109] |
| 1999 | 807 | 43% | [109] |
| 2000 | 1,250 | 55% | [109] |
| Year | CapacityA MWp |
Δ%B | Refs |
|---|---|---|---|
| 2001 | 1,615 | 27% | [2] |
| 2002 | 2,069 | 28% | [2] |
| 2003 | 2,635 | 27% | [2] |
| 2004 | 3,723 | 41% | [2] |
| 2005 | 5,112 | 37% | [2] |
| 2006 | 6,660 | 30% | [2] |
| 2007 | 9,183 | 38% | [2] |
| 2008 | 15,844 | 73% | [2] |
| 2009 | 23,185 | 46% | [2] |
| 2010 | 40,336 | 74% | [2] |
| Year | CapacityA MWp |
Δ%B | Refs |
|---|---|---|---|
| 2011 | 70,469 | 75% | [2] |
| 2012 | 100,504 | 43% | [2] |
| 2013 | 138,856 | 38% | [2] |
| 2014 | 178,391 | 28% | [1] |
| 2015 | 229,300 | 29% | [110] |
| 2016 | |||
| 2017 | |||
| 2018 | |||
| 2019 | |||
| 2020 |
Deployment reports
Most PV deployment figures in this article are provided by the European Photovoltaic Industry Association in the "Global Outlook for Photovoltaics" report, the Observatoire des énergies renouvelables or EurObserv'ER's "Photovoltaic Barometer" report, and the IEA-PVPS (photovoltaic power systems) "Snapshot" and "Trends" report.
|
<0.1, n/a
0.1–1
1–10
10–50 |
50–100
100–150
150–200
200–300 |
300–450
>450 |
- 2014 – Global Market Outlook for Photovoltaics 2014–2018[2]
- 2013 – Global Market Outlook for Photovoltaics 2013–2017[111]
- 2012 – Global Market Outlook for Photovoltaics until 2016[112]
- 2011 – Global Market Outlook for Photovoltaics until 2015[113]
- 2010 – Global Market Outlook for Photovoltaics until 2014[114]
- 2009 – Global Market Outlook for Photovoltaics until 2013[115]
- 2008 – Global Market Outlook for Photovoltaics until 2012[116]
- The European Photovoltaic Industry Association (EPIA) represents members of the entire PV industry from silicon producers to cells and module manufactures and PV systems installers to PV electricity generation as well as marketing and sales. EPIA releases its annual Global Market Outlook for Photovoltaics report in May/June.
- PV-Barometer
- EUROBSER'VER (Observatoire des énergies renouvelables) was set up in 1980, and is composed of engineers and experts releasing the Photovoltaic Barometer report containing early, year-end PV deployment figures for the 28 member states of the European Union.[123] Eurobserver works closely together with several French ministries and is co-founded by the European Commission's IEE programm.[124]
- 2015 – Snapshot of Global PV 1992-2014[3]
- 2014 – Trends 2014 in Photovoltaic Applications – Survey report of selected IEA countries between 1992 and 2013[102]
- 2014 – Snapshot of Global PV 1992-2013[16]
- 2014 – Trends 2013 in Photovoltaic Applications – Survey report of selected IEA countries between 1992 and 2012[125]
- 2013 – Snapshot of Global PV 1992-2012[126]
- 2011 – Trends in Photovoltaic Applications – Survey report of selected IEA countries between 1992 and 2010[127]
- 2010 – Trends in Photovoltaic Applications – Survey report of selected IEA countries between 1992 and 2009[128]
- 2009 – Trends in Photovoltaic Applications – Survey report of selected IEA countries between 1992 and 2008[129]
- 2007 – Trends in Photovoltaic Applications – Survey report of selected IEA countries between 1992 and 2006[130]
- The IEA Photovoltaic Power Systems Programme (PVPS) is one of the collaborative R&D agreements established within the IEA and, since its establishment in 1993, the PVPS participants have been conducting a variety of joint projects in the application of photovoltaic conversion of solar energy into electricity. Its annual "Snapshot" report is released in early April and provides the first and detailed figures of worldwide PV-deployment of the previous year. An overview of all international statistics PDF reports since 1995 can be found on IEA-PVPS' Statistic Reports website.
Deployment by country
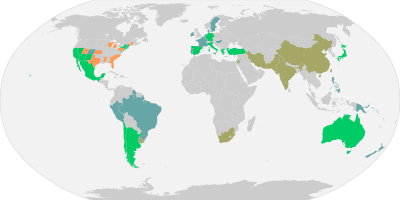
Reached grid-parity before 2014
Reached grid-parity after 2014
Reached grid-parity only for peak prices
U.S. states poised to reach grid-parity
Source: Deutsche Bank, as of February 2015
2015 


2014 


2013 


2012 


2011 

2010 .svg.png)


2009 
2008 

2004 

2013 2011 2010
- 2015
- See section Forecast for projected photovoltaic deployment in 2015
- 2014
- Also see section Current status
| Country | Capacity 2014 |
Added 2014 |
Source(a) |
|---|---|---|---|
| |
4,136 | 910 | IEA-PVPS snapshot |
| |
767 | 140 | EPIA-GMO |
| |
3,115 | 75 | IEA-PVPS AR2014 |
| |
n.a. | 22 | [40] |
| |
1,022 | 2 | IEA-PVPS snapshot |
| |
1,710 | 500 | IEA-PVPS snapshot |
| |
368 | 365 | IEA-PVPS snapshot |
| |
28,050 | 10,640 | IEA-PVPS AR2014 |
| |
33 | 13 | EPIA-GMO |
| |
65 | 30 | PV Barometer |
| |
2,134 | 2 | IEA-PVPS snapshot |
| |
608 | 47 | EPIA-GMO |
| |
10 | – | PV Barometer |
| |
5,632 | 927 | EPIA-GMO |
| |
38,235 | 1,898 | EPIA-GMO |
| |
2,596 | 17 | EPIA-GMO |
| |
n.a. | 6 | [40] |
| |
n.a. | 5 | [40] |
| |
38 | 3 | PV Barometer |
| |
2,936 | 616 | IEA-PVPS snapshot |
| |
1 | 0.1 | PV Barometer |
| 731 | 250 | IEA-PVPS snapshot | |
| |
18,313 | 385 | EPIA-GMO |
| |
23,300 | 9,700 | IEA-PVPS snapshot |
| |
2 | – | PV Barometer |
| |
68 | – | PV Barometer |
| |
110 | 15 | PV Barometer |
| |
160 | 87 | IEA-PVPS snapshot |
| |
54 | 26 | PV Barometer |
| |
176 | 64 | IEA-PVPS snapshot |
| |
1,042 | 400 | EPIA-GMO |
| |
13 | 2 | IEA-PVPS snapshot |
| |
n.a. | n.a. | not yet avail. |
| |
34 | 27 | EPIA-GMO |
| |
414 | 115 | EPIA-GMO |
| |
1,223 | 72 | EPIA-GMO |
| |
n.a. | n.a. | not yet avail. |
| |
524 | 0.4 | EPIA-GMO |
| |
256 | 8 | PV Barometer |
| |
922 | 800 | IEA-PVPS snapshot |
| |
2,384 | 909 | IEA-PVPS snapshot |
| |
5,388 | 22 | EPIA-GMO |
| |
79 | 36 | IEA-PVPS snapshot |
| |
1,046 | 320 | EPIA-GMO |
| |
776 | 400 | IEA-PVPS snapshot |
| |
1,299 | 475 | IEA-PVPS snapshot |
| |
58 | 40 | IEA-PVPS snapshot |
| |
n.a. | n.a. | not yet avail. |
| |
5,230 | 2,402 | EPIA-GMO |
| |
18,280 | 6,201 | IEA-PVPS snapshot |
(a) Data sources:
(b) Reconverted to watt-peak from MWAC[lower-alpha 5][3]:11 | |||
| Photovoltaic Barometer report – PV capacity in the European Union in 2014[117]:7–10 | |||||||||
|---|---|---|---|---|---|---|---|---|---|
| Country | Added 2014 (MW) | Total 2014 (MW) | Generation 2014 | ||||||
| off- grid |
on- grid |
Capacity | off- grid |
on- grid |
Capacity | Watt per capita |
in GWh |
in % | |
| |
– | 140.0 | 140.0 | 4.5 | 766.0 | 770.5 | 90.6 | 766.0 | – |
| – | 65.2 | 65.2 | 0.1 | 3,105.2 | 3,105.3 | 277.2 | 2,768.0 | – | |
| |
– | 1.3 | 1.3 | 0.7 | 1,019.7 | 1,020.4 | 140.8 | 1,244.5 | – |
| |
0.2 | 14.0 | 14.2 | 0.7 | 33.5 | 34.2 | 8.1 | 35.3 | – |
| |
0.2 | 29.7 | 30.0 | 1.1 | 63.6 | 64.8 | 75.5 | 104.0 | – |
| |
– | – | – | 0.4 | 2,060.6 | 2,061.0 | 196.1 | 2,121.7 | – |
| |
0.1 | 29.0 | 29.1 | 1.5 | 600.0 | 601.5 | 106.9 | 557.0 | – |
| |
– | – | – | 0.1 | – | 0.2 | 0.1 | 0.6 | – |
| |
– | – | – | 10.0 | 0.2 | 10.2 | 1.9 | 5.9 | – |
| |
0.1 | 974.9 | 975.0 | 10.8 | 5,589.0 | 4,697.6 | 87.6 | 5,500.0 | – |
| |
– | 1,899.0 | 1,899.0 | 65.0 | 38,236.0 | 38,301.0 | 474.1 | 34,930.0 | – |
| |
– | 16.9 | 16.9 | 7.0 | 2,595.8 | 2,602.8 | 236.8 | 3,856.0 | – |
| |
0.1 | 3.1 | 3.2 | 0.7 | 37.5 | 38.2 | 3.9 | 26.8 | – |
| |
0.0 | 0.0 | 0.1 | 0.9 | 0.2 | 1.1 | 0.2 | 0.7 | – |
| |
1.0 | 384.0 | 385.0 | 13.0 | 18,437.0 | 18,450.0 | 303.5 | 23,299.0 | – |
| |
– | – | – | – | 1.5 | 1.5 | 0.8 | 0.0 | – |
| |
– | – | – | 0.1 | 68.0 | 68.1 | 23.1 | 73.0 | – |
| |
– | 15.0 | 15.0 | – | 110.0 | 110.0 | 200.1 | 120.0 | – |
| |
– | 26.0 | 26.0 | – | 54.2 | 54.2 | 127.5 | 57.8 | – |
| |
– | 361.0 | 361.0 | 5.0 | 1,095.0 | 1,100.0 | 65.4 | 800.0 | – |
| |
0.5 | 19.7 | 20.2 | 2.9 | 21.5 | 24.4 | 0.6 | 19.2 | – |
| |
1.2 | 115.0 | 116.2 | 5.0 | 414.0 | 419.0 | 40.2 | 631.0 | – |
| |
– | 270.5 | 270.5 | – | 1,292.6 | 1,292.6 | 64.8 | 1,355.2 | – |
| |
– | 2.0 | 2.0 | 0.1 | 590.0 | 590.1 | 109.0 | 590.0 | – |
| |
– | 7.7 | 7.7 | 0.1 | 255.9 | 256.0 | 124.2 | 244.6 | – |
| |
0.3 | 21.0 | 21.3 | 25.5 | 4,761.8 | 4,787.3 | 102.7 | 8,211.0 | – |
| |
1.1 | 35.1 | 36.2 | 9.5 | 69.9 | 79.4 | 8.2 | 71.5 | – |
| |
– | 2,448.0 | 2,448.0 | 2.3 | 5,228.0 | 5,230.3 | 81.3 | 3,931.0 | – |
| |
4.9 | 6,878.4 | 6,883.3 | 167.1 | 86,506.8 | 86,673.9 | 171.5 | 91,319.7 | – |
| Country | off- grid |
on- grid |
Capacity | off- grid |
on- grid |
Capacity | Watt per capita |
in GWh |
in % |
| Added 2014 (MW) | Total 2014 (MW) | Generation 2014 | |||||||
- 2013
- Worldwide
In 2013, worldwide deployment of solar PV amounted to almost 40 GW (39,953 MW)—an increase of about 35 percent over the previous year. Cumulated capacity increased by 38 percent to more than 139 GW. This is sufficient to generate at least 160 terawatt-hours (TWh) or 0.85 percent of the world's total electricity consumption of 18,400 TWh.[16]:5,13[102]:9
Cumulative PV capacity by region in 2013[2]:17
| Report | Cumulative (MWp) | Installed (MWp) | Release date | Type | Ref |
|---|---|---|---|---|---|
| IEA-PVPS snapshot | >134,000 | >36,900 | April 2014 | preliminary figures | [16]:14 |
| EPIA outlook | 138,856 | 38,352 | June 2014 | detailed figures | [2]:24 |
| IEA-PVPS trends | 139,795 | 39,953 | October 2014 | final figures | [102]:34 |
- Regions
In 2013, Asia has been the fastest growing region, with China and Japan accounting for 49% of worldwide deployment. About a quarter has been installed in Europe (10,975 MW). The remaining quarter of the 38,400 MW deployed in 2013 is split between North America and other countries.
Europe is still the most developed region with a cumulative capacity of 81.5 GW, about 59 percent of the global total, followed by the Asia-Pacific region (APAC), including countries such as Japan, India and Australia with 22 GW or about 16 percent of worldwide cumulative capacity (due to its significance, China is excluded from the APAC region in all PV statistics and listed separately). European solar PV now covers 3 percent of the electricity demand and 6 percent of the peak electricity demand. However, deployment in Europe has slowed down by half compared to the record year of 2011, and will most likely continue to decrease. This is mainly due to the strong decline of new installations in Germany and Italy.[2]:18
Cumulative capacity in the MEA (Middle East and Africa) region and ROW (rest of the world) accounted for less than 3 GW or about 2.2% of the global total. A great untapped potential remains for many of these countries, especially in the Sunbelt.[2]:19,23
- Countries
Added PV capacity by country in 2013[102]:33–34[lower-alpha 6]
In 2013, the world's top installer were China (+12.92 GW), followed by Japan (+6.97 GW) and the United States (+4.75 GW), while Germany remained the world's largest overall producer of power from solar PV, with a total capacity around 36 GW and contributing 5.7% to its net electricity consumption. Italy met more than 7% of its electricity demands with solar PV, thus leading the world in that respect.
|
| |||||||||||||||||||||||||||||||||||||||||||||||||||||||||||||||||||
|
Data from the EPIA's Global Market Outlook 2014-2018 report[2]:24 and partially updated with figures from the IEA-PVPS Trends 2014 report[102]:34 | ||||||||||||||||||||||||||||||||||||||||||||||||||||||||||||||||||||
The top ten leading countries in terms of deployed and overall PV-capacity are shown above. Other mentionable PV deployments above the 100-megawatt mark included France (643 MW), Canada (445 MW), South Korea (445 MW), Thailand (437 MW), The Netherlands (360 MW), Switzerland (319 MW), Ukraine (290 MW), Austria (263 MW), Israel (244 MW), Belgium (237 MW), Taiwan (170 MW) Denmark (156 MW) and Spain (116 MW).[102]:33–34
| Country | Capacity 2013 |
Added 2013 |
Source(A) |
|---|---|---|---|
| |
3,226 | 811 | IEA-PVPS trends |
| |
626 | 263 | IEA-PVPS trends |
| |
3,009 | 237 | IEA-PVPS trends |
| |
32 | ? | ? |
| |
1,020 | 10 | EPIA outlook |
| |
1,210 | 445 | IEA-PVPS trends |
| |
3 | 2 | original.[132] Revised cume in 2015[3] |
| |
19,720 | 12,920 | IEA-PVPS trends |
| |
20 | 20 | EPIA outlook |
| |
32 | 15 | EPIA outlook |
| |
2,175 | 88 | EPIA outlook |
| |
563 | 156 | IEA-PVPS trends |
| |
11 | 0 | EPIA outlook |
| |
4,733 | 643 | IEA-PVPS trends |
| |
35,766 | 3,304 | IEA-PVPS trends |
| |
2,579 | 1,043 | EPIA outlook |
| |
22 | 10 | EPIA outlook |
| |
2,320 | 1,115 | IEA-PVPS trends |
| |
3 | 0 | EPIA outlook |
| 481 | 244 | IEA-PVPS trends | |
| |
18,074 | 1,620 | IEA-PVPS trends |
| |
13,599 | 6,968 | IEA-PVPS trends |
| |
1 | 0 | EPIA outlook |
| |
6 | 0 | EPIA outlook |
| |
30 | 0 | EPIA outlook |
| |
73 | 48 | IEA-PVPS trends |
| |
23 | 7 | EPIA outlook |
| |
112 | 60 | IEA-PVPS Trends |
| |
723 | 360 | IEA-PVPS trends |
| |
11 | 1 | IEA-PVPS trends |
| |
7 | 1 | EPIA outlook |
| |
281 | 53 | IEA-PVPS trends |
| |
1,151 | 1,100 | EPIA outlook |
| |
524 | 1 | EPIA outlook |
| |
212 | 11 | EPIA outlook |
| |
122 | 92 | IEA-PVPS[lower-alpha 7] revised in 2015[3] |
| |
1,475 | 445 | IEA-PVPS trends |
| |
5,340 | 116 | EPIA outlook[lower-alpha 8] |
| |
43 | 19 | IEA-PVPS trends |
| |
756 | 319 | IEA-PVPS trends |
| |
376 | 170 | IEA-PVPS trends |
| |
824 | 437 | IEA-PVPS trends |
| |
18 | 6 | IEA-PVPS trends |
| |
616 | 290 | EPIA outlook |
| |
3,377 | 1,546 | IEA-PVPS trends |
| |
12,079 | 4,751 | IEA-PVPS trends |
| Listed countries account for 39,666 MW or 99.3% of worldwide total installations of 39,953 MW in 2013. (A) Data sources (Nameplate capacity in DC-output not AC): | |||
In 2013, Europe added 11 gigawatts of new PV installation (including non-EU countries). It is still the most developed region with a cumulated total of 81.5 GW, about 59 percent of the worldwide installed capacity. Solar PV now covers 3 percent of the electricity demand and 6 percent of the peak electricity demand. However, European PV deployment has slowed down by half compared to the record year of 2011, and will most likely continue to decrease. This is mainly due to the strong decline of new installations in Germany and Italy.
| Photovoltaic Barometer report – PV capacity in the European Union in 2013[118]:5–7,9 | |||||||||
|---|---|---|---|---|---|---|---|---|---|
| Country | Added 2013 (MW) | Total 2013 (MW) | Generation 2013 | ||||||
| off- grid |
on- grid |
Capacity | off- grid |
on- grid |
Capacity | Watt per capita |
in GWh |
in % | |
| |
– | 268.7 | 268.7 | 4.5 | 685.9 | 690.4 | 81.7 | 686.0 | – |
| – | 214.9 | 215.0 | 0.1 | 2,983.3 | 2,983.4 | 267.3 | 2,352.0 | – | |
| |
– | 104.4 | 104.4 | 0.7 | 1,018.5 | 1,019.2 | 139.9 | 1,348.5 | – |
| |
– | 17.2 | 17.2 | 0.5 | 21.2 | 21.7 | 5.1 | 12.3 | – |
| |
0.1 | 17.5 | 17.5 | 0.9 | 33.9 | 34.8 | 40.2 | 45.8 | – |
| |
– | 110.4 | 110.4 | 0.4 | 2,132.4 | 2,132.8 | 202.8 | 2,070.0 | – |
| |
0.2 | 155.0 | 155.2 | 1.4 | 530.0 | 531.4 | 94.8 | 490.0 | – |
| |
– | – | – | 0.1 | – | 0.2 | 0.1 | 0.6 | – |
| |
– | – | – | 11.0 | 0.2 | 11.2 | 2.1 | 5.4 | – |
| |
– | 613.0 | 613.0 | 24.6 | 4,673.0 | 4,697.6 | 71.6 | 4,900.0 | – |
| |
5.0 | 3,305.0 | 3,310.0 | 65.0 | 35,948 | 36,013.0 | 447.2 | 30,000.0 | – |
| |
– | 1,042.5 | 1,042.5 | 7.0 | 2,578.8 | 2,585.8 | 233.7 | 3,648.0 | – |
| |
0.1 | 3.0 | 3.1 | 0.6 | 14.8 | 15.4 | 1.6 | 9.3 | – |
| |
0.1 | – | 0.1 | 0.9 | 0.2 | 1.0 | 0.2 | 0.7 | – |
| |
1.0 | 1,461.0 | 1,462.0 | 12.0 | 17,602.0 | 17,614.0 | 295.1 | 22,146.0 | – |
| |
– | – | – | – | 1.5 | 1.5 | 0.7 | n.a. | – |
| |
– | 61.9 | 61.9 | 0.1 | 68.0 | 68.1 | 22.9 | 45.0 | – |
| |
– | 23.3 | 23.3 | – | 100.0 | 100.0 | 186.2 | 50.0 | – |
| |
– | 6.0 | 6.0 | – | 24.7 | 24.7 | 58.7 | 30.1 | – |
| |
– | 300.0 | 300.0 | 5.0 | 660.0 | 665.0 | 39.6 | 582.0 | – |
| |
0.2 | 0.4 | 0.6 | 2.4 | 1.8 | 4.2 | 0.1 | 4.0 | – |
| |
0.5 | 52.2 | 52.7 | 3.8 | 277.2 | 281.0 | 26.8 | 446.0 | – |
| |
– | 972.7 | 972.7 | – | 1,022.0 | 1,022.0 | 51.1 | 397.8 | – |
| |
– | – | – | 0.1 | 537.0 | 537.1 | 99.3 | 600.0 | – |
| |
– | 33.3 | 33.3 | 0.1 | 254.7 | 254.8 | 123.8 | 240.0 | – |
| |
0.4 | 102.0 | 102.4 | 25.0 | 4,680.5 | 4,705.5 | 100.7 | 8,289.0 | – |
| |
1.1 | 17.9 | 19.0 | 8.4 | 34.7 | 43.1 | 4.5 | 38.8 | – |
| |
– | 1,031.0 | 1,031.0 | 2.3 | 2,737.0 | 2,739.3 | 42.9 | 1,800.0 | – |
| |
8.7 | 9,913.5 | 9,922.2 | 177.0 | 78,621.2 | 78,798.2 | 155.8 | 80,236.0 | – |
| Country | off- grid |
on- grid |
Capacity | off- grid |
on- grid |
Capacity | Watt per capita |
in GWh |
in % |
| Added 2013 (MW) | Total 2013 (MW) | Generation 2013 | |||||||
- 2012
| Country | Capacity | Generation | |||||||
|---|---|---|---|---|---|---|---|---|---|
| off grid Δ |
on grid Δ |
Added | off grid Σ |
on grid Σ |
Total | Watt/ Capita |
GWh | % | |
| 0.0 | 7,604 | 7,604 | 55.0 | 32,643 | 32,698 | 398 | 28,000 | 5.62% | |
| 1.0 | 3,577 | 3,578 | 11.0 | 16,350 | 16,361 | 273 | 18,800 | 6.70% | |
| – | – | 5,000 | – | – | 8,300 | 6 | 6,678 | 0.14% | |
| – | – | 3,346 | – | – | 7,777 | 24 | 9,750 | 0.25% | |
| – | – | 2,000 | – | – | 7,000 | 55 | 6,600 | 0.77% | |
| 1.3 | 193 | 194 | 7.3 | 4,492 | 4,517 | 110 | 8,169 | 2.84% | |
| 0.0 | 1,079 | 1,079 | 24.6 | 4,003 | 4,028 | 61 | 4,000 | 0.91% | |
| 0.0 | 599 | 599 | 0.1 | 2,650 | 2,650 | 241 | 2,115 | 2.90% | |
| – | – | 1,000 | – | – | 2,400 | 105 | 2,800 | 1.23% | |
| 0 | 109 | 109 | 0.4 | 2,022 | 2,022 | 196 | 2,173 | 3.11% | |
| 0 | 929 | 929 | 0 | 1,829 | 1,829 | 29 | 1,327 | 0.50% | |
| 0 | 912 | 912 | 7.0 | 1,536 | 1,543 | – | 1,239 | 4.26% | |
| – | – | 980 | – | – | 1,205 | 1 | 2,115 | 0.33% | |
| – | – | 252 | – | – | 1,064 | 22 | 920 | 0.20% | |
| 0.0 | 721 | 721 | 0.7 | 933 | 933 | 123 | 534 | 3.40% | |
| – | – | 268 | – | – | 765 | 22 | 860 | 0.17% | |
| 0.0 | 30 | 30 | 0.1 | 517 | 517 | 95 | 500 | 1.99% | |
| 0.0 | 235 | 235 | 4.5 | 417 | 422 | 50 | 300 | 0.62% | |
| – | – | 200 | – | – | 410 | 53 | 370 | 0.64% | |
| 0.0 | 375 | 375 | 1.7 | 390 | 392 | 70 | 114 | 1.09% | |
| – | – | 188 | – | – | 373 | 8 | 410 | 0.31% | |
| – | – | 210 | – | – | 359 | 5 | 530 | 0.40% | |
| 0.0 | 175 | 175 | 2.0 | 316 | 321 | 16 | 200 | 0.21% | |
| – | – | 60 | – | – | 250 | 31 | 310 | 0.68% | |
| 0.1 | 68 | 68 | 0.6 | 226 | 229 | 22 | 360 | 0.74% | |
| 0.0 | 117 | 117 | 24.6 | 217 | 217 | 97 | 121 | 1.70% | |
| – | – | 104 | – | – | 206 | 9 | – | – | |
| – | – | 15 | – | – | 38 | 0.3 | 83 | 0.04% | |
| 0 | 7 | 7 | 0 | 47 | 47 | 59 | 30 | 0.44% | |
| – | – | 40 | – | – | 41 | 0.08 | – | – | |
| – | – | 22 | – | – | 36 | 1 | 34 | 0.04% | |
| – | – | 26 | – | – | 30 | 2 | – | – | |
| 0.8 | 7 | 8 | 2.3 | 17 | 24 | 2 | 21 | 0.01% | |
| 0 | 12 | 12 | 5.0 | 19 | 19 | 29 | 14 | 0.89% | |
| 0 | 7 | 7 | 0.8 | 16 | 17 | 11 | 20 | 0.31% | |
| – | – | 12 | – | – | 17 | 0.1 | – | – | |
| – | – | 15 | – | – | 15 | 0.5 | – | – | |
| 0 | 0 | 0 | 11.0 | 0 | 11 | – | 8 | 0.00% | |
| – | – | 0 | – | – | 9 | – | 7 | 0.01% | |
| – | – | 2 | – | – | 9 | 0.1 | 10 | 0.01% | |
| 0 | 6 | 6 | 0.0 | 6 | 6.1 | 2 | 2 | 0.05% | |
| – | – | 2 | – | – | 6 | 0.3 | 2 | – | |
| 0 | 1 | 1 | 0.5 | 3 | 3.74 | – | 5 | 0.01% | |
| 1.1 | 0 | 1 | 3.3 | 1 | 3.4 | 0.1 | 4 | 0.00% | |
| 0 | 0 | 0 | 0.1 | 1.5 | 1.51 | 0.3 | 0 | 0.01% | |
| 0 | 0 | 0 | 0.6 | 0.1 | 0.69 | – | 0 | 0.01% | |
| – | – | 0.2 | – | – | 0.2 | 0.04 | – | – | |
| 0 | 0 | 0 | 0.13 | 0.02 | 0.15 | 0.1 | 0 | 0.00% | |
| Country | off grid Δ |
on grid Δ |
Added | off grid Σ |
on grid Σ |
Total | Watt/ Capita |
GWh | % |
| Capacity | Generation | ||||||||
- 2011
| Country | off grid Δ |
on grid Δ |
Installed 2011 |
off grid Σ |
on grid Σ |
Total 2011 |
Wp/capita Total |
2011 Generation (GWh) |
|---|---|---|---|---|---|---|---|---|
| 5 | 7,500 | 7,505 | 55 | 24,820 | 24,875 | 304.3 | 19,000 | |
| 0 | 9,280 | 9,280 | 13.5 | 12,750 | 12,764 | 210.5 | 10,730 | |
| 4.48 | 1,291.3 | 1,295.8 | 103.3 | 4,810.7 | 4,913.7 | 39 | ||
| 1,867 | 1,867 | 3,965 | 4,383 | 13.8 | ||||
| 1 | 354 | 355 | 23.3 | 4,191 | 4,214 | 91.3 | 7,912 | |
| 15 | 2,485 | 2,500 | 118 | 3,166 | 3,300 | 2.4 | ||
| 0.1 | 1,634 | 1,634 | 29.4 | 2,802 | 2,831 | 43.5 | 1,800 | |
| 0 | 0 | 0 | 0.4 | 1,959 | 1,959 | 186.0 | 2,118 | |
| 0 | 776 | 776 | 0.1 | 1,812 | 1,812 | 165.5 | 1,282 | |
| 76 | 761 | 837 | 163.78 | 1244.16 | 1,407.9 | 56.4 | ||
| 0.3 | 937 | 937 | 2.3 | 1,012 | 1,014 | 16.2 | 259 | |
| 0 | 156.7 | 156.7 | 6 | 806.3 | 812.3 | 15.4 | ||
| 0.1 | 426 | 426 | 7 | 624 | 631 | 55.8 | 544 | |
| 364 | 563 | 16.6 | ||||||
| 0.1 | 314 | 314 | 0.1 | 488 | 488 | 89.8 | 400 | |
| 300 | 461 | 0.4 | ||||||
| 126 | 260 | 32 | ||||||
| 130 | 190 | 23.9 | ||||||
| 0.69 | 90.98 | 91.64 | 4.5 | 182.67 | 187.17 | 20.7 | 163 | |
| 0.1 | 12.6 | 12.7 | 3.2 | 140 | 144 | 13.5 | 265 | |
| 188 | 190 | 4.1 | ||||||
| 0.4 | 100 | 100 | 0.7 | 132 | 133 | 17.7 | 120 | |
| 0 | 30 | 30 | 5 | 113 | 118 | 7.1 | 86 | |
| 70 | 102 | 4.4 | ||||||
| 50 | 100[133] | |||||||
| 0 | 44.9 | 44.9 | 0.1 | 90.3 | 90.4 | 44.1 | 60 | |
| 1 | 41 | 0.8 | ||||||
| 10 | 40 | 0.4 | ||||||
| 5 | 32 | 0.2 | ||||||
| 0 | 1.2 | 1.2 | 0 | 30.6 | 30.6 | 59.9 | 21 | |
| 0.73 | 3.59 | 4.31 | 6.48 | 9.27 | 15.75 | 2.0 | 15.0 | |
| 0.2 | 9.5 | 9.7 | 0.8 | 15.88 | 16.68 | 3.0 | 12.0 | |
| 0 | 7.7 | 7.7 | 0 | 11.5 | 11.5 | 27.4 | 17.5 | |
| 1.5 | 0 | 1.5 | 11 | 0.2 | 11.2 | 2.1 | 8.0 | |
| 0 | 0.9 | 0.9 | 11 | 2.5 | 13.5 | 0.4 | ||
| 0.1 | 3.8 | 3.8 | 0.7 | 9.3 | 10.1 | 12.5 | 12.0 | |
| 5 | 6 | 0.1 | ||||||
| 0.2 | 2.2 | 2.4 | 0.4 | 3.7 | 4.1 | 0.4 | 3.3 | |
| 0 | 1 | 1 | 0.6 | 2.3 | 2.9 | 0.1 | 2.0 | |
| 0 | 0 | 0 | 1.3 | 0.5 | 1.8 | 0.0 | 1.7 | |
| 0 | 1.5 | 1.5 | 0 | 1.5 | 1.5 | 0.7 | ||
| 0 | 0 | 0 | 0.6 | 0.1 | 0.7 | 0.2 | 0.5 | |
| 0.1 | 0 | 0.1 | 0.1 | 0.0 | 0.2 | 0.1 | 0.1 | |
| 0 | 0 | 0 | 0.1 | 0 | 0.1 | 0.0 | 0.1 | |
| 0 | 0.1 | 0.02 | ||||||
| Country | off grid Δ |
on grid Δ |
Installed 2011 |
off grid Σ |
on grid Σ |
Total 2011 |
Wp/capita Total |
2011 Generation (GWh) |
- 2010
| Country | off grid Δ |
on grid Δ |
Installed 2010 |
off grid Σ |
on grid Σ |
Total 2010 |
Watt/ Capita |
Module Price US$/Wp |
Feed-in Tariff US$/kW·h |
|---|---|---|---|---|---|---|---|---|---|
| 5 | 7,406 | 7,411 | 50 | 17,320 | 17,370 | 212.3 | – | – | |
| 1 | 369 | 370 | 21.1 | 3,787 | 3,808 | 82.8 | – | – | |
| 4.2 | 986.8 | 991.0 | 98.8 | 3,519 | 3,618 | 28.3 | – | – | |
| 0.1 | 2,321 | 2,321 | 13.5 | 3,465 | 3,478 | 57.6 | – | – | |
| 31 | 887 | 918 | 440 | 2,094 | 2,534 | 8.1 | 1.48-2.36 | – | |
| 0 | 1,490 | 1,490 | 0.4 | 1,952.7 | 1,953 | 185.9 | – | – | |
| 0.1 | 719.0 | 719.1 | 29.4 | 1,025 | 1,054 | 16.3 | – | – | |
| – | – | 520.0 | – | – | 893.0 | – | – | – | |
| 0 | 213.4 | 213.4 | 0.1 | 787.4 | 787.5 | 72.6 | – | – | |
| 0 | 131.2 | 131.2 | 6.0 | 649.6 | 655.6 | 13.4 | – | – | |
| 3.8 | 379.5 | 383.3 | 87.8 | 483.1 | 570.9 | 25.2 | – | – | |
| 24.9 | 171.7 | 196.6 | 60.1 | 231.0 | 291.1 | 8.4 | – | – | |
| 0.1 | 150.3 | 150.4 | 6.9 | 198.5 | 205.4 | 18.2 | – | – | |
| – | – | 69.0 | – | – | 189.0 | – | – | – | |
| 0.2 | 25.5 | 25.7 | 4 | 69.6 | 73.6 | 9.7 | 3.0-3.5 | 14.7 | |
| 0.091 | 10.58 | 10.67 | 5 | 62.5 | 67.5 | 4.1 | – | – | |
| 0.25 | 19.96 | 20.21 | 3.61 | 48.99 | 52.60 | 6.4 | 3.0-3.2 | 26.4 | |
| 0.155 | 6.922 | 7.077 | 0 | 26.4 | 26.4 | 0.4 | – | – | |
| 2.47 | 0.80 | 3.27 | 23.72 | 1.30 | 25.02 | 0.2 | 4-5 | <36.2 | |
| 0.5 | 21 | 21.5 | 2.9 | 21.63 | 24.53 | 3.4 | 3.6-5.1 | 12.5 | |
| 0.2 | 14.25 | 14.45 | 2.841 | 15.03 | 17.87 | 1.7 | 2.1-4.2 | 10.3-19.2 | |
| 2 | 0.287 | 2.287 | 10 | 1.063 | 11.06 | 0.4 | 3.71 | <13.5 | |
| 0 | 6.9 | 6.9 | 0.1 | 8.9 | 9.0 | 4.1 | – | – | |
| 0.338 | 0.516 | 0.854 | 5.169 | 3.595 | 8.764 | 1.0 | 2.4-6.5 | 18.3-20.9 | |
| 0.32 | 0 | 0.32 | 8.530 | 0.132 | 8.662 | 1.9 | – | 11.1–14.3 | |
| 2.0 | 0 | 2.0 | 7.5 | 0.2 | 7.6 | 1.4 | – | – | |
| 0 | 1.8 | 1.8 | 0 | 5.7 | 5.7 | 52.4 | – | – | |
| 0 | 4.3 | 4.3 | 0 | 5.7 | 5.7 | 0.8 | – | – | |
| 0.2 | 1.2 | 1.3 | 0.540 | 4.025 | 4.565 | 0.8 | 2.8-4.7 | 37.5 | |
| 0.9 | 0.1 | 1 | 4.5 | 0.5 | 5 | 0.1 | 2.8-4.2 | 13.3 | |
| Country | off grid Δ |
on grid Δ |
Installed 2010 |
off grid Σ |
on grid Σ |
Total 2010 |
Watt/ Capita |
Module Price US$/Wp |
Feed-in Tariff US$/kW·h |
- 2009
| Country | off grid Δ |
on grid Δ |
Installed 2009 |
off grid Σ |
on grid Σ |
Total 2009 |
Watt/ Capita |
Module Price US$/Wp |
Feed-in Tariff US$/kW·h |
|---|---|---|---|---|---|---|---|---|---|
| 5 | 3,840 | 3,845 | 45 | 9,800 | 9,845 | 119.6 | 2.1-3.5 | 31.5 | |
| 0 | 60 | 60 | 31 | 3,492 | 3,523 | 76.1 | 1.6-3.5 | – | |
| 3.8 | 479.2 | 483.0 | 95 | 2,533 | 2,627 | 20.7 | 4.3 | 19.1-25.8 | |
| 40 | 433.1 | 473.1 | 410 | 1,232 | 1,642 | 5.3 | 1.85-2.2 | 10.4 | |
| 0 | 723 | 723 | 13 | 1168 | 1,181 | 20.3 | 2.2-3.0 | 23.6 | |
| 0 | 84.4 | 84.4 | 5.9 | 436.0 | 441.9 | 9.1 | 1.9-2.0 | 13.3-19.6 | |
| 0.2 | 250 | 250.2 | 23 | 407 | 430 | 6.7 | 1.5-2.8 | – | |
| 10.56 | 68.57 | 79.13 | 83.91 | 99.7 | 183.65 | 8.3 | 2.3-4.7 | 10.2-15.6 | |
| 0.1 | 34.15 | 34.25 | 3.05 | 99.15 | 102.2 | 9.5 | 2.1-4.2 | 10.3-19.2 | |
| 7.71 | 54.14 | 61.85 | 35.2 | 59.37 | 94.57 | 2.8 | 2.9 | 6.1 | |
| 0.2 | 25.5 | 25.7 | 4 | 69.6 | 73.6 | 9.7 | 3.0-3.5 | 14.7 | |
| 0.091 | 10.58 | 10.67 | 5 | 62.5 | 67.5 | 4.1 | – | – | |
| 0.25 | 19.96 | 20.21 | 3.61 | 48.99 | 52.60 | 6.4 | 3.0-3.2 | 26.4 | |
| 0.155 | 6.922 | 7.077 | 1.75 | 27.85 | 29.59 | 0.4 | – | – | |
| 2.47 | 0.80 | 3.27 | 23.72 | 1.30 | 25.02 | 0.2 | 4-5 | <36.2 | |
| 0.5 | 21 | 21.5 | 2.9 | 21.63 | 24.53 | 3.4 | 3.6-5.1 | 12.5 | |
| 2 | 0.287 | 2.287 | 10 | 1.063 | 11.06 | 0.4 | 3.71 | <13.5 | |
| 0.338 | 0.516 | 0.854 | 5.169 | 3.595 | 8.764 | 1.0 | 2.4-6.5 | 18.3-20.9 | |
| 0.32 | 0 | 0.32 | 8.530 | 0.132 | 8.662 | 1.9 | – | 11.1–14.3 | |
| 0.9 | 0.1 | 1 | 4.5 | 0.5 | 5 | 0.1 | 2.8-4.2 | 18.0 | |
| 0.2 | 1.2 | 1.3 | 0.540 | 4.025 | 4.565 | 0.8 | 2.8-4.7 | 37.5 | |
| Country | off grid Δ |
on grid Δ |
Installed 2009 |
off grid Σ |
on grid Σ |
Total 2009 |
Watt/ Capita |
Module Price US$/Wp |
Feed-in Tariff US$/kW·h |
- 2008
| Country | off grid Δ |
on grid Δ |
Installed 2008 |
off grid Σ |
on grid Σ |
Total 2008 |
Watt/ Capita |
|---|---|---|---|---|---|---|---|
| 4.5 | 1,500 | 1,504.5 | 40 | 5,300 | 5,340 | 64.7 | |
| 1 | 60 | 2,661 | 31 | 3,323 | 3,354 | 77.1 | |
| 0.7 | 224.6 | 225.3 | 90.8 | 2,053 | 2,144 | 16.8 | |
| 45 | 293 | 338 | 370 | 798.5 | 1,168.5 | 3.9 | |
| 0.2 | 337.9 | 338.1 | 13.3 | 445 | 458.3 | 7.8 | |
| 0 | 276.3 | 276.3 | 5.9 | 351.6 | 357.5 | 7.3 | |
| 0.4 | 104.1 | 104.5 | 22.9 | 156.8 | 179.7 | 2.9 | |
| 6.9 | 15.1 | 22.0 | 73.3 | 31.2 | 104.5 | 5.1 | |
| 0.1 | 49.98 | 50.08 | 2.941 | 65.01 | 67.95 | 6.7 | |
| 0.21 | 4.2 | 4.4 | 5.2 | 52 | 57.2 | 3.5 | |
| 0.2 | 11.5 | 11.7 | 3.8 | 44 | 47.9 | 6.4 | |
| 4.62 | 2.33 | 6.94 | 27.48 | 5.24 | 32.7 | 1.0 | |
| 0.13 | 4.55 | 4.69 | 3.36 | 29.03 | 32.39 | 4.0 | |
| 0.12 | 4.3 | 4.42 | 1.59 | 20.92 | 22.51 | 0.3 | |
| 0.80 | 0.20 | 1.00 | 21.25 | 0.50 | 21.75 | 0.2 | |
| 1.6 | 0.135 | 1.76 | 8 | 0.776 | 8.776 | 0.4 | |
| 0.35 | 0 | 0.35 | 8.210 | 0.132 | 8.342 | 1.8 | |
| 0.275 | 10.403 | 1.678 | 4.83 | 3.08 | 7.91 | 0.9 | |
| 0.675 | 0.075 | 0.75 | 3.75 | 0.25 | 4 | 0.06 | |
| 0.55 | 0.135 | 0.190 | 0.440 | 2.825 | 3.265 | 0.8 | |
| 0.6 | 0.6 | 1.21 | 2.4 | 0.62 | 3.03 | 0.4 | |
| Country | off grid Δ |
on grid Δ |
Installed 2009 |
off grid Σ |
on grid Σ |
Total 2009 |
Watt/ capita |
- 2007
Off grid refers to photovoltaics which are not grid connected. On grid means connected to the local electricity grid. Δ means the amount installed during the previous year. Σ means the total amount installed. Wp/capita refers to the ratio of total installed capacity divided by total population, or total installed Wp per person. Module price is average installed price, in Euros. kW·h/kWp·yr indicates the range of insolation to be expected. While National Report(s) may be cited as source(s) within an International Report, any contradictions in data are resolved by using only the most recent report's data. Exchange rates represent the 2006 annual average of daily rates (OECD Main Economic Indicators June 2007).
Module Price: Lowest:2.5 EUR/Wp (2.83 USD/Wp[134]) in Germany 2003. Uncited insolation data is from maps dating 1991–1995.[135][136][137]
| Country | off grid Δ |
on grid Δ |
Installed 2007 |
off grid Σ |
on grid Σ |
Total 2007 |
Watt/ Capita |
Module Price €/Wp |
Feed-in Tariff EU¢/kWh |
|---|---|---|---|---|---|---|---|---|---|
| 35 | 1,100 | 1,135 | 35 | 3,827 | 3,862 | 46.8 | 4.0–5.3 | 51.8–56.8 | |
| 1.562 | 208.8 | 210.4 | 90.15 | 1,829 | 1,919 | 15 | 2.96 | Ended(2005) | |
| 55 | 151.5 | 206.5 | 325 | 505.5 | 830.5 | 2.8 | 2.98 | 1.2–31.04(CA) | |
| 22 | 490 | 512 | 29.8 | 625.2 | 655 | 15.1 | 3.0–4.5 | 18.38–44.04 | |
| 0.3 | 69.9 | 70.2 | 13.1 | 107.1 | 120.2 | 2.1 | 3.2–3.6 | 36.0–49.0 | |
| 5.91 | 6.28 | 12.19 | 66.45 | 16.04 | 82.49 | 4.1 | 4.5–5.4 | 0–26.4(SA'08) | |
| 0 | 42.87 | 42.87 | 5.943 | 71.66 | 77.60 | 1.6 | 3.50–3.84 | 56.5–59.3 | |
| 0.993 | 30.31 | 31.30 | 22.55 | 52.68 | 75.23 | 1.2 | 3.2–5.1 | 30.0–55.0 | |
| 0.582 | 1.023 | 1.605 | 5.3 | 48 | 53.3 | 3.3 | 3.3–4.5 | 1.21–9.7 | |
| 0.2 | 6.3 | 6.5 | 3.6 | 32.6 | 36.2 | 4.9 | 3.18–3.30 | 9.53–50.8 | |
| 0.055 | 2.061 | 2.116 | 3.224 | 24.48 | 27.70 | 3.4 | 3.6–4.3 | >0 | |
| 3.888 | 1.403 | 5.291 | 22.86 | 2.911 | 25.78 | 0.8 | 3.76 | 0–29.48(ON) | |
| 0.869 | 0.15 | 1.019 | 20.45 | 0.3 | 20.75 | 0.2 | 5.44–6.42 | None | |
| 0.16 | 3.65 | 3.81 | 1.47 | 16.62 | 18.09 | 0.3 | 3.67–5.72 | 0–11.74(exprt) | |
| 0.2 | 14.25 | 14.45 | 2.841 | 15.03 | 17.87 | 1.7 | – | – | |
| 0.32 | 0.004 | 0.324 | 7.86 | 0.132 | 7.992 | 1.7 | 11.2 | None | |
| 0.271 | 1.121 | 1.392 | 4.566 | 1.676 | 6.242 | 0.7 | 3.24–7.02 | None | |
| 0.05 | 0.125 | 0.175 | 0.385 | 2.69 | 3.075 | 0.6 | 5.36–8.04 | None | |
| 0.5 | 0 | 0.5 | 1.794 | 0.025 | 1.819 | 0.3 | 4.3 | 13.13–16.40 | |
| Country | off grid Δ |
on grid Δ |
Installed 2007 |
off grid Σ |
on grid Σ |
Total 2007 |
Watt/ Capita |
Module Price €/Wp |
Feed-in Tariff EU¢/kW·h |
- 2006
Notes: While National Report(s) may be cited as source(s) within an International Report, any contradictions in data are resolved by using only the most recent report's data. Exchange rates represent the 2006 annual average of daily rates (OECD Main Economic Indicators June 2007)
Module Price: Lowest:2.5 EUR/Wp[130] (2.83 USD/Wp[134]) in Germany 2003. Uncited insolation data is lifted from maps dating 1991–1995.[135][136][137]
| Country | Cells Made |
Modules Made |
off grid Δ |
on grid Δ |
Installed 2006 |
off grid Σ |
on grid Σ |
Total 2006 |
Watt/ Capita |
Module Price €/Wp |
Feed-in Tariff EU¢/kWh |
|---|---|---|---|---|---|---|---|---|---|---|---|
| 514.0 | 341.0 | 3 | 950 | 953 | 32 | 2,831 | 2,863 | 34.78 | 4.0–5.3 | 51.8–56.8 | |
| 919.8 | 645.4 | 1.531 | 285.1 | 286.6 | 88.59 | 1,620 | 1,709 | 13.37 | 2.96 | Ended(2005) | |
| 201.6 | 200.5 | 37 | 108 | 145 | 270 | 354 | 624 | 2.058 | 2.98 | 1.2–31.04(CA) | |
| 75.3 | – | 9.1 | 51.4 | 60.5 | 17.8 | 100.4 | 118.2 | 2.620 | 3.0–4.5 | 18.38–44.04 | |
| 380 | 510 | 15 | – | 15 | 73 | – | 73 | 0.055 | – | – | |
| 36.0 | 7.6 | 7.576 | 2.145 | 9.721 | 60.54 | 9.765 | 70.30 | 3.327 | 4.5–5.4[153] | 0–26.4(SA'08) | |
| 18.0 | 2.6 | 0.278 | 1.243 | 1.521 | 5.713 | 46.99 | 52.71 | 3.217 | 3.3–4.5 | 1.21–9.7 | |
| 11.0 | 27.0 | 0.5 | 12 | 12.5 | 12.8 | 37.2 | 50 | 0.846 | 3.2–3.6 | 36.0–49.0 | |
| 33.5 | 36.0 | 1.478 | 9.412 | 10.89 | 21.55 | 22.38 | 43.93 | 0.685 | 3.2–5.1 | 30.0–55.0 | |
| 18.0 | 16.9 | 0.28 | 20.93 | 21.21 | 5.943 | 28.79 | 34.73 | 0.716 | 3.50–3.84 | 56.5–59.3 | |
| – | 20 | 6 | – | 6 | 30 | – | 30 | 0.477 | 2.5[138] | – | |
| 0.03 | 0.03 | 0.15 | 2.5 | 2.65 | 3.4 | 26.3 | 29.7 | 3.955 | 3.18–3.30 | 9.53–50.8 | |
| – | – | 0.274 | 1.29 | 1.564 | 3.169 | 22.42 | 25.59 | 3.076 | 3.6–4.3 | >0 | |
| – | – | – | 0.042 | 0.042 | – | 23.60 | 23.60 | 50.54 | – | – | |
| 0 | 2.35 | 3.354 | 0.384 | 3.738 | 18.98 | 1.508 | 20.48 | 0.620 | 3.76 | 0–29.48(ON) | |
| – | – | 0.938 | 0.116 | 1.054 | 19.59 | 0.155 | 19.75 | 0.185 | 5.44–6.42 | None | |
| 1.9 | 89.4 | 0.376 | 3.007 | 3.383 | 1.3 | 12.96 | 14.26 | 0.232 | 3.67–5.72 | 0–11.74(exprt) | |
| 43.4[154] | 65 | 6 | – | 6 | 12 | – | 12 | 0.010 | – | – | |
| 37.0 | 0 | 0.35 | 0.053 | 0.403 | 7.54 | 0.128 | 7.668 | 1.624 | 11.2 | None | |
| – | – | 1.049 | 0.201 | 1.25 | 5.081 | 1.613 | 6.694 | 0.601 | – | 40.0–50.0 | |
| 0 | 55.4 | 0.302 | 0.301 | 0.613 | 4.285 | 0.555 | 4.84 | 0.529 | 3.24–7.02 | None | |
| – | – | – | 2.103 | 2.103 | 0.053 | 4.108 | 4.161 | 0.398 | – | – | |
| – | – | – | 0.064 | 0.064 | 3.779 | 0.287 | 4.066 | 0.768 | – | – | |
| – | – | 1.134 | – | 1.134 | 3.6 | – | 3.6 | 0.023 | – | – | |
| – | – | 0.65 | – | 0.65 | 3.6 | – | 3.6 | 0.187 | – | – | |
| – | – | 0.25 | 0.227 | 0.477 | 2.691 | 0.775 | 3.466 | 0.326 | – | – | |
| 0 | 0.525 | 0.04 | 0.21 | 0.25 | 0.335 | 2.565 | 2.9 | 0.531 | 5.36–8.04 | None | |
| – | – | 0.333 | – | 0.333 | 2.333 | – | 2.333 | 0.083 | – | – | |
| 0 | 0 | 0.275 | – | 0.275 | 1.294 | 0.025 | 1.319 | 0.183 | 4.3 | 13.13–16.40 | |
| – | – | 0.08 | 0.44 | 0.52 | 0.45 | 0.526 | 0.976 | 1.142 | – | – | |
| – | 42[130] | – | 0.241 | 0.241 | 0.15 | 0.621 | 0.771 | 0.075 | – | – | |
| 0 | 0 | – | .00452 | 0.00452 | – | 0.486 | 0.486 | 0.018 | 4.73 | None | |
| – | – | 0.027 | 0.087 | 0.114 | 0.319 | 0.112 | 0.431 | 0.011 | – | – | |
| – | – | – | 0.183 | 0.183 | 0.098 | 0.265 | 0.363 | 0.180 | – | – | |
| – | – | – | – | – | 0.3 | – | 0.3 | 0.070 | – | – | |
| – | – | 0.12 | – | 0.12 | 0.2 | – | 0.2 | 0.026 | – | 38.5–40.0 | |
| – | – | – | – | – | 0.09 | 0.065 | 0.155 | 0.015 | – | – | |
| – | – | 0.004 | – | 0.004 | 0.064 | – | 0.064 | 0.012 | – | – | |
| – | – | – | 0.033 | 0.033 | – | 0.048 | 0.048 | 0.118 | – | – | |
| – | – | 0.023 | – | 0.023 | 0.04 | – | 0.04 | 0.012 | – | – | |
| – | – | 0.005 | – | 0.005 | 0.008 | – | 0.008 | 0.006 | – | – | |
| – | – | 0.001 | – | 0.001 | 0.006 | – | 0.006 | 0.003 | – | – | |
| Country | Cells Made |
Modules Made |
off[136] | on grid Δ |
Installed 2006 |
off grid Σ |
on grid Σ |
Total 2006 |
Wp/capita Total |
Module Price €/Wp |
Feed-in Tariff EU¢/kWh |
- 2005
Original source gives these individual numbers and totals them to 37,500 kW. The 2004 reported total was 30,700 kW.[156] With new installations of 6,800 kW, this would give the reported 37,500 kW.
| Country | Cumulative | Installed in 2005 | |||
|---|---|---|---|---|---|
| Off Grid PV [kW] | On Grid [kW] | Total [kW] | Total [kW] | Grid-tied [kW] | |
| Germany | 29,000 | 1,400,000 | 1,429,000 | 635,000 | 632,000 |
| Japan | 87,057 | 1,334,851 | 1,421,908 | 289,917 | 287,105 |
| United States | 233,000 | 246,000 | 479,000 | 103,000 | 70,000 |
| Australia | 41,841 | 8,740 | 60,581 | 8,280 | 1,980 |
| Spain | 15,800 | 41,600 | 57,400 | 20,400 | 18,600 |
| Netherlands | 4,919 | 45,857 | 50,776 | 1,697 | 1,547 |
| Italy | 12,300 | 15,200 | 37,500* | 6,800 | 6,500 |
| France | 20,076 | 12,967 | 33,043 | 7,020 | 5,900 |
| Switzerland | 3,250 | 23,800 | 27,050 | 3,950 | 3,800 |
| Austria | 2,895 | 21,126 | 24,021 | 2,961 | 2,711 |
| Mexico | 18,654 | 40 | 18,694 | 513 | 30 |
| Canada | 15,622 | 1,124 | 16,746 | 2,862 | 612 |
| South Korea | 5,663 | 9,358 | 15,021 | 6,487 | 6,183 |
| United Kingdom | 924 | 9,953 | 10,877 | 2,732 | 2,567 |
| Norway | 7,177 | 75 | 7,252 | 362 | 0 |
| Sweden | 3,983 | 254 | 4,237 | 371 | 0 |
| Denmark | 295 | 2,355 | 2,650 | 360 | 320 |
| Israel | 1,019 | 25 | 1,044 | 158 | 2 |
- 2004
| Country | Cumulative | Installed in 2004 | |||
|---|---|---|---|---|---|
| Off-grid PV [kW] | Grid-connected [kW] | Total [kW] | Total [kW] | Grid-tied [kW] | |
| Japan | 84,245 | 1,047,746 | 1,131,991 | 272,368 | 267,016 |
| Germany | 26,000 | 768,000 | 794,000 | 363,000 | 360,000 |
| United States | 189,600 | 175,600 | 365,200 | 90,000 | 62,000 |
| Australia | 48,640 | 6,760 | 52,300 | 6,670 | 780 |
| Netherlands | 4,769 | 44,310 | 49,079 | 3,162 | 3,071 |
| Spain | 14,000 | 23,000 | 37,000 | 10,000 | 8,460 |
| Italy | 12,000 | 18,700 | 30,700 | 4,700 | 4,400 |
| France | 18,300 | 8,000 | 26,300 | 5,228 | 4,183 |
| Switzerland | 3,100 | 20,000 | 23,100 | 2,100 | 2,000 |
| Austria | 2,687 | 16,493 | 19,180 | 2,347 | 1,833 |
| Mexico | 18,172 | 10 | 18,182 | 1,041 | 0 |
| Canada | 13,372 | 512 | 13,884 | 2,054 | 107 |
| Korea | 5,359 | 4,533 | 9,892 | 3,454 | 3,106 |
| United Kingdom | 776 | 7,386 | 8,164 | 2,261 | 2,197 |
| Norway | 6,813 | 75 | 6,888 | 273 | 0 |
All time PV installations by country
| Country | 1992 | 93 | 94 | 95 | 96 | 97 | 98 | 99 | 2000 | 01 | 02 | 03 | 04 | 05 | 06 | 07 | 08 | 09 | 10 | 11 | 12 | 13 | 14 | |
|---|---|---|---|---|---|---|---|---|---|---|---|---|---|---|---|---|---|---|---|---|---|---|---|---|
| Australia | 7.3 | 8.9 | 10.7 | 12.7 | 15.9 | 18.7 | 22.5 | 25.3 | 29.2 | 33.6 | 39.1 | 45.6 | 52.3 | 60.6 | 70.3 | 82.5 | 105 | 188 | 571 | 1377 | 2415 | 3226 | 4136 | |
| Austria | 0.6 | 0.8 | 1.1 | 1.4 | 1.7 | 2.2 | 2.9 | 3.7 | 4.9 | 6.1 | 10.3 | 16.8 | 21.1 | 24.0 | 25.6 | 28.7 | 32.4 | 52.6 | 95.5 | 187 | 363 | 626 | 766 | |
| Belgium | 23.7 | 108 | 649 | 1067 | 2088 | 2722 | 3009 | 3074 | ||||||||||||||||
| Brazil | 5 | D17 | D32 | F54 | ||||||||||||||||||||
| Bulgaria | 5.7 | 35 | 141 | 1010 | 1020 | 1022 | ||||||||||||||||||
| Canada | 1.0 | 1.1 | 1.5 | 1.9 | 2.6 | 3.4 | 4.5 | 5.8 | 7.2 | 8.8 | 10.0 | 11.8 | 13.9 | 16.8 | 20.5 | 25.8 | 32.7 | 94.6 | 281 | 558 | 766 | 1211 | 1710 | |
| Chile | C<1 | C2 | 3 | 368 | ||||||||||||||||||||
| China | 19 | 23.5 | 42 | 52 | 62 | 70 | 80 | 100 | 140 | 300 | 800 | 3300 | 6800 | 19720 | 28199 | |||||||||
| Croatia | 0.2 | 20 | 34 | |||||||||||||||||||||
| Cyprus | 3.3 | 6.2 | 9 | 17 | 32 | 65 | ||||||||||||||||||
| Czech | 463.3 | 1952 | 1959 | 2087 | 2175 | 2134 | ||||||||||||||||||
| Denmark | 0.1 | 0.1 | 0.1 | 0.2 | 0.4 | 0.5 | 1.1 | 1.5 | 1.5 | 1.6 | 1.9 | 2.3 | 2.7 | 2.9 | 3.1 | 3.2 | 4.6 | 7.1 | 16.7 | 408 | 563 | 603 | ||
| Estonia | 0.05 | 0.08 | 0.2 | 0.2 | 0.2 | n/a | ||||||||||||||||||
| Finland | 0.1 | 1 | 11 | 11 | 11 | |||||||||||||||||||
| France | 1.8 | 2.1 | 2.4 | 2.9 | 4.4 | 6.1 | 7.6 | 9.1 | 11.3 | 13.9 | 17.2 | 21.1 | 26.0 | 33.0 | 36.5 | 74.5 | 179 | 369 | 1204 | 2974 | 4090 | 4733 | 5660 | |
| Germany | 2.9 | 4.3 | 5.6 | 6.7 | 10.3 | 16.5 | 21.9 | 30.2 | 89.4 | 207 | 324 | 473 | 1139 | 2072 | 2918 | 4195 | 6153 | 9959 | 17372 | 24858 | 32462 | 35766 | 38200 | |
| Greece | 55 | 205 | 624 | 1536 | 2579 | 2595 | ||||||||||||||||||
| Guatemala | n/a | F+6 | ||||||||||||||||||||||
| Honduras | n/a | F+5 | ||||||||||||||||||||||
| Hungary | 0.65 | 1.75 | 4 | 12 | 22 | 38 | ||||||||||||||||||
| India | 161 | 461 | 1205 | 2320 | 2936 | |||||||||||||||||||
| Ireland | 0.1 | 3 | 3 | 3 | 3 | |||||||||||||||||||
| Israel | 0.9 | 1.0 | 1.3 | 1.8 | 3.0 | 24.5 | 69.9 | 190 | 237 | 481 | 731 | |||||||||||||
| Italy | 8.5 | 12.1 | 14.1 | 15.8 | 16.0 | 16.7 | 17.7 | 18.5 | 19.0 | 20.0 | 22.0 | 26.0 | 30.7 | 37.5 | 50.0 | 120 | 458 | 1181 | 3502 | 12809 | 16454 | 18074 | 18460 | |
| Japan | 19.0 | 24.3 | 31.2 | 43.4 | 59.6 | 91.3 | 133 | 209 | 330 | 453 | 637 | 860 | 1132 | 1422 | 1709 | 1919 | 2144 | 2627 | 3618 | 4914 | 6632 | 13599 | 23300 | |
| Latvia | 0 | 0.2 | 1 | 1 | 1 | |||||||||||||||||||
| Lithuania | 0.07 | 0.2 | 0.3 | 6 | 6 | 6 | ||||||||||||||||||
| Luxembourg | 26.4 | 27.3 | 30 | A30 | A30 | A45 | ||||||||||||||||||
| Malaysia | 5.5 | 7.0 | 8.8 | 11.1 | 12.6 | 13.5 | 35 | 73 | 160 | |||||||||||||||
| Malta | 1.53 | 1.67 | 12 | 16 | 23 | 54 | ||||||||||||||||||
| Mexico | 5.4 | 7.1 | 8.8 | 9.2 | 10.0 | 11.0 | 12.0 | 12.9 | 13.9 | 15.0 | 16.2 | 17.1 | 18.2 | 18.7 | 19.7 | 20.7 | 21.7 | 25.0 | 30.6 | 40.1 | 52.4 | 112 | 176 | |
| Netherlands | 0.1 | 0.1 | 0.3 | 0.7 | 1.0 | 1.0 | 5.3 | 8.5 | 16.2 | 21.7 | 39.7 | 43.4 | 45.4 | 47.5 | 48.6 | 52.8 | 63.9 | 84.7 | 143 | 363 | 723 | 1123 | ||
| Norway | B6.4 | B6.6 | B6.9 | B7.3 | B7.7 | B8.0 | B8.3 | B8.7 | B9.1 | B9.5 | B10 | B11 | 13 | |||||||||||
| Peru | 0 | D22 | n/a | n/a | ||||||||||||||||||||
| Poland | 1.38 | 1.75 | 3 | 7 | 7 | 24 | ||||||||||||||||||
| Portugal | 0.2 | 0.2 | 0.3 | 0.3 | 0.4 | 0.5 | 0.6 | 0.9 | 1.1 | 1.3 | 1.7 | 2.0 | 2.0 | 2.0 | 4.0 | 15 | 56 | 99 | 135 | 169 | 228 | 281 | 391 | |
| Romania | 0.64 | 1.94 | 4 | 51 | 1151 | 1219 | ||||||||||||||||||
| Slovakia | 0.19 | 148 | 508 | 523 | 524 | 533 | ||||||||||||||||||
| Slovenia | 9.0 | 35 | 81 | 201 | 212 | 256 | ||||||||||||||||||
| South Africa | 1 | 30 | 122 | 922 | ||||||||||||||||||||
| South Korea | 1.5 | 1.6 | 1.7 | 1.8 | 2.1 | 2.5 | 3.0 | 3.5 | 4.0 | 4.7 | 10.0 | 11.0 | 13.8 | 19.2 | 41.8 | 87.2 | 363 | 530 | 656 | 735 | 1030 | 1475 | 2384 | |
| Spain | 1.0 | 1.0 | 1.0 | 1.0 | 1.0 | 2.0 | 2.0 | 4.0 | 7.0 | 12.0 | 23.0 | 48 | 145 | 693 | 3354 | 3438 | 3915 | 4889 | 5221 | 5340 | 5358 | |||
| Sweden | 0.8 | 1.0 | 1.3 | 1.6 | 1.8 | 2.1 | 2.4 | 2.6 | 2.8 | 3.0 | 3.3 | 3.6 | 3.9 | 4.2 | 4.8 | 6.2 | 7.9 | 8.8 | 11 | 11 | 24 | 43 | 79 | |
| Switzerland | 4.7 | 5.8 | 6.7 | 7.5 | 8.4 | 9.7 | 11.5 | 13.4 | 15.3 | 17.6 | 19.5 | 21.0 | 23.1 | 27.1 | 29.7 | 36.2 | 47.9 | 73.6 | 111 | 211 | 437 | 756 | 1076 | |
| Taiwan | 32 | 102 | 206 | 376 | 776 | |||||||||||||||||||
| Thailand | 2.9 | 4.2 | 10.8 | 23.9 | 30.5 | 32.5 | 33.4 | 43.2 | 49.2 | 243 | 388 | 824 | 1299 | |||||||||||
| Turkey | 0.2 | 0.3 | 0.4 | 0.6 | 0.9 | 1.3 | 1.8 | 2.3 | 2.8 | 3.3 | 4.0 | 5.0 | 6 | 7 | 8.5 | 18 | 58 | |||||||
| Ukraine | 3 | 191 | 326 | 616 | n/a | |||||||||||||||||||
| UK | 0.2 | 0.3 | 0.3 | 0.4 | 0.4 | 0.6 | 0.7 | 1.1 | 1.9 | 2.7 | 4.1 | 5.9 | 8.2 | 10.9 | 14.3 | 18.1 | 22.5 | 29.6 | 77 | 904 | E1901 | E3377 | 5104 | |
| USA | 43.5 | 50.3 | 57.8 | 66.8 | 76.5 | 88.2 | 100 | 117 | 139 | 168 | 212 | 275 | 376 | 479 | 624 | 831 | 1169 | 1256 | 2528 | 4383 | 7272 | 12079 | 18280 | |
| References | [129] | [128] | [127] | [112][120] | [111][125] | [2][102] | [3][117] | |||||||||||||||||
| Year | 1992 | 93 | 94 | 95 | 96 | 97 | 98 | 99 | 2000 | 01 | 02 | 03 | 04 | 05 | 06 | 07 | 08 | 09 | 10 | 11 | 12 | 13 | 14 | |
Notes:
| ||||||||||||||||||||||||
See also
- Growth of concentrated solar power (CSP)
- Solar power by country
- Timeline of solar cells
- List of renewable energy topics by country
- Wind power by country
Notes
- ↑ Projection for 2015 is an overall average of estimates from IEA, SPE (EPIA), IHS, MC, Deutsche Bank, and BNEF
- ↑ Note, that the report does not mention figures for 2015 explicitly. The above figures were inferred from the published bar-chart diagram on page 14, which translate into 41.1 GW for the low-case scenario and 60.2 GW for the high case scenario. Figures can only be as accurate as the diagram itself. The arithmetic mean of both scenarios is 50.7 GW.
- ↑ See section All time PV installations by country for the corresponding cited sources of historical data
- ↑ See section forecast for 2015-projections
- ↑ Displayed figures are recalculated from AC to DC-figure in megawatt-peak (MWp). The AC-to-DC conversion increases figure on average by 15% (normally in the range of 5%–30%)
- ↑ Percentage figures based on "IEA-PVPS Trends 2014" report. Worldwide PV installations of 39,953 MW corresponds to 100% in the pie-chart. See table "2013—Global PV Capacity by Country in MW" for absolute figures.
- ↑ IEA-PVPS trends 2014 (see reference in footer), noted on page 33, that the country had 30 MW installed at the beginning of 2013. Cumulative of 122 MW comes from the difference in IEA-PVPS snapshot 2015 report.
- ↑ Displayed data is EPIA's recalculated DC-figure in megawatt-peak (MWp). Capacity in the original data was reported in AC and amounts to 4,640 MW (cumulative) and 102 MW (installed), as per IEA-PVPS, Trends 2014, p. 34. The conversion results in a difference of approximately 15%. See cited reference.
External links
- IEA–International Energy Agency, Publications
- IEA–PVPS, IEA's Photovoltaic Power System Programme
- NREL–National Renewable Energy Laboratory, Publications
- FHI–ISE, Fraunhofer Institute for Solar Energy Systems
- APVI–Australian PV Institute
- EPIA–European Photovoltaic Industry Association
- SEIA–Solar Energy Industries Association
- CanSIA–Canadian Solar Industries Association
- Presentation on YouTube – Cost analysis of current PV production, PV learning curve – UNSW, Pierre Verlinden, Trina Solar
- Interview on YouTube – Michael Liebreich, "Cheapest Solar in World", about the record-low 5.84 US cents/kWh PPA in Dubai (2014)
References
- 1 2 3 4 5 6 7 8 9 10 11 12 13 14 "Global Market Outlook for Solar Power 2015-2019" (PDF). http://www.solarpowereurope.org/. Solar Power Europe (SPE), formerly known as EPIA – European Photovoltaic Industry Association. Archived from the original on 9 June 2015. Retrieved 9 June 2015. External link in
|website=(help) - 1 2 3 4 5 6 7 8 9 10 11 12 13 14 15 16 17 18 19 20 21 22 23 24 25 26 27 28 29 30 31 32 33 "Global Market Outlook for Photovoltaics 2014-2018" (PDF). http://www.epia.org. EPIA – European Photovoltaic Industry Association. Archived from the original on 12 June 2014. Retrieved 12 June 2014. External link in
|website=(help) - 1 2 3 4 5 6 7 8 9 10 11 12 13 14 15 16 17 18 19 20 21 22 23 24 "Snapshot of Global PV 1992-2014" (PDF). http://www.iea-pvps.org/index.php?id=32. International Energy Agency — Photovoltaic Power Systems Programme. 30 March 2015. Archived from the original on 30 March 2015. External link in
|website=(help) - ↑ "Snapshot of Global PV 1992-2015" (PDF). http://www.iea-pvps.org/. International Energy Agency - Photovoltaic Power Systems Programme. 2015. External link in
|website=(help) - ↑ Lacey, Stephen (12 September 2011). "How China dominates solar power". Guardian Environment Network. Retrieved 29 June 2014.
- 1 2 3 "Crossing the Chasm" (PDF). Deutsche Bank Markets Research. 27 February 2015. Archived from the original on 1 April 2015.
- 1 2 "The projections for the future and quality in the past of the World Energy Outlook for solar PV and other renewable energy technologies" (PDF). Energywatchgroup. September 2015.
- ↑ Osmundsen, Terje (4 March 2014). "How the IEA exaggerates the costs and underestimates the growth of solar power". Energy Post. Archived from the original on 30 October 2014. Retrieved 30 October 2014.
- ↑ Whitmore, Adam (14 October 2013). "Why Have IEA Renewables Growth Projections Been So Much Lower Than the Out-Turn?". The Energy Collective. Archived from the original on 30 October 2014. Retrieved 30 October 2014.
- ↑ "China Targets 70 Gigawatts of Solar Power to Cut Coal Reliance". Bloomberg News. 16 May 2014. Retrieved 16 May 2014.
- 1 2 3 "China's National Energy Administration: 17.8 GW Of New Solar PV In 2015 (~20% Increase)". CleanTechnica. 19 March 2015.
- ↑ http://www.reuters.com/article/china-solar-idUSL3N15533U
- ↑ http://www.businessgreen.com/bg/news/2442764/chinese-solar-capacity-outshone-germanys-in-2015
- ↑ http://cleantechnica.com/2016/01/22/china-overtakes-germany-become-worlds-leading-solar-pv-country/
- 1 2 3 4 5 6 7 8 9 International Energy Agency (2014). "Technology Roadmap: Solar Photovoltaic Energy" (PDF). http://www.iea.org. IEA. Archived from the original on 7 October 2014. Retrieved 7 October 2014. External link in
|website=(help) - 1 2 3 4 "Snapshot of Global PV 1992-2013" (PDF). http://www.iea-pvps.org/index.php?id=trends0. International Energy Agency — Photovoltaic Power Systems Programme. 31 March 2014. Archived from the original on 5 April 2014. External link in
|website=(help) - ↑ http://www.iea-pvps.org/index.php?id=240&eID=dam_frontend_push&docID=2798
- ↑ http://cifes.gob.cl/documentos/reportes-cifes/reporte-cifes-mayo-2016/
- 1 2 3 4 5 6 7 8 9 10 11 12 13 14 15 16 17 18 19 20 21 22 23 24 25 26 27 28 29 30 31 32 33 34 35 36 37 38 39 40 http://resourceirena.irena.org/gateway/dashboard/?topic=4&subTopic=18
- ↑ "Led by China, the United States and Japan, Global Solar Installations to reach Approximately 66.7 GW, reports Mercom Capital Group". MercomCapital. 13 July 2016.
- ↑ "Mercom forecasts 76GW in global PV installations in 2016". PV Tech. Retrieved 1 December 2016.
- ↑ http://www.pv-tech.org/news/ihs-forecasts-global-solar-market-to-top-69gw-in-2016
- ↑ "Launch of Medium-Term Renewable Energy Market Report". IEA. Retrieved 3 August 2015.
- 1 2 3 4 5 "Medium-Term Renewable Energy Market Report 2014 — Executive Summary" (PDF). IEA. 28 August 2014. p. 13. Archived from the original on 1 April 2015.
- ↑ Ash Sharma (13 October 2015). "With Asian and U.S. Deployments Rising, IHS Raises Global 2015 Solar PV Forecast to 59 GW". IHS Technology.
- 1 2 SolarServer, IHS: Global solar PV installations will grow by 30% to reach 57 GW in 2015, 1 April 2015
- 1 2 3 "Top Solar Power Industry Trends for 2015". IHS Technology. 2015. Archived from the original (PDF) on 21 May 2015.
- ↑ "Cost of Solar to Drop Another 20-30% as 2020 Approaches". Solar Plaza. 16 February 2015.
The global PV market in 2015 will likely end up around 54 GW, as we are looking for about 25-30% growth in total volumes by the end of this year .
- ↑ "2014 Outlook: Let the Second Gold Rush Begin" (PDF). Deutsche Bank Markets Research. 6 January 2014. Archived from the original on 22 November 2014. Retrieved 22 November 2014.
- 1 2 3 4 5 "Global Solar Installations Forecast to Reach Approximately 64.7 GW in 2016, Reports Mercom Capital Group". MercomCapital. 28 December 2015.
- ↑ "Mercom Capital Group Forecasts Strong Year Ahead with Global Solar Installations of Approximately 54.5 GW". MercomCapital. March 2015.
- ↑ Michael Liebreich (27 January 2015). "Liebreich: 10 Predictions For Clean Energy In 2015". Bloomberg New Energy Finance. Retrieved February 2015.
Our prediction for solar in 2015 is that the world will add more than 55GW of capacity, and indeed, if the sector gathers steam during the year as we think it might, it could reach as much as 60GW..
Check date values in:|access-date=(help) - 1 2 "Global gross annual capacity additions by technology, 2015–2040". Bloomberg New Energy Finance. 2015.
- ↑ "55 GW of Solar PV Will Be Installed Globally in 2015, Up 36% Over 2014". GreentechMedia. 17 June 2015.
- ↑ "Solar Market Insight Report 2015 Q1". SEIA. 8 June 2015.
- 1 2 3 4 5 6 7 Ash Sharma (30 March 2015). "Global Solar Installations to Grow by 30% to Reach 57 GW in 2015". IHS Technology.
- 1 2 http://cleantechnica.com/ US Solar PV Installations Surpassed 6 GW In 2014, 10 March 2015
- 1 2 "IHS solar analysts at SNEC: Global solar PV demand grows by up to 30%; Need for energy storage rises". SolarServer. 27 April 2015.
- 1 2 "Mercom raises Indian solar installation forecast for 2015 to over 2 GW". SolarServer. 21 May 2015.
- 1 2 3 4 5 "Latin America Country Markets 2014-2015E". GTM Research. 10 May 2015.
- ↑ "Pakistan Solar Park Plugs In 100 MW To Grid". CleanTechnia. 19 June 2015.
- 1 2 "Global PV Market Report 2015–2020, Brochure" (PDF). PV Market Alliance. June 2015. p. 4.
- ↑ "Global Solar PV Capacity to Reach Nearly 500 GW in 2019, IHS Says". IHS Technology. 19 March 2015.
- 1 2 3 4 5 Fraunhofer ISE (February 2015). "Current and Future Cost of Photovoltaics—Long-term Scenarios for Market Development, System Prices and LCOE of Utility-Scale PV Systems" (PDF). http://www.agora-energiewende.org/. Agora Energiewende. Retrieved 1 March 2015. External link in
|website=(help) - ↑ "Lower Oil Price Will Not Stop the Dazzling Rise of Solar Photovoltaic". prnewswire.com. 12 February 2015.
- ↑ "Solar PV Market Installed Capacity Will Reach 489.8 GW By 2020: New Report By Grand View Research, Inc.". Marketwatch. 7 March 2015. Retrieved March 2015. Check date values in:
|access-date=(help) - ↑ "PV Market Alliance forecasts a growing global PV market close to 50 GW in 2015". SolarServer. 15 June 2015.
- ↑ Adam James (17 June 2015). "Global PV Demand Outlook 2015-2020: Exploring Risk in Downstream Solar Markets". GreentechMedia.
- 1 2 "Medium-Term Renewable Energy Market Report 2013 — Executive Summary" (PDF). IEA. 26 June 2013. p. 10. Archived from the original on 5 April 2015.
- ↑ "IEA Medium Term Renewable Energy Market 2015" (PDF). Retrieved november 1 2016. Check date values in:
|access-date=(help) - 1 2 "Medium-Term Renewable Energy Market Report 2014" (PDF). IEA. 28 August 2014. p. 15. Archived from the original on 28 March 2015. Retrieved 28 March 2015.
- ↑ "India Eyes 100 GW Solar Power Capacity By 2022". CleanTechnia. 23 November 2014.
- 1 2 "US: SEIA Forecasts 25-50% Solar Market Growth in 2016". Renewanews. 19 May 2015.
- ↑ "Solar Media forecasts UK solar PV capacity to reach 10 GW at start of 2016". SolarServer. 2 July 2015.
- ↑ IEA.org How solar energy could be the largest source of electricity by mid-century, 29 September 2014
- ↑ Giles Parkinson (24 February 2015). "Solar at 2c/kWh – the cheapest source of electricity". REneweconomy.
- ↑ Militsa Mancheva (9 October 2015). "China again lifts 2015 solar target, now aims at 23.1 GW". Seenew Renewables.
- ↑ "China's PV power capacity to hit 150 gigawatts by 2020". Xinhuanet.com. 13 October 2015.
- ↑ "China Plans to Install 200GW of Wind and 100GW of Solar Power by 2020". EnergyTrend.com. 14 October 2014. Archived from the original on 17 October 2014.
- ↑ "China confirms new solar PV target of 14GW for 2014". Renew Economy.
- 1 2 Solar Installations to Rise 20 Percent in 2014, Thanks to Strong Fourth Quarter, 8 October 2014
- ↑ "China's 2014 Solar Figures Confirmed, 10.6 GW Pushes Country To 30 GW". CleanTechnica.
- ↑ International Business Time, India: World's largest solar plant that will generate 750 MW of power commissioned, 16 February 2015
- ↑ http://mnre.gov.in/file-manager/UserFiles/grid-connected-solar-power-project-installed-capacity.pdf
- ↑ Barclays stuft Anleihen von US-Stromversorgern herunter; Konkurrenz durch Photovoltaik und Energiespeicher. In: solarserver.de, 16. Juni 2014. Abgerufen am 16. Juni 2014.
- 1 2 "Statistics – Solar photovoltaics deployment". gov.uk. DECC – Department of Energy & Climate Change. 2015. Retrieved 26 February 2015.
- ↑ Photon, Italy installed only 385 MW of PV capacity in 2014, 17 March 2015
- ↑ United States Patent and Trademark Office - Database
- ↑ Magic Plates, Tap Sun For Power. Popular Science. June 1931. Retrieved 2 August 2013.
- ↑ "Bell Labs Demonstrates the First Practical Silicon Solar Cell". aps.org.
- ↑ D. M. Chapin-C. S. Fuller-G. L. Pearson. "Journal of Applied Physics — A New Silicon p–n Junction Photocell for Converting Solar Radiation into Electrical Power". aip.org.
- ↑ Biello David (6 August 2010). "Where Did the Carter White House's Solar Panels Go?". Scientific American. Retrieved 31 July 2014.
- ↑ Pollack, Andrew (24 February 1996). "REACTOR ACCIDENT IN JAPAN IMPERILS ENERGY PROGRAM". New York Times.
- ↑ wise-paris.org Sodium Leak and Fire at Monju
- ↑ S Hill, Joshua (January 22, 2016). "China Overtakes Germany To Become World's Leading Solar PV Country". Clean Technica. Retrieved August 16, 2016.
- 1 2 "Price quotes updated weekly – PV spot prices". PV EnergyTrend. Retrieved October 2015. Check date values in:
|access-date=(help) - ↑ "PriceQuotes". http://pv.energytrend.com/. Archived from the original on 26 June 2014. Retrieved 26 June 2014. External link in
|website=(help) - ↑ "Sunny Uplands: Alternative energy will no longer be alternative". The Economist. 21 November 2012. Retrieved 2012-12-28.
- ↑ J. Doyne Farmer, François Lafond (2 November 2015). "How predictable is technological progress?". doi:10.1016/j.respol.2015.11.001. License: cc. Note: Appendix F. A trend extrapolation of solar energy capacity.
- 1 2 "Photovoltaic System Pricing Trends – Historical, Recent, and Near-Term Projections, 2014 Edition" (PDF). NREL. 22 September 2014. p. 4. Archived from the original on 29 March 2015.
- ↑ "Solar PV Pricing Continues to Fall During a Record-Breaking 2014". GreenTechMedia. 13 March 2015.
- ↑ "Photovoltaik-Preisindex" [Solar PV price index]. PhotovoltaikGuide. Retrieved 30 March 2015.
Turnkey net-prices for a solar PV system of up to 100 kWp amounted to Euro 1,240 per kWp.
- ↑ "Solar PV price check". BusinessSpectator. 17 June 2015.
- ↑ RenewableEnergyWorld.com How thin film solar fares vs crystalline silicon, 3 Januar 2011
- ↑ Diane Cardwell; Keith Bradsher (January 9, 2013). "Chinese Firm Buys U.S. Solar Start-Up". The New York Times. Retrieved January 10, 2013.
- ↑ "Photovoltaics Report" (PDF). Fraunhofer ISE. 28 July 2014. Archived from the original on 31 August 2014.
- 1 2 "Photovoltaics Report". Fraunhofer ISE. 28 July 2014. Archived from the original (PDF) on 31 August 2014. Retrieved 31 August 2014.
- ↑ "Solar Frontier Completes Construction of the Tohoku Plant". Solar Frontier. 2 April 2015. Retrieved 30 April 2015.
- ↑ Andorka, Frank (8 January 2014). "CIGS Solar Cells, Simplified". Solar Power World. Archived from the original on 16 August 2014. Retrieved 16 August 2014.
- ↑ "Nyngan Solar Plant". AGL Energy Online. Retrieved 18 June 2015.
- ↑ CleanTechnica.com First Solar Reports Largest Quarterly Decline In CdTe Module Cost Per-Watt Since 2007, 7 November 2013
- ↑ Raabe, Steve; Jaffe, Mark (November 4, 2012). "Bankrupt Abound Solar of Colo. lives on as political football". Denver Post.
- ↑ "The End Arrives for ECD Solar". greentechmedia.com. Retrieved 27 January 2016.
- ↑ "Oerlikon Divests Its Solar Business and the Fate of Amorphous Silicon PV". greentechmedia.com. Retrieved 27 January 2016.
- ↑ SolarChoice.net.au Falling market shares predicted for amorphous silicon PV technology, 5 May 2014
- ↑ GreenTechMedia.com Rest in Peace: The List of Deceased Solar Companies, 6 April 2013
- ↑ "NovaSolar, Formerly OptiSolar, Leaving Smoking Crater in Fremont". greentechmedia.com. Retrieved 27 January 2016.
- ↑ "Chinese Subsidiary of Suntech Power Declares Bankruptcy". New York Times. 20 March 2013.
- ↑ "Suntech Seeks New Cash After China Bankruptcy, Liquidator Says". Bloomberg News. 29 April 2014.
- ↑ Wired.com Silicon Shortage Stalls Solar 28 March 2005
- ↑ "Solar State of the Market Q3 2008 - Rise of Upgraded Metallurgical Silicon". SolarWeb. Lux Research Inc. p. 1. Archived from the original (PDF) on 12 October 2014. Retrieved 12 October 2014.
- 1 2 3 4 5 6 7 8 9 10 11 "IEA PVPS TRENDS 2014 in Photovoltaic Applications" (PDF). http://www.iea-pvps.org/index.php?id=trends. 12 October 2014. Archived from the original on 2 December 2014. External link in
|website=(help) - ↑ "Annual Report 2013/2014" (PDF). ISE.Fraunhofer.de. Fraunhofer Institute for Solar Energy Systems-ISE. 2014. p. 1. Archived from the original on 5 November 2014. Retrieved 5 November 2014.
- ↑ Europa.eu EU initiates anti-dumping investigation on solar panel imports from China
- ↑ U.S. Imposes Anti-Dumping Duties on Chinese Solar Imports, 12 May 2012
- ↑ Europa.eu EU imposes definitive measures on Chinese solar panels, confirms undertaking with Chinese solar panel exporters, 02 December 2013
- ↑ "China to levy duties on US polysilicon imports". China Daily. 16 September 2013. Archived from the original on 30 April 2015.
- ↑ "Wacker, OCI benefiting from China's polysilicon duties". PV magazine. 30 January 2014. Archived from the original on 30 April 2015.
- 1 2 3 4 5 6 7 "Statistical Review of World Energy – Historical Data Workbook BP". http://www.bp.com/en/global/corporate/about-bp/energy-economics/statistical-review-of-world-energy.html. BP. Retrieved April 2015.
downloadable XL-spread sheet
Check date values in:|access-date=(help); External link in|website=(help) - ↑ http://www.solarpowereurope.org/insights/new-global-market-outlook-2016/
- 1 2 3 "Global Market Outlook for Photovoltaics 2013–2017" (PDF). http://www.epia.org. EPIA – European Photovoltaic Industry Association. Archived from the original on 6 November 2014. Retrieved 6 November 2014. External link in
|website=(help) - 1 2 3 "Global Market Outlook for Photovoltaics until 2016" (PDF). http://www.epia.org. EPIA – European Photovoltaic Industry Association. Archived from the original on 6 November 2014. Retrieved 6 November 2014. External link in
|website=(help) - ↑ "Global Market Outlook for Photovoltaics until 2015". http://www.epia.org. EPIA – European Photovoltaic Industry Association. Archived from the original on 6 November 2014. Retrieved 6 November 2014. External link in
|website=(help) - ↑ "Global Market Outlook for Photovoltaics until 2014". http://www.epia.org. EPIA – European Photovoltaic Industry Association. Archived from the original on 6 November 2014. Retrieved 6 November 2014. External link in
|website=(help) - ↑ "Global Market Outlook for Photovoltaics until 2013" (PDF). http://ec.europa.eu. EPIA – European Photovoltaic Industry Association. Archived from the original on 6 November 2014. Retrieved 6 November 2014. External link in
|website=(help) - ↑ "Global Market Outlook for Photovoltaics until 2012" (PDF). http://www.epia.org/. EPIA – European Photovoltaic Industry Association. Archived from the original on 2 April 2015. Retrieved 2 April 2015. External link in
|website=(help) - 1 2 3 4 EUROBSER'VER (April 2015). "Photovoltaic Barometer - installations 2013 and 2014" (PDF). http://www.energies-renouvelables.org. Archived from the original on 6 May 2015. External link in
|website=(help) - 1 2 3 EUROBSER'VER. "Photovoltaic Barometer - installations 2012 and 2013" (PDF). http://www.energies-renouvelables.org. Archived from the original on 9 September 2014. Retrieved 1 May 2014. External link in
|website=(help) - 1 2 EUROBSER'VER. "Photovoltaic Barometer - installations 2011 and 2012". http://www.energies-renouvelables.org. p. 7. Archived from the original (PDF) on 16 June 2014. Retrieved 1 May 2013. External link in
|website=(help) - 1 2 3 4 EUROBSER'VER. "Photovoltaic Barometer - installations 2010 and 2011". http://www.energies-renouvelables.org. p. 6. Archived from the original (PDF) on 16 June 2014. Retrieved 1 May 2013. External link in
|website=(help) - 1 2 EUROBSER'VER. "Photovoltaic Barometer - installations 2009 and 2010". http://www.energies-renouvelables.org. p. 4. Archived from the original (PDF) on 16 June 2014. Retrieved 1 May 2013. External link in
|website=(help) - ↑ EUROBSER'VER. "Photovoltaic Barometer - installations 2008 and 2009". http://www.energies-renouvelables.org. p. 5. Archived from the original (PDF) on 16 June 2014. Retrieved 1 May 2013. External link in
|website=(help) - ↑ eurobserv-er.org EUROBSER'VER - Observatoire des énergies renouvelables
- ↑ ec.europa.eu European Commission Energy Intelligent Energy Europe
- 1 2 "IEA PVPS TRENDS 2013 in Photovoltaic Applications" (PDF). http://www.iea-pvps.org/index.php?id=92. 29 November 2013. Archived from the original on 17 March 2015. External link in
|website=(help) - ↑ "Snapshot of Global PV 1992-2012" (PDF). http://www.iea-pvps.org/. International Energy Agency - Photovoltaic Power Systems Programme. 2013. Archived from the original on 1 December 2014. External link in
|website=(help) - 1 2 3 "TRENDS IN PHOTOVOLTAIC APPLICATIONS – Survey report of selected IEA countries between 1992 and 2010". http://www.iea-pvps.org/. International Energy Agency - Photovoltaic Power Systems Programme. 2011. Retrieved 28 December 2014. External link in
|website=(help) - 1 2 3 "TRENDS IN PHOTOVOLTAIC APPLICATIONS – Survey report of selected IEA countries between 1992 and 2009". http://www.iea-pvps.org/. International Energy Agency - Photovoltaic Power Systems Programme. 2010. Retrieved 28 December 2014. External link in
|website=(help) - 1 2 3 "TRENDS IN PHOTOVOLTAIC APPLICATIONS – Survey report of selected IEA countries between 1992 and 2008". http://www.iea-pvps.org/. International Energy Agency - Photovoltaic Power Systems Programme. 2009. Retrieved 28 December 2014. External link in
|website=(help) - 1 2 3 4 "Trends in Photovoltaic Applications – Survey report of selected IEA countries between 1992 and 2006" (PDF). August 2007. Archived from the original on 1 May 2015. Retrieved 30 April 2015.
- ↑ IEA-PVPS, Annual Report 2014 (AR2014), pp. 38–110, 21 May 2015
- 1 2 Centro de Energías Renovables, CORFO (July 2014). "Reporte CER". Retrieved 22 July 2014.
- ↑ Trends Preview 2011
- 1 2 "FRB: G.5A Release--Foreign Exchange Rates--Release Dates". federalreserve.gov. Retrieved 27 January 2016.
- 1 2 iea-pvps.org PV Power (2007-June)
- 1 2 3 4 5 6 7 8 9 10 11 12 13 14 15 16 17 18 19 20 21 EurObserv'ER (April 2007). "EurObserv'ER – Photovoltaic Energy Barometer" (PDF). Le Journal des Énergies Renouvelables n° 178: 49–70. Retrieved 7 September 2007.
- 1 2 EurObserv'ER, (Includes Some Discredited/Preliminary Sources) (April 2007). "EurObserv'ER – Photovoltaic Energy Barometer". Le Journal des Énergies Renouvelables n° 178]: 49–70. Retrieved 7 September 2007.
- 1 2 3 Dr. Wissing, Lothar; Jülich, Forschungszentrum; Jülich, Projektträger (May 2007). "National Survey Report of PV Power Applications in Germany 2006 – Version 2" (PDF). PVPS Programme NSRs for Germany. Retrieved 20 October 2007.
- 1 2 Ikki, Osamu; Matsubara, Koji (25 May 2007). "National Survey Report of PV Power Applications in Japan 2006" (PDF). PVPS Programme NSRs for Japan. Retrieved 20 October 2007.
- 1 2 Pedigo, Susannah; Maycock, Paul D.; Bower, Ward (30 August 2007). "National Survey Report of PV Power Applications in The United States of America 2006 – Version 14" (PDF). PVPS Programme NSRs for the USA]. Retrieved 20 October 2007.
- 1 2 Guastella, Salvatore; Castello, Salvatore; Anna De Lillo (May 2007). "National Survey Report of PV Power Applications in Italy 2006" (PDF). PVPS Programme NSRs for Italy]. Retrieved 20 October 2007.
- 1 2 Watt, Muriel (May 2007). "National Survey Report of PV Power Applications in Australia 2006" (PDF). PVPS Programme NSRs for Australia. Retrieved 16 October 2007.
- 1 2 Yoon, Kyung-Hoon; Kim, Donghwan; Yoon, Kyung Shick (May 2007). "National Survey Report of PV Power Applications in Korea 2006" (PDF). PVPS Programme NSRs for the Republic of Korea]. Retrieved 20 October 2007.
- ↑ Claverie, André; Equer, Bernard (15 July 2007). "Solar Photovoltaic Electricity Applications in France National Survey Report 2006" (PDF). http://www.iea-pvps.org/. Archived from the original (PDF) on 2008-06-25. Retrieved 13 March 2008. External link in
|journal=(help) - 1 2 Swens, Job (May 2007). "National Survey Report of PV Power Applications in The Netherlands 2006" (PDF). PVPS Programme NSRs for the Netherlands]. Retrieved 20 October 2007.
- 1 2 Hüsser, Pius; Hostettler, Thomas (2006). "National Survey Report on PV Power Applications in Switzerland 2006". IEA-PVPS International Energy Agency. Archived from the original (PDF) on 22 July 2014. Retrieved 22 July 2014.
- 1 2 Ayoub, Josef; Martel, Sylvain; Dr Dignard-Bailey, Lisa (May 2007). "National Survey Report of PV Power Applications in Canada 2006" (PDF). PVPS Programme NSRs for Canada]. Retrieved 16 October 2007.
- 1 2 Davidson, Sarah (October 2007). "National Survey Report of PV Power Applications in the United Kingdom 2006" (PDF). PVPS Programme NSRs for the United Kingdom]. Retrieved 16 March 2008.
- 1 2 Bugge, Lars; Salvesen, Fritjof (30 May 2007). "National Survey Report of PV Power Applications in Norway 2006" (PDF). PVPS Programme NSRs for Norway. Retrieved 20 October 2007.
- 1 2 Malm, Ulf; Stolt, Lars (May 2007). "National Survey Report of PV Power Applications in Sweden 2006" (PDF). PVPS Programme NSRs for Sweden. Retrieved 20 October 2007.
- 1 2 Ahm, Peter (May 2007). "National Survey Report of PV Power Applications in Denmark 2006 – Version 04" (PDF). PVPS Programme NSRs for Denmark. Retrieved 20 October 2007.
- 1 2 Dr. Siderer, Yona; Dann, Roxana (May 2007). "National Survey Report of PV Power Applications in Israel 2006 – Version 14" (PDF). PVPS Programme NSRs for Israel. Retrieved 20 October 2007.
- ↑ Blakers, Andrew W. (2000). "Solar and Wind Electricity in Australia" (PDF). Australian Journal of Environmental Management. 7: 223–236. Archived from the original (– Scholar search) on 31 August 2007. Retrieved 14 February 2008.
- ↑ Prometheus Institute, Preliminary Data Hearsay Reference (April 2007). "Eco-Economy Indicators: SOLAR POWER – Data – 23rd Annual Data Collection – Final". PVNews, vol. 26, no. 4, pp. 8–9. Retrieved 14 April 2008.
- ↑ Gulabrai, Lalchand; Ruoss, Daniel; Chen, Wei-nee; Ir Ahmad Hadri Haris (April 2007). "National Survey Report of PV Power Applications in Malaysia 2006 – Version 14" (PDF). http://www.iea-pvps.org/index.html PVPS Programme – NSRs for Malaysia]. Retrieved 20 October 2007. External link in
|journal=(help) - ↑ "Total photovoltaic power installed in IEA PVPS countries". Archived from the original on 2006-07-11. Retrieved 24 July 2007.
- ↑ "Table 1: Installed PV power in reporting IEA PVPS countries as of the end of 2005". iea-pvps.org. Archived from the original on 2006-10-07.
- ↑ Total photovoltaic power installed in IEA PVPS countries
- ↑ PV Barometre at the end of 2013, page 6
- ↑ "Photovoltaic stations". T-Solar Group. Retrieved 16 May 2015.
Repartición solar farm, Location: Municipalidad Distrital La Joya. Province: Arequipa. Power: 22 MWp
- ↑ "Latin America's Largest Solar Power Plant Receiving 40 MW of Solar PV Modules from Yingli Solar (Peru)". CleanTechnica. 15 October 2012.
- ↑ "Why DECC struggles to keep up with solar PV capacity data…and why we don't". Solar Power Portal. 26 June 2015.