List of countries by HIV/AIDS adult prevalence rate

The human immunodeficiency virus (HIV), which causes AIDS, varies in prevalence from nation to nation. Listed here are the prevalence rates among adults in various countries, based on data from various sources, largely the CIA World Factbook.[2][3][4] As of 2009, it is estimated that there are 33.3 million people worldwide infected with HIV.[5]
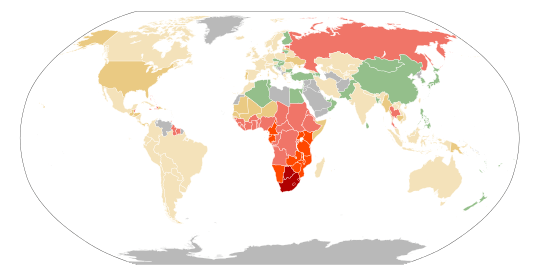
The HIV pandemic is most severe in Sub-Saharan Africa. Over 60% of all people living with HIV reside within the region. Adult HIV prevalence exceed 20% in Swaziland, Botswana, and Lesotho, while an additional six countries report adult HIV prevalence of at least 10%. In terms of raw HIV case numbers, South Africa has largest population living with HIV (6.3 million), followed by Nigeria (3.2 million), and India (2.1 million) by the end of 2013.[6][7] While South Africa's large population of HIV-positive people is attributable to its high disease prevalence (17.3%), neither Nigeria (3.7%) nor India (0.3%) are particularly noteworthy in this regard. Rather, their high population of HIV-positive people is an artifact of very large national populations—174 million and 1.25 billion, respectively.[2]
On the other end of the spectrum, Svalbard is reported as having no cases of HIV/AIDS, while Bhutan has a much larger population but still only an estimated 246 cases through 2011.[8] Countries such as Afghanistan, and Cape Verde are reported to have the lowest prevalence of the disease, at less than 0.1% of their populations.[2]
As the majority of people infected with HIV are unaware of their status, it is reasonable to expect that there may be significant cases of under-reporting and inaccuracies in certain listed statistics. Estimates may vary wildly between source or between years as old information is discarded and new information is acquired. Documented cases lists do not give an accurate description of the epidemic, but do attempt to quantify actual known cases, as well as documented cumulative impact.
HIV/AIDS prevalence estimates
This data was sourced from the CIA World Factbook.[9]
| Country | Adult (15-49) prevalence % |
People with HIV/AIDS |
Date of
data |
Annual deaths |
Ref | Date of data |
|---|---|---|---|---|---|---|
| |
0.04 | 6,700 | 2014 | [4] | NA | |
| |
0.47 | 126,600 | 2014 | 2,900 | [4] | 2011 est. |
| |
0.17 | 28,700 | 2014 | 100 | [4] | 2011 est. |
| |
0.4 | 9,800 | 2011 | 100 | [4] | 2011 est. |
| |
0.14 | 8,400 | 2014 | 100 | [4] | 2011 est. |
| |
3.22 | 7,700 | 2014 | 200 | [4] | 2011 est. |
| |
0.3 | 2011 | 200 | [4] | 2011 est. | |
| |
0.01 | 8,900 | 2014 | 500 | [4] | 2011 est. |
| |
0.88 | 1,500 | 2014 | 100 | [4] | 2011 est. |
| |
0.52 | 29,400 | 2014 | 1,100 | [4] | 2011 est. |
| |
0.3 | 15,000 | 2011 | 100 | [4] | 2011 est. |
| |
1.18 | 3,300 | 2014 | 500 | [4] | 2011 est. |
| |
1.14 | 77,900 | 2014 | 3,300 | [4] | 2011 est. |
| |
0.3 | 163 | 2011 | 392 | [4] | 2011 |
| |
0.13 | 600 | 2014 | 200 | [4] | 2011 est. |
| |
0.29 | 17,900 | 2014 | 500 | [4] | 2011 est. |
| |
0.1 | 900 | 2011 | 100 | [4] | 2011 est. |
| |
25.16 | 392,400 | 2014 | 11,000 | [4] | 2011 est. |
| |
0.55 | 726,000 | 2014 | 15,000 | [4] | 2011 est. |
| |
0.1 | 200 | 2011 | 200 | [4] | 2011 est. |
| |
0.1 | 3,800 | 2011 | 200 | [4] | 2011 est. |
| |
0.94 | 107,700 | 2014 | 9,200 | [4] | 2011 est. |
| |
0.69 | 212,600 | 2014 | 25,000 | [4] | 2011 est. |
| |
1.11 | 84,700 | 2014 | 11,000 | [4] | 2011 est. |
| |
0.64 | 74,600 | 2014 | 6,900 | [4] | 2011 est. |
| |
4.77 | 657,500 | 2014 | 39,000 | [4] | 2011 est. |
| |
0.3 | 73,000 | 2011 | 500 | [4] | 2011 est. |
| |
1.09 | 3,400 | 2014 | 225 | [4] | NA* |
| |
4.25 | 135,400 | 2014 | 11,000 | [4] | 2011 est. |
| |
2.53 | 215,000 | 2014 | 11,100 | [4] | 2011 est. |
| |
0.29 | 39,300 | 2014 | [4] | NA* | |
| |
0.10 | 780,000 | 2014 | 26,000 | [4] | 2011 est. |
| |
0.40 | 124,400 | 2014 | 9,800 | [4] | 2011 est. |
| |
0.1 | 500 | 2011 | 100 | [4] | 2011 est. |
| |
1.04 | 446,600 | 2014 | 100,000 | [4] | 2011 est. |
| |
2.75 | 80,700 | 2014 | 5,100 | [4] | 2011 est. |
| |
0.26 | 8,800 | 2014 | 200 | [4] | 2011 est. |
| |
3.46 | 460,100 | 2014 | 38,000 | [4] | 2011 est. |
| |
0.1 | 200 | 2011 | 10 | [4] | 2011 est. |
| |
0.25 | 17,100 | 2014 | 100 | [4] | 2011 est. |
| |
0.06 | 400 | 2014 | [4] | NA | |
| |
0.05 | 3,400 | 2014 | 8 | [10] | 2015 |
| |
0.16 | 6,000 | 2014 | 100 | [4] | 2011 est. |
| |
1.59 | 9,900 | 2014 | 1,100 | [4] | 2011 est. |
| |
0.68 | 69,300 | 2014 | 4,100 | [4] | 2011 est. |
| |
0.34 | 32,700 | 2014 | 1,400 | [4] | 2011 est. |
| |
0.02 | 8,800 | 2014 | 500 | [4] | 2011 est. |
| |
0.53 | 20,900 | 2014 | 1,700 | [4] | 2011 est. |
| |
6.16 | 31,600 | 2014 | 370 | [4] | 2011 est. |
| |
0.68 | 16,100 | 2014 | 1,700 | [4] | 2011 est. |
| |
1.30 | 8,600 | 2014 | 500 | [4] | 2011 est. |
| |
1.15 | 730,300 | 2014 | 67,000 | [4] | 2011 est. |
| |
0.13 | 700 | 2014 | 100 | [4] | 2011 est. |
| |
0.1 | 2,400 | 2011 | 100 | [4] | 2011 est. |
| |
0.4 | 140,000 | 2011 | 1,600 | [4] | 2011 est. |
| |
3.91 | 47,500 | 2014 | 2,300 | [4] | 2011 est. |
| |
1.82 | 20,300 | 2014 | 600 | [4] | 2011 est. |
| |
0.28 | 6,600 | 2014 | 200 | [4] | 2011 est. |
| |
0.15 | 77,500 | 2014 | 500 | [4] | 2011 est. |
| |
1.47 | 250,200 | 2014 | 21,000 | [4] | 2011 est.[11] |
| |
0.2 | 11,000 | 2011 | 100 | [4] | 2011 est. |
| |
0.1 | 100 | 2011 | [4] | NA | |
| |
0.54 | 49,100 | 2014 | 3,900 | [4] | 2011 est. |
| |
1.55 | 118,000 | 2014 | 4,500 | [4] | 2011 est. |
| |
3.69 | 42,000 | 2014 | 1,100 | [4] | 2011 est. |
| |
1.81 | 9,700 | 2014 | 1,000 | [4] | 2011 est. |
| |
1.93 | 141,300 | 2014 | 7,200 | [4] | 2011 est. |
| |
0.42 | 23,000 | 2014 | 1,900 | [4] | 2011 est. |
| |
0.1 | 2,600 | 2011 | 200 | [4] | 2011 est. |
| |
0.1 | 3,300 | 2011 | 100 | [4] | 2011 est. |
| |
0.3 | 220 | 2011 | 100 | [4] | 2011 est. |
| |
0.26 | 2,079,700 | 2014 | 130,000 | [4] | 2013 est. |
| |
0.47 | 660,300 | 2014 | 8,700 | [4] | 2011 est. |
| |
0.14 | 74,400 | 2014 | 4,300 | [4] | 2011 est. |
| |
0.1 | 500 | 2011 | [4] | NA | |
| |
0.28 | 8,000 | 2014 | 100 | [4] | 2011 est. |
| |
0.2 | 5,100 | 2011 | 200 | [4] | 2011 est. |
| |
0.28 | 122,000 | 2014 | 1,900 | [4] | 2011 est. |
| |
1.62 | 29,400 | 2014 | 1,500 | [4] | 2011 est. |
| |
0.1 | 8,100 | 2011 | 100 | [4] | 2011 est. |
| |
0.1 | 600 | 2011 | 500 | [4] | 2011 est. |
| |
0.19 | 20,300 | 2014 | 500 | [4] | 2011 est. |
| |
5.30 | 1,366,900 | 2014 | 80,000 | [4] | 2011 est. |
| |
0.1 | 9,500 | 2011 | 500 | [4] | 2011 est. |
| |
0.1 | 2011 | [4] | NA | ||
| |
0.26 | 9,300 | 2014 | 200 | [4] | 2011 est. |
| |
0.26 | 11,100 | 2014 | 100 | [4] | 2011 est. |
| |
0.7 | 10,000 | 2011 | 500 | [4] | 2011 est. |
| |
0.06 | 1,800 | 2014 | 200 | [4] | 2011 est. |
| |
23.39 | 314,600 | 2014 | 18,000 | [4] | 2011 est. |
| |
1.0 | 33,100 | 2011 | 2,300 | [4] | 2011 est. |
| |
0.3 | 10,000 | 2011 | [4] | NA | |
| |
0.1 | 2,200 | 2011 | 200 | [4] | 2011 est. |
| |
0.3 | 500 | 2011 | 100 | [4] | 2011 est. |
| |
0.01 | 200 | 2014 | 100 | [4] | 2011 est. |
| |
0.29 | 39,100 | 2014 | 1,000 | [4] | 2011 est. |
| |
10.04 | 1,063,900 | 2014 | 68,000 | [4] | 2011 est. |
| |
0.45 | 100,800 | 2014 | 3,900 | [4] | 2011 est. |
| |
0.01 | 100 | 2014 | 100 | [4] | 2011 est. |
| |
1.42 | 133,400 | 2014 | 5,800 | [4] | 2011 est. |
| |
0.1 | 500 | 2011 | 100 | [4] | 2011 est. |
| |
0.66 | 15,900 | 2014 | 1,000 | [4] | 2011 est. |
| |
0.92 | 8,300 | 2014 | 100 | [4] | 2011 est. |
| |
0.23 | 194,100 | 2014 | 11,000 | [4] | 2011 est. |
| |
0.63 | 17,600 | 2014 | 100 | [4] | 2011 est. |
| |
0.04 | 600 | 2014 | 100 | [4] | 2011 est. |
| |
0.14 | 28,700 | 2014 | 1,000 | [4] | 2011 est. |
| |
10.58 | 1,543,000 | 2014 | 74,000 | [4] | 2011 est. |
| |
15.97 | 245,400 | 2014 | 5,100 | [4] | 2011 est. |
| |
0.20 | 38,800 | 2014 | 5,000 | [4] | 2011 est. |
| |
0.2 | 22,000 | 2011 | 200 | [4] | 2011 est. |
| |
0.1 | 2,500 | 2011 | 100 | [4] | 2011 est. |
| |
0.27 | 6,600 | 2014 | 500 | [4] | 2011 est. |
| |
0.49 | 40,500 | 2014 | 4,000 | [4] | 2011 est. |
| |
3.17 | 3,228,600 | 2014 | 210,000 | [6] | 2013 est. |
| |
0.15 | 2014 | 100 | [4] | 2011 est. | |
| |
0.16 | 2014 | 100 | [4] | 2011 est. | |
| |
0.09 | 68,000 | 2014 | 5,100 | [4] | 2011 est. |
| |
0.65 | 15,500 | 2014 | 1,000 | [4] | 2011 est. |
| |
0.72 | 31,900 | 2014 | 1,000 | [4] | 2011 est. |
| |
0.41 | 16,800 | 2014 | 1,000 | [4] | 2011 est. |
| |
0.36 | 71,900 | 2014 | 3,300 | [4] | 2011 est. |
| |
0.06 | 35,600 | 2014 | 200 | [4] | 2011 est. |
| |
0.07 | 2014 | 200 | [4] | 2011 est. | |
| |
0.7 | 34,000 | 2011 | 500 | [4] | 2011 est. |
| |
0.1 | 200 | 2011 | 100 | [4] | 2011 est. |
| |
0.11 | 16,200 | 2014 | 350 | [4] | 2011 est. |
| |
1.1 | 980,000 | 2011 | 13,000 | [4] | 2011 est. |
| |
2.82 | 210,500 | 2014 | 7,800 | [4] | 2011 est. |
| |
0.1 | 10,000 | 2011 | 300 | [4] | 2011 est. |
| |
0.53 | 44,000 | 2014 | 1,800 | [4] | 2011 est. |
| |
0.05 | 3,000 | 2014 | 100 | [4] | 2011 est. |
| |
1.40 | 54,000 | 2014 | 3,300 | [4] | 2011 est. |
| |
0.1 | 4,200 | 2011 | 200 | [4] | 2011 est. |
| |
0.02 | 2014 | 100 | [4] | 2011 est. | |
| |
0.08 | 900 | 2014 | 100 | [4] | 2011 est. |
| |
0.55 | 34,900 | 2014 | [4] | 2011 est. | |
| |
18.92 | 6,836,500 | 2014 | 200,000 | [6] | 2013 est. |
| |
2.71 | 193,400 | 2014 | [4] | NA | |
| |
0.42 | 150,400 | 2014 | 2,300 | [4] | 2011 est. |
| |
0.03 | 3,300 | 2014 | 200 | [4] | 2011 est. |
| |
0.25 | 53,200 | 2014 | 12,000 | [4] | 2011 est. |
| |
1.02 | 3,800 | 2014 | 500 | [4] | 2011 est. |
| |
27.73 | 214,300 | 2014 | 10,000 | [4] | 2011 est. |
| |
0.18 | 2014 | 100 | [4] | 2011 est. | |
| |
0.35 | 20,200 | 2014 | 500 | [4] | 2011 est. |
| |
0.01 | 900 | 2014 | 10 | [4] | 2012 est. |
| |
0.1 | 23,492 | 2011 | 351 | [12] | 2013 |
| |
0.35 | 16,400 | 2014 | 500 | [4] | 2011 est. |
| |
5.34 | 1,499,400 | 2014 | 86,000 | [4] | 2011 est. |
| |
1.13 | 445,600 | 2014 | 28,000 | [4] | 2011 est. |
| |
2.40 | 113,700 | 2014 | 9,100 | [4] | 2011 est. |
| |
1.65 | 14,000 | 2014 | 1,900 | [4] | 2011 est. |
| |
0.04 | 2,700 | 2014 | 200 | [4] | 2011 est. |
| |
0.1 | 4,600 | 2011 | 200 | [4] | 2011 est. |
| |
0.1 | 200 | 2011 | 100 | [4] | 2011 est. |
| |
7.25 | 1,486,600 | 2014 | 77,000 | [4] | 2011 est. |
| |
0.83 | 210,700 | 2014 | 19,000 | [4] | 2011 est. |
| |
0.2 | 2011 | [4] | NA | ||
| |
0.33 | 126,700 | 2014 | 500 | [4] | 2011 est. |
| |
0.6 | 1,148,200 | 2011 | 17,000 | [4] | 2011 est. |
| |
0.70 | 14,400 | 2014 | 500 | [4] | 2011 est. |
| |
0.15 | 32,300 | 2014 | 500 | [4] | 2011 est. |
| |
0.55 | 106,900 | 2014 | 4,100 | [4] | 2011 est. |
| |
0.47 | 250,200 | 2014 | 24,000 | [4] | 2011 est. |
| |
0.05 | 7,200 | 2014 | [4] | NA | |
| |
12.37 | 1,150,400 | 2014 | 56,000 | [4] | 2011 est. |
| |
16.74 | 1,550,300 | 2014 | 140,000 | [4] | 2011 est. |
An asterisk * indicates that the CIA World Factbook lists this piece of data as not having an available source.
See also
By region:
- HIV/AIDS in Africa
- HIV/AIDS in Asia
- HIV/AIDS in Europe
- HIV/AIDS in North America
- HIV/AIDS in South America
References
![]() This article incorporates public domain material from the CIA World Factbook website https://www.cia.gov/library/publications/the-world-factbook/index.html.
This article incorporates public domain material from the CIA World Factbook website https://www.cia.gov/library/publications/the-world-factbook/index.html.
- ↑ "HIV prevalence per country, world map". UNAIDS.org. Retrieved 20 November 2016.
- 1 2 3 Central Intelligence Agency (2011). "CIA World Factbook - HIV/AIDS adult prevalence rate". Retrieved 2011. Check date values in:
|access-date=(help) - ↑ Central Intelligence Agency (2011). "CIA World Factbook 2011 - people living with the HIV virus". Retrieved 2011. Check date values in:
|access-date=(help) - 1 2 3 4 5 6 7 8 9 10 11 12 13 14 15 16 17 18 19 20 21 22 23 24 25 26 27 28 29 30 31 32 33 34 35 36 37 38 39 40 41 42 43 44 45 46 47 48 49 50 51 52 53 54 55 56 57 58 59 60 61 62 63 64 65 66 67 68 69 70 71 72 73 74 75 76 77 78 79 80 81 82 83 84 85 86 87 88 89 90 91 92 93 94 95 96 97 98 99 100 101 102 103 104 105 106 107 108 109 110 111 112 113 114 115 116 117 118 119 120 121 122 123 124 125 126 127 128 129 130 131 132 133 134 135 136 137 138 139 140 141 142 143 144 145 146 147 148 149 150 151 152 153 154 155 156 157 158 159 160 161 162 163 164 165 Central Intelligence Agency (2011). "CIA World Factbook 2011 - deaths". Retrieved 2011. Check date values in:
|access-date=(help) - ↑ "Worldwide AIDS & HIV Statistics". AVERT. 31 December 2009. Archived from the original on 2011-04-06. Retrieved 26 January 2011.
- 1 2 3 "HIV and AIDS estimates (2013)".
- ↑ "India has 3rd-highest number of HIV-infected people: UN".
- ↑ "The Ministry of Health has Detected…". Bhutan Observer online. 2011-08-01. Retrieved 2011-11-21.
- ↑ "HIV/AIDS - ADULT PREVALENCE RATE". CIA World Factbook.
- ↑ The National Institute of Public Health (Czech Republic). (PDF).
- ↑ News Ghana (2015). "W/R places 5th on regional HIV/AIDS prevalence rating". Retrieved 2015. Check date values in:
|access-date=(help) - ↑ Centers for Disease Control, ROC (Taiwan). (accessed Sep 30, 2014).
External links
- HIV/AIDS Survey Indicators Database
- World Health Organisation; Prevalence of HIV among adults aged 15 to 49 (%) by country
- World Health Organisation; Number of deaths due to AIDS by country
- World Health Organisation; Number of people (all ages) living with HIV by country