List of cities in North Dakota
Map of the United States with North Dakota highlighted
North Dakota is a state located in the Midwestern United States. All incorporated communities in North Dakota are considered cities, regardless of size; there are no towns, villages, or hamlets in the state.
Cities

Fargo, largest city in North Dakota
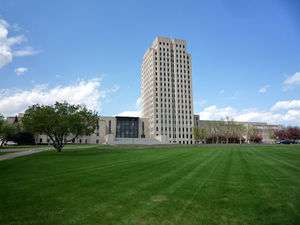
Bismarck, capital of North Dakota

Downtown Grand Forks
| 2015 Rank | City | 2015 Estimate[1] | 2010 Census[2] | Change | County |
|---|---|---|---|---|---|
| 1 | Fargo | 118,523 | 105,549 | +12.29% | Cass |
| 2 | Bismarck | 71,167 | 61,272 | +16.15% | Burleigh |
| 3 | Grand Forks | 57,011 | 52,838 | +7.90% | Grand Forks |
| 4 | Minot | 49,450 | 40,888 | +20.94% | Ward |
| 5 | West Fargo | 33,597 | 25,830 | +30.07% | Cass |
| 6 | Williston | 26,977 | 14,716 | +83.32% | Williams |
| 7 | Dickinson | 23,765 | 17,787 | +33.61% | Stark |
| 8 | Mandan | 21,382 | 18,331 | +16.64% | Morton |
| 9 | Jamestown | 15,422 | 15,427 | −0.03% | Stutsman |
| 10 | Wahpeton | 7,899 | 7,766 | +1.71% | Richland |
| 11 | Devils Lake | 7,351 | 7,141 | +2.94% | Ramsey |
| 12 | Watford City | 6,708 | 1,744 | +284.63% | McKenzie |
| 13 | Valley City | 6,669 | 6,585 | +1.28% | Barnes |
| 14 | Grafton | 4,243 | 4,284 | −0.96% | Walsh |
| 15 | Lincoln | 3,519 | 2,406 | +46.26% | Burleigh |
| 16 | Beulah | 3,393 | 3,121 | +8.72% | Mercer |
| 17 | Rugby | 2,846 | 2,876 | −1.04% | Pierce |
| 18 | Stanley | 2,721 | 1,458 | +86.63% | Mountrail |
| 19 | Horace | 2,545 | 2,430 | +4.73% | Cass |
| 20-(T) | Casselton | 2,521 | 2,329 | +8.24% | Cass |
| 20-(T) | New Town | 2,521 | 1,925 | +30.96% | Mountrail |
| 22 | Hazen | 2,488 | 2,411 | +3.19% | Mercer |
| 23 | Bottineau | 2,343 | 2,211 | +5.97% | Bottineau |
| 24 | Lisbon | 2,145 | 2,154 | −0.42% | Ransom |
| 25 | Carrington | 2,072 | 2,065 | +0.34% | Foster |
| 26 | Mayville | 1,829 | 1,858 | −1.56% | Traill |
| 27 | Oakes | 1,797 | 1,856 | −3.18% | Dickey |
| 28 | Langdon | 1,787 | 1,878 | −4.85% | Cavalier |
| 29 | Harvey | 1,779 | 1,783 | −0.22% | Wells |
| 30 | Bowman | 1,744 | 1,650 | +5.70% | Bowman |
| 31 | Tioga | 1,643 | 1,230 | +33.58% | Williams |
| 32 | Hillsboro | 1,580 | 1,603 | −1.43% | Traill |
| 33 | Garrison | 1,538 | 1,453 | +5.85% | McLean |
| 34 | Crosby | 1,408 | 1,070 | +31.59% | Divide |
| 35 | New Rockford | 1,390 | 1,391 | −0.07% | Eddy |
| 36 | Park River | 1,375 | 1,403 | −2.00% | Walsh |
| 37 | Surrey | 1,358 | 934 | +45.40% | Ward |
| 38 | Rolla | 1,325 | 1,280 | +3.52% | Rolette |
| 39 | Larimore | 1,313 | 1,346 | −2.45% | Grand Forks |
| 40 | Washburn | 1,308 | 1,246 | +4.98% | McLean |
| 41 | Ellendale | 1,299 | 1,394 | −6.81% | Dickey |
| 42 | Parshall | 1,263 | 903 | +39.87% | Mountrail |
| 43 | Velva | 1,260 | 1,084 | +16.24% | McHenry |
| 44 | Hettinger | 1,257 | 1,226 | +2.53% | Adams |
| 45 | Killdeer | 1,254 | 751 | +66.98% | Dunn |
| 46 | Cavalier | 1,244 | 1,302 | −4.45% | Pembina |
| 47 | Burlington | 1,181 | 1,060 | +11.42% | Ward |
| 48 | Cando | 1,122 | 1,115 | +0.63% | Towner |
| 49 | Beach | 1,115 | 1,019 | +9.42% | Golden Valley |
| 50 | Kenmare | 1,083 | 1,096 | −1.19% | Ward |
| 51 | Belfield | 1,055 | 800 | +31.88% | Stark |
| 52 | Linton | 1,039 | 1,097 | −5.29% | Emmons |
| 53 | Thompson | 1,005 | 986 | +1.93% | Grand Forks |
| 54 | Wishek | 988 | 1,002 | −1.40% | McIntosh |
| 55 | Walhalla | 951 | 996 | −4.52% | Pembina |
| 56 | Cooperstown | 945 | 984 | −3.96% | Griggs |
| 57 | Northwood | 927 | 945 | −1.90% | Grand Forks |
| 58 | LaMoure | 914 | 889 | +2.81% | LaMoure |
| 59 | Hankinson | 908 | 919 | −1.20% | Richland |
| 60 | New Salem | 896 | 946 | −5.29% | Morton |
| 61 | Mapleton | 875 | 762 | +14.83% | Cass |
| 61 | Enderlin | 872 | 886 | −1.58% | Ransom |
| 63 | Gwinner | 834 | 753 | +10.76% | Sargent |
| 64 | Mohall | 808 | 783 | +3.19% | Renville |
| 65 | Dunseith | 797 | 773 | +3.10% | Rolette |
| 66 | Mott | 793 | 721 | +9.99% | Hettinger |
| 67 | Harwood | 788 | 718 | +9.75% | Cass |
| 68 | Napoleon | 787 | 792 | −0.63% | Logan |
| 69 | Drayton | 785 | 824 | −4.73% | Pembina |
| 70 | Underwood | 775 | 778 | −0.39% | McLean |
| 70 | Hatton | 765 | 777 | −1.54% | Traill |
| 72 | Glen Ullin | 743 | 807 | −7.93% | Morton |
| 73 | Ray | 729 | 592 | +23.14% | Williams |
| 74 | Kindred | 728 | 692 | +5.20% | Cass |
| 75 | Ashley | 726 | 749 | −3.07% | McIntosh |
| 76 | Wilton | 725 | 711 | +1.97% | McLean |
| 77 | Steele | 709 | 715 | −0.84% | Kidder |
| 78 | Hebron | 691 | 747 | −7.50% | Morton |
| 79 | New England | 659 | 600 | +9.83% | Hettinger |
| 80 | Milnor | 648 | 653 | −0.77% | Sargent |
| 81 | Lakota | 646 | 672 | −3.87% | Nelson |
| 82 | Elgin | 633 | 642 | −1.40% | Grant |
| 83 | Lidgerwood | 629 | 652 | −3.53% | Richland |
| 84 | Rolette | 612 | 594 | +3.03% | Rolette |
| 85 | Minto | 610 | 604 | +0.99% | Walsh |
| 86 | Reile's Acres | 596 | 513 | +16.18% | Cass |
| 87 | Portland | 592 | 606 | −2.31% | Traill |
| 88 | Turtle Lake | 590 | 581 | +1.55% | McLean |
| 89 | Pembina | 565 | 592 | −4.56% | Pembina |
| 90-(T) | Center | 564 | 571 | −1.23% | Oliver |
| 90-(T) | Towner | 564 | 533 | +5.82% | McHenry |
| 92 | Richardton | 563 | 529 | +6.43% | Stark |
| 93 | Edgeley | 552 | 563 | −1.95% | LaMoure |
| 94 | Forman | 513 | 504 | +1.79% | Sargent |
| 95 | Berthold | 501 | 454 | +10.35% | Ward |
| 96 | Argusville | 475 | 475 | 0.00% | Cass |
| 97 | Fessenden | 472 | 479 | −1.46% | Wells |
| 98 | Glenburn | 456 | 380 | +20.00% | Renville |
| 99 | Leeds | 445 | 427 | +4.22% | Benson |
| 100 | Finley | 437 | 445 | −1.80% | Steele |
| 101 | Emerado | 431 | 414 | +4.11% | Grand Forks |
| 102-(T) | South Heart | 428 | 301 | +42.19% | Stark |
| 102-(T) | Westhope | 428 | 429 | −0.23% | Bottineau |
| 104 | Wyndmere | 418 | 429 | −2.56% | Richland |
| 105 | Strasburg | 392 | 409 | −4.16% | Emmons |
| 106 | Maddock | 382 | 382 | 0.00% | Benson |
| 107 | Bowbells | 377 | 336 | +12.20% | Burke |
| 108-(T) | McClusky | 375 | 380 | −1.32% | Sheridan |
| 108-(T) | Manvel | 375 | 360 | +4.17% | Grand Forks |
| 110 | Stanton | 370 | 366 | +1.09% | Mercer |
| 111 | Arthur | 362 | 337 | +7.42% | Cass |
| 112 | Fairmount | 361 | 367 | −1.63% | Richland |
| 113 | St. John | 360 | 341 | +5.57% | Rolette |
| 114 | Neche | 359 | 371 | −3.23% | Pembina |
| 115 | Gladstone | 358 | 239 | +49.79% | Stark |
| 116 | Sawyer | 346 | 357 | −3.08% | Ward |
| 117 | Kulm | 344 | 354 | −2.82% | LaMoure |
| 118 | Max | 342 | 334 | +2.40% | McLean |
| 119 | McVille | 336 | 349 | −3.72% | Nelson |
| 120-(T) | Buxton | 316 | 323 | −2.17% | Traill |
| 120-(T) | St. Thomas | 316 | 331 | −4.53% | Pembina |
| 122 | Oxbow | 310 | 305 | +1.64% | Cass |
| 123 | Powers Lake | 307 | 280 | +9.64% | Burke |
| 124 | Medina | 303 | 308 | −1.62% | Stutsman |
| 125 | Reynolds | 300 | 301 | −0.33% | Traill |
| 126 | Gackle | 291 | 310 | −6.13% | Logan |
| 127 | Carson | 290 | 293 | −1.02% | Grant |
| 128-(T) | Drake | 288 | 275 | +4.73% | McHenry |
| 128-(T) | Scranton | 288 | 281 | +2.49% | Bowman |
| 130 | Michigan City | 278 | 294 | −5.44% | Nelson |
| 131 | Granville | 269 | 241 | +11.62% | McHenry |
| 132 | Hunter | 267 | 261 | +2.30% | Cass |
| 133 | Hope | 264 | 258 | +2.33% | Steele |
| 134 | Abercrombie | 259 | 263 | −1.52% | Richland |
| 135 | Tower City | 258 | 253 | +1.98% | Cass |
| 136 | Lansford | 254 | 245 | +3.67% | Bottineau |
| 137-(T) | Davenport | 253 | 252 | +0.40% | Cass |
| 137-(T) | Lignite | 253 | 155 | +63.23% | Burke |
| 139 | Alexander | 252 | 223 | +13.00% | McKenzie |
| 140 | Sherwood | 251 | 242 | +3.72% | Renville |
| 141 | Grenora | 250 | 244 | +2.46% | Williams |
| 142 | Anamoose | 249 | 227 | +9.69% | McHenry |
| 143 | Zap | 247 | 237 | +4.22% | Mercer |
| 144 | Page | 240 | 232 | +3.45% | Cass |
| 145 | Walcott | 234 | 235 | −0.43% | Richland |
| 146 | Hoople | 233 | 242 | −3.72% | Walsh |
| 147 | Gilby | 232 | 237 | −2.11% | Grand Forks |
| 148-(T) | Leonard | 227 | 223 | +1.79% | Cass |
| 148-(T) | Riverdale | 227 | 205 | +10.73% | McLean |
| 150 | Minnewaukan | 224 | 224 | 0.00% | Benson |
| 151 | Hazelton | 223 | 235 | −5.11% | Emmons |
| 152 | Halliday | 221 | 188 | +17.55% | Dunn |
| 153 | New Leipzig | 219 | 221 | −0.90% | Grant |
| 154 | Flasher | 216 | 232 | −6.90% | Morton |
| 155-(T) | Frontier | 215 | 214 | +0.47% | Cass |
| 155-(T) | Wimbledon | 215 | 216 | −0.46% | Barnes |
| 157 | Aneta | 209 | 222 | −5.86% | Nelson |
| 158 | Fordville | 206 | 212 | −2.83% | Walsh |
| 159 | Des Lacs | 204 | 204 | 0.00% | Ward |
| 160 | Munich | 202 | 210 | −3.81% | Cavalier |
| 161-(T) | Sheyenne | 200 | 204 | −1.96% | Eddy |
| 161-(T) | Tappen | 200 | 197 | +1.52% | Kidder |
| 163 | Dunn Center | 197 | 146 | +34.93% | Dunn |
| 164 | Mooreton | 194 | 197 | −1.52% | Richland |
| 165 | Plaza | 193 | 171 | +12.87% | Mountrail |
| 166 | Buffalo | 192 | 188 | +2.13% | Cass |
| 167-(T) | Fort Yates | 191 | 184 | +3.80% | Sioux |
| 167-(T) | Sanborn | 191 | 192 | −0.52% | Barnes |
| 169 | Edinburg | 189 | 196 | −3.57% | Walsh |
| 170 | Golden Valley | 183 | 182 | +0.55% | Mercer |
| 171 | Petersburg | 180 | 192 | −6.25% | Nelson |
| 172-(T) | Edmore | 177 | 182 | −2.75% | Ramsey |
| 172-(T) | Rhame | 177 | 169 | +4.73% | Bowman |
| 172-(T) | Taylor | 177 | 148 | +19.59% | Stark |
| 175-(T) | Binford | 174 | 183 | −4.92% | Griggs |
| 175-(T) | Grandin | 174 | 173 | +0.58% | Cass |
| 177 | Regent | 173 | 160 | +8.13% | Hettinger |
| 178 | Litchville | 171 | 172 | −0.58% | Barnes |
| 179 | Selfridge | 168 | 160 | +5.00% | Sioux |
| 180 | Willow City | 167 | 163 | +2.45% | Bottineau |
| 181 | Streeter | 166 | 170 | −2.35% | Stutsman |
| 182-(T) | Kensal | 160 | 163 | −1.84% | Stutsman |
| 182-(T) | Rutland | 160 | 163 | −1.84% | Sargent |
| 184 | Reeder | 159 | 162 | −1.85% | Adams |
| 185 | Portal | 157 | 126 | +24.60% | Burke |
| 186 | Tolna | 156 | 166 | −6.02% | Nelson |
| 187-(T) | Columbus | 155 | 133 | +16.54% | Burke |
| 187-(T) | Wing | 155 | 152 | +1.97% | Burleigh |
| 189 | Christine | 153 | 150 | +2.00% | Richland |
| 190 | Carpio | 149 | 157 | −5.10% | Ward |
| 191 | Makoti | 148 | 154 | −3.90% | Ward |
| 192 | Colfax | 145 | 121 | +19.83% | Richland |
| 193 | Marmarth | 143 | 136 | +5.15% | Slope |
| 194-(T) | Crary | 142 | 142 | 0.00% | Ramsey |
| 194-(T) | Upham | 142 | 130 | +9.23% | McHenry |
| 196 | Pick City | 138 | 123 | +12.20% | Mercer |
| 197-(T) | Marion | 133 | 133 | 0.00% | LaMoure |
| 197-(T) | Medora | 133 | 112 | +18.75% | Billings |
| 199-(T) | Bowdon | 131 | 131 | 0.00% | Wells |
| 199-(T) | Crystal | 131 | 138 | −5.07% | Pembina |
| 201 | Bisbee | 128 | 126 | +1.59% | Towner |
| 202-(T) | Arnegard | 126 | 115 | +9.57% | McKenzie |
| 202-(T) | Noonan | 126 | 121 | +4.13% | Divide |
| 204-(T) | Hannaford | 125 | 131 | −4.58% | Griggs |
| 204-(T) | Oriska | 125 | 118 | +5.93% | Barnes |
| 206-(T) | Adams | 124 | 127 | −2.36% | Walsh |
| 206-(T) | Sheldon | 124 | 116 | +6.90% | Ransom |
| 208-(T) | Forest River | 122 | 125 | −2.40% | Walsh |
| 208-(T) | Osnabrock | 122 | 134 | −8.96% | Cavalier |
| 210 | Starkweather | 117 | 117 | 0.00% | Ramsey |
| 211 | Deering | 116 | 98 | +18.37% | McHenry |
| 212-(T) | Newburg | 115 | 110 | +4.55% | Bottineau |
| 212-(T) | Sykeston | 115 | 117 | −1.71% | Wells |
| 214 | Almont | 112 | 122 | −8.20% | Morton |
| 215 | Buchanan | 111 | 90 | +23.33% | Stutsman |
| 216 | Ross | 110 | 97 | +13.40% | Mountrail |
| 217 | Galesburg | 106 | 108 | −1.85% | Traill |
| 218 | Dodge | 105 | 87 | +20.69% | Dunn |
| 219-(T) | Oberon | 104 | 105 | −0.95% | Benson |
| 219-(T) | Rocklake | 104 | 101 | +2.97% | Towner |
| 221-(T) | Dazey | 102 | 104 | −1.92% | Barnes |
| 221-(T) | Pisek | 102 | 106 | −3.77% | Walsh |
| 223 | Esmond | 99 | 100 | −1.00% | Benson |
| 224-(T) | Cogswell | 98 | 99 | −1.01% | Sargent |
| 224-(T) | Wildrose | 98 | 110 | −10.91% | Williams |
| 226 | Mercer | 97 | 94 | +3.19% | McLean |
| 227-(T) | Goodrich | 96 | 98 | −2.04% | Sheridan |
| 227-(T) | Spiritwood Lake | 96 | 90 | +6.67% | Stutsman |
| 229 | Fingal | 95 | 97 | −2.06% | Barnes |
| 230-(T) | Lankin | 94 | 98 | −4.08% | Walsh |
| 230-(T) | Sharon | 94 | 96 | −2.08% | Steele |
| 232 | Amenia | 93 | 94 | −1.06% | Cass |
| 233 | White Earth | 92 | 80 | +15.00% | Mountrail |
| 234 | Glenfield | 91 | 91 | 0.00% | Foster |
| 235-(T) | Mountain | 88 | 92 | −4.35% | Pembina |
| 235-(T) | Solen | 88 | 83 | +6.02% | Sioux |
| 237 | Montpelier | 87 | 87 | 0.00% | Stutsman |
| 238-(T) | Karlsruhe | 86 | 82 | +4.88% | McHenry |
| 238-(T) | Maxbass | 86 | 84 | +2.38% | Bottineau |
| 238-(T) | Verona | 86 | 85 | +1.18% | LaMoure |
| 241-(T) | Coleharbor | 85 | 79 | +7.59% | McLean |
| 241-(T) | Epping | 85 | 100 | −15.00% | Williams |
| 241-(T) | Zeeland | 85 | 86 | −1.16% | McIntosh |
| 244 | Palermo | 82 | 74 | +10.81% | Mountrail |
| 245 | Hurdsfield | 83 | 84 | −1.19% | Wells |
| 246 | Ryder | 82 | 85 | −3.53% | Ward |
| 247 | Cleveland | 81 | 83 | −2.41% | Stutsman |
| 248-(T) | Dwight | 80 | 82 | −2.44% | Richland |
| 248-(T) | Tuttle | 80 | 80 | 0.00% | Kidder |
| 250-(T) | Fort Ransom | 78 | 77 | +1.30% | Ransom |
| 250-(T) | Lehr | 78 | 80 | −2.50% | Logan |
| 252 | Martin | 77 | 78 | −1.28% | Sheridan |
| 253 | Gardner | 76 | 74 | +2.70% | Cass |
| 254 | Briarwood | 76 | 73 | +4.11% | Cass |
| 255-(T) | Jud | 73 | 72 | +1.39% | LaMoure |
| 255-(T) | Prairie Rose | 73 | 73 | 0.00% | Cass |
| 257 | Flaxton | 72 | 66 | +9.09% | Burke |
| 258 | Havana | 71 | 71 | 0.00% | Sargent |
| 259-(T) | Butte | 69 | 68 | +1.47% | McLean |
| 259-(T) | Pettibone | 69 | 70 | −1.43% | Kidder |
| 261-(T) | Benedict | 67 | 66 | +1.52% | McLean |
| 261-(T) | Golva | 67 | 61 | +9.84% | Golden Valley |
| 261-(T) | Hague | 67 | 71 | −5.63% | Emmons |
| 264-(T) | Ardoch | 66 | 67 | −1.49% | Walsh |
| 264-(T) | Pekin | 66 | 70 | −5.71% | Nelson |
| 266-(T) | Balta | 64 | 65 | −1.54% | Pierce |
| 266-(T) | Warwick | 64 | 65 | −1.54% | Benson |
| 268 | Grace City | 63 | 63 | 0.00% | Foster |
| 269 | Mantador | 62 | 64 | −3.12% | Richland |
| 270-(T) | Dawson | 61 | 61 | 0.00% | Kidder |
| 270-(T) | Douglas | 61 | 64 | −4.69% | Ward |
| 270-(T) | Nome | 61 | 62 | −1.61% | Barnes |
| 270-(T) | Sentinel Butte | 61 | 56 | +8.93% | Golden Valley |
| 274-(T) | Hamilton | 60 | 61 | −1.64% | Pembina |
| 274-(T) | Souris | 60 | 58 | +3.45% | Bottineau |
| 276-(T) | Great Bend | 59 | 60 | −1.67% | Richland |
| 276-(T) | Pingree | 59 | 60 | −1.67% | Stutsman |
| 278-(T) | Brocket | 56 | 57 | −1.75% | Ramsey |
| 278-(T) | McHenry | 56 | 56 | 0.00% | Foster |
| 278-(T) | North River | 56 | 56 | 0.00% | Cass |
| 281-(T) | Donnybrook | 55 | 59 | −6.78% | Ward |
| 281-(T) | Milton | 55 | 58 | −5.17% | Cavalier |
| 283-(T) | Forbes | 53 | 53 | 0.00% | Dickey |
| 283-(T) | Fullerton | 53 | 54 | −1.85% | Dickey |
| 285-(T) | Barney | 51 | 52 | −1.92% | Richland |
| 285-(T) | Kathryn | 51 | 52 | −1.92% | Barnes |
| 285-(T) | Niagara | 51 | 53 | −3.77% | Grand Forks |
| 288 | Alamo | 50 | 57 | −12.28% | Williams |
| 289 | Woodworth | 49 | 50 | −2.00% | Stutsman |
| 290-(T) | Inkster | 48 | 50 | −4.00% | Grand Forks |
| 290-(T) | Tolley | 48 | 47 | +2.13% | Renville |
| 292-(T) | Hampden | 47 | 48 | −2.08% | Ramsey |
| 292-(T) | Nekoma | 47 | 50 | −6.00% | Cavalier |
| 294 | Rogers | 45 | 46 | −2.17% | Barnes |
| 295-(T) | Courtenay | 44 | 45 | −2.22% | Stutsman |
| 295-(T) | Fredonia | 44 | 46 | −4.35% | Logan |
| 295-(T) | Regan | 44 | 43 | +2.33% | Burleigh |
| 298-(T) | Canton City | 43 | 45 | −4.44% | Pembina |
| 298-(T) | Clifford | 43 | 44 | −2.27% | Traill |
| 300-(T) | Cathay | 42 | 43 | −2.33% | Wells |
| 300-(T) | Dickey | 42 | 42 | 0.00% | LaMoure |
| 300-(T) | Voltaire | 42 | 40 | +5.00% | McHenry |
| 303 | Bathgate | 41 | 43 | −4.65% | Pembina |
| 304 | Alice | 40 | 40 | 0.00% | Cass |
| 305 | Landa | 39 | 38 | +2.63% | Bottineau |
| 306-(T) | Fairdale | 37 | 38 | −2.63% | Walsh |
| 306-(T) | Robinson | 37 | 37 | 0.00% | Kidder |
| 308-(T) | Berlin | 35 | 34 | +2.94% | LaMoure |
| 308-(T) | Brinsmade | 35 | 35 | 0.00% | Benson |
| 308-(T) | Monango | 35 | 36 | −2.78% | Dickey |
| 308-(T) | Wolford | 35 | 36 | −2.78% | Pierce |
| 312 | Alsen | 33 | 35 | −5.71% | Cavalier |
| 313 | Luverne | 31 | 31 | 0.00% | Steele |
| 314-(T) | Gardena | 30 | 29 | +3.45% | Bottineau |
| 314-(T) | Kramer | 30 | 29 | +3.45% | Bottineau |
| 314-(T) | Lawton | 30 | 30 | 0.00% | Ramsey |
| 314-(T) | Sibley | 30 | 30 | 0.00% | Barnes |
| 318 | Wales | 29 | 31 | −6.45% | Cavalier |
| 319-(T) | Antler | 28 | 27 | +3.70% | Bottineau |
| 319-(T) | Egeland | 28 | 28 | 0.00% | Towner |
| 321-(T) | Ambrose | 27 | 26 | +3.85% | Divide |
| 321-(T) | Balfour | 27 | 26 | +3.85% | McHenry |
| 321-(T) | Sarles | 27 | 28 | −3.57% | Cavalier |
| 324-(T) | Bucyrus | 26 | 27 | −3.70% | Adams |
| 324-(T) | Cayuga | 26 | 27 | −3.70% | Sargent |
| 326-(T) | Elliott | 25 | 25 | 0.00% | Ransom |
| 326-(T) | Knox | 25 | 25 | 0.00% | Benson |
| 328 | Springbrook | 24 | 27 | −11.11% | Williams |
| 329-(T) | Fortuna | 23 | 22 | +4.55% | Divide |
| 329-(T) | York | 23 | 23 | 0.00% | Benson |
| 331-(T) | Conway | 22 | 23 | −4.35% | Walsh |
| 331-(T) | Haynes | 22 | 23 | −4.35% | Adams |
| 331-(T) | Ludden | 22 | 23 | −4.35% | Dickey |
| 334-(T) | Amidon | 21 | 20 | +5.00% | Slope |
| 334-(T) | Calio | 21 | 22 | −4.55% | Cavalier |
| 334-(T) | Hamberg | 21 | 21 | 0.00% | Wells |
| 337-(T) | Braddock | 20 | 21 | −4.76% | Emmons |
| 337-(T) | Leal | 20 | 20 | 0.00% | Barnes |
| 337-(T) | Mylo | 20 | 20 | 0.00% | Rolette |
| 340 | Calvin | 19 | 20 | −5.00% | Cavalier |
| 341 | Overly | 18 | 18 | 0.00% | Bottineau |
| 342 | Ayr | 17 | 17 | 0.00% | Cass |
| 343-(T) | Gascoyne | 16 | 16 | 0.00% | Bowman |
| 343-(T) | Leith | 16 | 16 | 0.00% | Grant |
| 345-(T) | Bantry | 15 | 14 | +7.14% | McHenry |
| 345-(T) | Loma | 15 | 16 | −6.25% | Cavalier |
| 347-(T) | Hannah | 14 | 15 | −6.67% | Cavalier |
| 347-(T) | Kief | 14 | 13 | +7.69% | McHenry |
| 349 | Venturia | 13 | 10 | +30.00% | McIntosh |
| 350-(T) | Churchs Ferry | 12 | 12 | 0.00% | Ramsey |
| 350-(T) | Hansboro | 12 | 12 | 0.00% | Towner |
| 350-(T) | Pillsbury | 12 | 12 | 0.00% | Barnes |
| 353-(T) | Loraine | 9 | 9 | 0.00% | Renville |
| 353-(T) | Perth | 9 | 9 | 0.00% | Towner |
| 355-(T) | Bergen | 7 | 7 | 0.00% | McHenry |
| 355-(T) | Grano | 7 | 7 | 0.00% | Renville |
| 357 | Ruso | 4 | 4 | 0.00% | McLean |
See also
- North Dakota
- North Dakota statistical areas
- Founding dates of North Dakota incorporated cities
- List of census-designated places in North Dakota
References
- ↑ "Annual Estimates of the Resident Population: April 1, 2010 to July 1, 2015". United States Census Bureau. Retrieved May 20, 2016.
- ↑ "2010 Census Redistricting Data (Public Law 94-171) Summary File". American FactFinder2. U.S. Census Bureau, 2010 Census. Retrieved October 26, 2012.
This article is issued from Wikipedia - version of the 10/19/2016. The text is available under the Creative Commons Attribution/Share Alike but additional terms may apply for the media files.