List of U.S. states by poverty rate
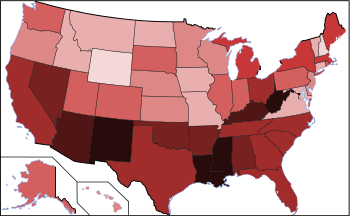
Map of poverty rate in the United States in 2014.
Legend:
Legend:
|
<6%
6%-7.5%
7.5%-9%
|
9%-10.5%
10.5%-12%
12%-13.5%
|
13.5%-15%
15%-16.5%
>16.5%
|

Map of estimated poverty rates in the United States by county, 2008.
Legend:
|
<5%
<10%
<15%
|
<20%
<25%
<30%
|
<35%
<40%
>40%
|
This article is a list of the 50 United States of America (U.S.) states, also including the District of Columbia, ordered by poverty rate. 2014 statistics are not identical to official poverty rates because they include children not counted in the official numbers (see Revised Tables link below). Supplemental Poverty Measure takes into account differences in cost of living between states (i.e. housing costs appreciably higher/lower than the national average) as well as taxes and the value of government assistance programs. All data are from the United States Census Bureau.
States
| Rank | State | Poverty Rate (by Household Income) | People in Poverty by Household Income (in thousands) | 2014 Poverty Rates (includes unrelated children) | Supplemental Poverty Measure (2010-2014 average) (Geographically Adjusted) |
|---|---|---|---|---|---|
| - | United States | 14.8% | 45,950 | 16.0%[1][2] | |
| 1 | New Hampshire | 9.2% | 117 | 9.5% | 15.5% |
| 2 | Maryland | 10.4% | 604 | 9.6% | 10.1% |
| 3 | Wyoming | 10.6% | 54 | 9.3% | 9.2 |
| 4 | Connecticut | 10.8% | 376 | 10.6% | 12.5%[3][4][5] |
| 5 | North Dakota | 11.1% | 79 | 11.0% | 9.2% |
| 6 | New Jersey | 11.1% | 972 | 13.7% | 13.9%[6][7] |
| 7 | Minnesota | 11.4% | 607 | 12.1% | 9.7% |
| 8 | Alaska | 11.4% | 81 | 12.1% | 12.5% |
| 9 | Hawaii | 11.5% | 158 | 12.6% | 17.3% |
| 10 | Massachusetts | 11.7% | 760 | 10.9% | 13.8% |
| 11 | Virginia | 11.8% | 955 | 10.8% | 13.3% |
| 12 | Utah | 11.8% | 341 | 9.8% | 11.6% |
| 13 | Colorado | 12.1% | 632 | 12.4% | 13.7% |
| 14 | Vermont | 12.2% | 72 | 9.7% | 13.4%[8] |
| 15 | Nebraska | 12.3% | 167 | 10.0% | 9.8%[9][10] |
| 16 | Iowa | 12.3% | 368 | 10.9% | 8.6% |
| 17 | Delaware | 13.0% | 118 | 12.4% | 13.9% |
| 18 | Wisconsin | 13.2% | 737 | 11.1% | 10.8% |
| 19 | Washington | 13.2% | 913 | 11.9% | 12.2% |
| 20 | Kansas | 13.5% | 381 | 13.9% | 11.5% |
| 21 | Pennsylvania | 13.6% | 1,679 | 11.2% | 12.6% |
| 22 | Maine | 14.0% | 181 | 11.6% | 11.2% |
| 23 | South Dakota | 14.1% | 115 | 14.3% | 10.6% |
| 24 | Illinois | 14.3% | 1,802 | 13.3% | 15.2% |
| 25 | Rhode Island | 14.8% | 149 | 13.2% | 13.6% |
| 26 | Idaho | 14.8% | 237 | 13.9% | 11.8% |
| 27 | Montana | 15.2% | 151 | 13.5% | 12.1% |
| 28 | Indiana | 15.2% | 968 | 16.4% | 14.2% |
| 29 | Nevada | 15.4% | 430 | 13.1% | 19.8% |
| 30 | Missouri | 15.5% | 908 | 15.6% | 12.4% |
| 31 | Ohio | 15.8% | 1,778 | 13.5% | 13.2% |
| 32 | New York | 15.9% | 2,760 | 15.9% | 18.1%[11] |
| 33 | Michigan | 16.2% | 1,567 | 27.6% | 13.5% |
| 34 | Oregon | 16.4% | 637 | 7.11% | 10.3% |
| 35 | California | 16.4% | 6,253 | 15.5% | 23.8% |
| 36 | Oklahoma | 16.6% | 623 | 13.0% | 13.4% |
| 37 | Florida | 16.6% | 3,231 | 14.6% | 19.5%[12] |
| 38 | Texas | 17.2% | 4,519 | 17.4% | 16.4% |
| 39 | North Carolina | 17.2% | 1,663 | 17.0% | 14.2% |
| 40 | South Carolina | 17.9% | 838 | 13.8% | 15.8% |
| 41 | Tennessee | 18.2% | 1,165 | 16.7% | 15.5% |
| 42 | Arizona | 18.2% | 1,195 | 21.3% | 18.8% |
| 43 | West Virginia | 18.3% | 328 | 16.0% | 12.9% |
| 44 | Georgia | 18.4% | 1,298 | 18.5% | 18.2% |
| 45 | District of Columbia | 18.4% | 114 | 18.0% | 22.7%[13] |
| 46 | Arkansas | 18.7% | 539 | 19.1% | 16.5% |
| 47 | Kentucky | 19.0% | 812 | 17.1% | 13.6% |
| 48 | Alabama | 19.2% | 905 | 16.8% | 13.5% |
| 49 | Louisiana | 19.9% | 898 | 14.3% | 18.5%[14] |
| 50 | New Mexico | 20.6% | 347 | 19.6% | 16.1% |
| 51 | Mississippi | 21.9% | 634 | 23.2% | 16.1%[15] |
See also
- List of US states by Gini coefficient
- List of lowest-income places in the United States
- Thank God for Mississippi
References
- ↑ "Income, Poverty and Health Insurance Coverage in the U.S.: 2014".
- ↑ "Small Area Income and Poverty Estimates - Interactive Data and Mapping - U.S. Census Bureau".
- ↑ http://www.census.gov/quickfacts/table/RHI105210/09
- ↑ http://talkpoverty.org/state-year-report/connecticut-2015-report
- ↑ http://www.census.gov/did/www/saipe/data/interactive/saipe.html?s_appName=saipe&map_yearSelector=2014&map_geoSelector=aa_c&s_state=09&menu=grid_proxy&s_inclUsTot=n
- ↑ http://www.census.gov/quickfacts/table/RHI105210/34
- ↑ http://www.census.gov/did/www/saipe/data/interactive/saipe.html?s_appName=saipe&map_yearSelector=2014&map_geoSelector=aa_c&s_state=34&menu=grid_proxy&s_inclUsTot=n
- ↑ http://www.census.gov/quickfacts/table/RHI105210/50
- ↑ http://www.census.gov/did/www/saipe/data/interactive/saipe.html?s_appName=saipe&map_yearSelector=2014&map_geoSelector=aa_c&s_state=31&menu=grid_proxy
- ↑ https://www.census.gov/content/dam/Census/library/publications/2014/demo/p60-251.pdf
- ↑ http://www.census.gov/quickfacts/table/RHI105210/36
- ↑ http://www.census.gov/quickfacts/table/RHI105210/12
- ↑ http://www.census.gov/quickfacts/table/RHI105210/11
- ↑ http://www.census.gov/quickfacts/table/RHI105210/22
- ↑ http://www.census.gov/quickfacts/table/RHI105210/28,00
External links
- Total Number of People Living in Poverty based on Household Income (In Thousands), 2005. State Health Facts. December 14, 2007.
- Poverty Rate based on Household Income, 2005 . State Health Facts. December 14, 2007.
- Geographic Adjustments of Supplemental Poverty Measure Thresholds: Using the American Community Survey Five-Year Data on Housing Costs Accessed November 27, 2012.
- The Research Supplemental Poverty Measure Accessed June 5, 2014.
| Demographics | |
|---|---|
| Economy | |
| Environment | |
| Geography | |
| Government | |
| Health | |
| History | |
| Law | |
| Miscellaneous | |
| |
This article is issued from Wikipedia - version of the 11/18/2016. The text is available under the Creative Commons Attribution/Share Alike but additional terms may apply for the media files.