List of U.S. states by Hispanic and Latino population
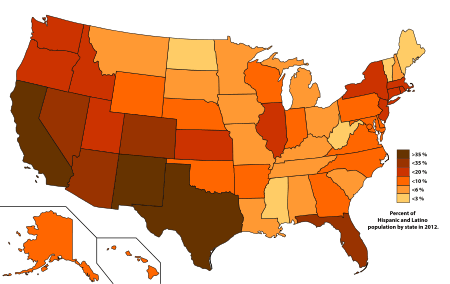
Percent of Hispanic and Latino population by state in 2012.
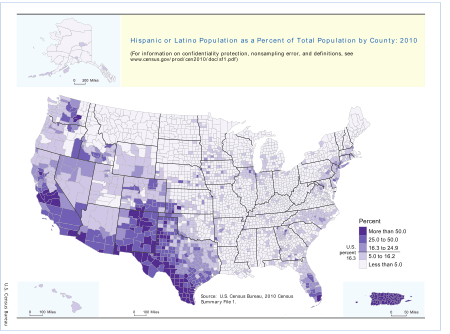
Hispanic and Latino population by counties in the U.S. (2010 US Census)

Population change in Hispanic and Latino population from 2000 to 2010. As of 2010, Hispanic and Latinos were the fastest growing population demographic in the United States
The following are lists of the Hispanic and Latino population per each state in the United States.
As of 2012, Hispanics and Latinos make up about 17% of the total U.S. population. The state with the largest percentage of Hispanics and Latinos is New Mexico at 47%. The state with the largest Hispanic and Latino population overall is California with over 14 million Hispanics and Latinos.
2010 US Census results
| State/Territory | Pop 2000 | % pop 2000 | Pop 2010 | % pop 2010 | % growth 2000-2010 | %pop 2012 |
|---|---|---|---|---|---|---|
| 75,830 | 1.7% | 185,602 | 3.9% | +144.8% | 4.1% | |
| 25,852 | 4.1% | 39,250 | 5.5% | +51.8% | 6.1% | |
| 1,295,617 | 25.3% | 1,895,149 | 29.6% | +46.3% | 30.2% | |
| 86,866 | 3.2% | 186,050 | 6.4% | +114.2% | 6.8% | |
| 10,966,556 | 32.4% | 14,013,719 | 37.6% | +27.8% | 38.2% | |
| 735,801 | 17.1% | 1,038,687 | 20.7% | +41.2% | 21.0% | |
| 320,323 | 9.4% | 479,087 | 13.4% | +49.6% | 14.2% | |
| 37,277 | 4.8% | 73,221 | 8.2% | +96.4% | 8.6% | |
| 44,953 | 7.9% | 54,749 | 9.1% | +21.8% | 9.9% | |
| 2,682,715 | 16.8% | 4,223,806 | 22.5% | +57.4% | 23.2% | |
| 435,227 | 5.3% | 853,689 | 8.8% | +96.1% | 9.2% | |
| 87,699 | 7.2% | 120,842 | 8.9% | +37.8% | 9.5% | |
| 101,690 | 7.9% | 175,901 | 11.2% | +73.0% | 11.6% | |
| 1,530,262 | 12.3% | 2,027,578 | 15.8% | +32.5% | 16.3% | |
| 214,536 | 3.5% | 389,707 | 6.0% | +81.7% | 6.3% | |
| 82,473 | 2.8% | 151,544 | 5.0% | +83.7% | 5.3% | |
| 188,252 | 7.0% | 300,042 | 10.5% | +59.4% | 11.0% | |
| 59,939 | 1.5% | 132,836 | 3.1% | +121.6% | 3.2% | |
| 107,738 | 2.4% | 192,560 | 4.2% | +78.7% | 4.5% | |
| 9,360 | 0.7% | 16,935 | 1.3% | +80.9% | 1.4% | |
| 227,916 | 4.3% | 470,632 | 8.2% | +106.5% | 8.7% | |
| 428,729 | 6.8% | 627,654 | 9.6% | +46.4% | 10.1% | |
| 323,877 | 3.3% | 436,358 | 4.4% | +34.7% | 4.6% | |
| 143,382 | 2.9% | 250,258 | 4.7% | +74.5% | 4.9% | |
| 39,569 | 1.4% | 81,481 | 2.7% | +105.9% | 2.9% | |
| 118,592 | 2.1% | 212,470 | 3.5% | +79.2% | 3.7% | |
| 18,081 | 2.0% | 28,565 | 2.9% | +58.0% | 3.1% | |
| 94,425 | 5.5% | 167,405 | 9.2% | +77.3% | 9.7% | |
| 393,970 | 19.7% | 716,501 | 26.5% | +81.9% | 27.3% | |
| 20,489 | 1.7% | 36,704 | 2.8% | +79.1% | 3.0% | |
| 1,117,191 | 13.3% | 1,555,144 | 17.7% | +39.2% | 18.5% | |
| 765,386 | 42.1% | 953,403 | 46.3% | +24.6% | 47.0% | |
| 2,867,583 | 15.1% | 3,416,922 | 17.6% | +19.2% | 18.2% | |
| 378,963 | 4.7% | 800,120 | 8.4% | +111.1% | 8.7% | |
| 7,786 | 1.2% | 13,467 | 2.0% | +73.0% | 2.5% | |
| 217,123 | 1.9% | 354,674 | 3.1% | +63.4% | 3.3% | |
| 179,304 | 5.2% | 332,007 | 8.9% | +85.2% | 9.3% | |
| 275,314 | 8.0% | 450,062 | 11.7% | +63.5% | 12.2% | |
| 394,088 | 3.2% | 719,660 | 5.7% | +82.6% | 6.1% | |
| 90,820 | 8.7% | 130,655 | 12.4% | +43.9% | 13.2% | |
| 95,076 | 2.4% | 235,682 | 5.1% | +147.9% | 5.3% | |
| 10,903 | 1.4% | 22,119 | 2.7% | +102.9% | 3.1% | |
| 123,838 | 2.2% | 290,059 | 4.6% | +134.2% | 4.8% | |
| 6,669,666 | 32.0% | 9,460,921 | 37.6% | +41.8% | 38.2% | |
| 201,559 | 9.0% | 358,340 | 13.0% | +77.8% | 13.3% | |
| 5,504 | 0.9% | 9,208 | 1.5% | +67.3% | 1.6% | |
| 329,540 | 4.7% | 631,825 | 7.9% | +91.7% | 8.4% | |
| 441,509 | 7.5% | 755,790 | 11.2% | +71.2% | 11.7% | |
| 12,279 | 0.7% | 22,268 | 1.2% | +81.4% | 1.3% | |
| 192,921 | 3.6% | 336,056 | 5.9% | +74.2% | 6.2% | |
| 31,669 | 6.4% | 50,231 | 8.9% | +58.6% | 9.5% | |
| 109[3] | 0,2% | |||||
| 2,124 [4] | 1.4% | |||||
| 117[5] | 0,2% | |||||
| 3,762,746 | 98.8% | 3,688,455 | 99.0% | +0.2% | 99.5% | |
| 15,196 | 14.0% | 18,514 | 17.4% [6] | |||
| 35,305,818 | 12.5% | 50,477,594 | 16.3% | +43.0% | 16.9% | |
US states by Mexican American population
| State/Territory | Mexican American Population (2010 Census)[7] | Percentage |
|---|---|---|
| | 122,911 | 2.6 |
| | 21,642 | 3.0 |
| | 1,657,668 | 25.9 |
| | 138,194 | 4.7 |
| | 11,423,146 | 30.7 |
| | 757,181 | 15.1 |
| | 50,658 | 1.4 |
| | 30,283 | 3.0 |
| | 8,507 | 1.4 |
| | 629,718 | 3.3 |
| | 519,502 | 5.4 |
| | 35,415 | 2.6 |
| | 148,923 | 9.5 |
| | 1,602,403 | 12.5 |
| | 295,373 | 4.6 |
| | 117,090 | 3.8 |
| | 247,297 | 8.7 |
| | 82,110 | 1.9 |
| | 78,643 | 1.7 |
| | 5,134 | 0.4 |
| | 88,004 | 1.5 |
| | 38,379 | 0.6 |
| | 317,903 | 3.2 |
| | 176,007 | 3.3 |
| | 52,459 | 1.8 |
| | 147,254 | 2.5 |
| | 20,048 | 2.0 |
| | 128,060 | 7.0 |
| | 540,978 | 20.0 |
| | 7,822 | 0.6 |
| | 217,715 | 2.5 |
| | 590,890 | 28.7 |
| | 457,288 | 2.4 |
| | 486,960 | 5.1 |
| | 9,223 | 1.4 |
| | 172,029 | 1.5 |
| | 267,016 | 7.1 |
| | 369,817 | 9.7 |
| | 129,568 | 1.0 |
| | 9,090 | 0.9 |
| | 138,350 | 3.0 |
| | 13,839 | 1.7 |
| | 186,615 | 2.9 |
| | 7,951,193 | 31.6 |
| | 258,905 | 9.4 |
| | 2,534 | 0.4 |
| | 155,067 | 1.9 |
| | 601,768 | 8.9 |
| | 9,704 | 0.5 |
| | 244,248 | 4.3 |
| | 37,719 | 6.7 |
| Total US | 31,798,258 | 10.3 |
US states by Puerto Rican population
| State/Territory | Puerto Rican-American Population (2010 Census)[7][8] | Percentage[note 1][9] |
|---|---|---|
| | 12,225 | 0.3 |
| | 4,502 | 0.6 |
| | 34,787 | 0.5 |
| | 4,789 | 0.2 |
| | 189,945 | 0.5 |
| | 22,995 | 0.5 |
| | 252,972 | 7.1 |
| | 22,533 | 2.5 |
| | 3,129 | 0.5 |
| | 847,550 | 4.5 |
| | 71,987 | 0.7 |
| | 44,116 | 3.2 |
| | 2,910 | 0.2 |
| | 182,989 | 1.4 |
| | 30,304 | 0.5 |
| | 4,885 | 0.2 |
| | 9,247 | 0.3 |
| | 11,454 | 0.3 |
| | 11,603 | 0.3 |
| | 4,377 | 0.3 |
| | 42,572 | 0.7 |
| | 266,125 | 4.1 |
| | 37,267 | 0.4 |
| | 10,807 | 0.2 |
| | 5,888 | 0.2 |
| | 12,236 | 0.2 |
| | 1,491 | 0.2 |
| | 3,242 | 0.2 |
| | 20,664 | 0.8 |
| | 11,729 | 0.9 |
| | 434,092 | 4.9 |
| | 7,964 | 0.4 |
| | 1,070,558 | 5.5 |
| | 71,800 | 0.8 |
| | 987 | 0.1 |
| | 94,965 | 0.8 |
| | 12,223 | 0.3 |
| | 8,845 | 0.2 |
| | 366,082 | 2.9 |
| | 34,979 | 3.3 |
| | 26,493 | 0.6 |
| | 1,483 | 0.2 |
| | 21,060 | 0.3 |
| | 130,576 | 0.5 |
| | 7,182 | 0.3 |
| | 2,261 | 0.4 |
| | 73,958 | 0.9 |
| | 25,838 | 0.4 |
| | 3,701 | 0.2 |
| | 46,323 | 0.8 |
| | 1,026 | 0.2 |
| United States | 4,623,716 | 1.5 |
Historic Hispanic/Latino population (1910-2012)
| State/Territory | 1910 | 1920 | 1930 | 1940 | 1950 | 1960 | 1970 | 1980 | 1990 | 2000 | 2010 | 2012 |
|---|---|---|---|---|---|---|---|---|---|---|---|---|
| 0.4% | 0.7% | 1.2% | 1.4% | 16 | 15 | 4.720 | 6.4% | 9.0% | 12.5% | 16.3% | 16.9% | |
| 0.0% | 0.0% | 0.0% | 0.0% | 0.4% | 0.9% | 0.6% | 1.7% | 3.9% | 4.1% | |||
| 2.1% | 2.4% | 3.2% | 4.1% | 5.5% | 6.1% | |||||||
| 28.6% | 30.4% | 30.2% | 20.4% | 17.2% | 14.9% | 17.3% | 16.2% | 18.8% | 25.3% | 29.6% | 30.2% | |
| 0.0% | 0.0% | 0.0% | 0.0% | 0.5% | 0.8% | 0.8% | 3.2% | 6.4% | 6.8% | |||
| 2.1% | 3.7% | 6.8% | 6.0% | 7.2% | 9.1% | 13.7% | 19.2% | 25.8% | 32.4% | 37.6% | 38.2% | |
| 0.4% | 1.6% | 5.7% | 8.2% | 9.0% | 9.0% | 11.6% | 11.8% | 12.9% | 17.1% | 20.7% | 21.0% | |
| 0.0% | 0.0% | 0.0% | 0.1% | 2.4% | 4.0% | 6.5% | 9.4% | 13.4% | 14.2% | |||
| 0.0% | 0.0% | 0.0% | 0.1% | 1.1% | 1.6% | 2.4% | 4.8% | 8.2% | 8.6% | |||
| 0.0% | 0.0% | 0.0% | 0.1% | 2.1% | 2.8% | 5.4% | 7.9% | 9.1% | 9.9% | |||
| 0.0% | 0.0% | 0.0% | 1.3% | 6.6% | 8.8% | 12.2% | 16.8% | 22.5% | 23.2% | |||
| 0.0% | 0.0% | 0.0% | 0.0% | 0.6% | 1.1% | 1.7% | 5.3% | 8.8% | 9.2% | |||
| 3.0% | 7.4% | 7.3% | 7.2% | 8.9% | 9.5% | |||||||
| 0.0% | 0.3% | 0.3% | 0.5% | 2.6% | 3.9% | 5.3% | 7.9% | 11.2% | 11.6% | |||
| 0.0% | 0.1% | 0.4% | 0.3% | 3.3% | 5.6% | 7.9% | 12.3% | 15.8% | 16.3% | |||
| 0.0% | 0.0% | 0.3% | 0.2% | 1.3% | 1.6% | 1.8% | 3.5% | 6.0% | 6.3% | |||
| 0.0% | 0.1% | 0.2% | 0.1% | 0.6% | 0.9% | 1.2% | 2.8% | 5.0% | 5.3% | |||
| 0.5% | 0.9% | 1.1% | 0.7% | 2.1% | 2.7% | 3.8% | 7.0% | 10.5% | 11.0% | |||
| 0.0% | 0.0% | 0.0% | 0.0% | 0.3% | 0.7% | 0.6% | 1.5% | 3.1% | 3.2% | |||
| 0.1% | 0.2% | 0.3% | 0.2% | 1.9% | 2.4% | 2.2% | 2.4% | 4.2% | 4.5% | |||
| 0.0% | 0.0% | 0.0% | 0.0% | 0.4% | 0.4% | 0.6% | 0.7% | 1.3% | 1.4% | |||
| 0.0% | 0.0% | 0.0% | 0.0% | 1.4% | 1.5% | 2.6% | 4.3% | 8.2% | 8.7% | |||
| 0.0% | 0.0% | 0.0% | 0.1% | 1.1% | 2.5% | 4.8% | 6.8% | 9.6% | 10.1% | |||
| 0.0% | 0.0% | 0.3% | 0.2% | 1.4% | 1.8% | 2.2% | 3.3% | 4.4% | 4.6% | |||
| 0.0% | 0.0% | 0.1% | 0.1% | 0.6% | 0.8% | 1.2% | 2.9% | 4.7% | 4.9% | |||
| 0.0% | 0.0% | 0.1% | 0.0% | 0.4% | 1.0% | 0.6% | 1.4% | 2.7% | 2.9% | |||
| 0.0% | 0.1% | 0.1% | 0.1% | 0.9% | 1.1% | 1.2% | 2.1% | 3.5% | 3.7% | |||
| 0.0% | 0.1% | 0.5% | 0.4% | 1.1% | 1.3% | 1.5% | 2.0% | 2.9% | 3.1% | |||
| 0.0% | 0.2% | 0.5% | 0.4% | 1.4% | 1.8% | 2.3% | 5.5% | 9.2% | 9.7% | |||
| 1.1% | 1.8% | 3.7% | 2.8% | 5.6% | 6.7% | 10.4% | 19.7% | 26.5% | 27.3% | |||
| 0.0% | 0.0% | 0.0% | 0.0% | 0.4% | 0.6% | 1.0% | 1.7% | 2.8% | 3.0% | |||
| 0.0% | 0.0% | 0.0% | 0.2% | 4.3% | 6.7% | 9.6% | 13.3% | 17.7% | 18.5% | |||
| 6.9% | 9.8% | 15.2% | 41.7% | 36.5% | 28.3% | 37.4% | 36.6% | 38.2% | 42.1% | 46.3% | 47.0% | |
| 0.0% | 0.0% | 0.0% | 1.0% | 8.0% | 9.5% | 12.3% | 15.1% | 17.6% | 18.2% | |||
| 0.0% | 0.0% | 0.0% | 0.0% | 0.4% | 1.0% | 1.2% | 4.7% | 8.4% | 8.7% | |||
| 0.0% | 0.0% | 0.1% | 0.0% | 0.3% | 0.6% | 0.7% | 1.2% | 2.0% | 2.5% | |||
| 0.0% | 0.0% | 0.1% | 0.1% | 0.9% | 1.1% | 1.3% | 1.9% | 3.1% | 3.3% | |||
| 0.3% | 0.4% | 0.2% | 0.2% | 1.4% | 1.9% | 2.7% | 5.2% | 8.9% | 9.3% | |||
| 0.0% | 0.1% | 0.2% | 0.1% | 1.7% | 2.5% | 4.0% | 8.0% | 11.7% | 12.2% | |||
| 0.0% | 0.0% | 0.0% | 0.1% | 0.9% | 1.3% | 2.0% | 3.2% | 5.7% | 6.1% | |||
| 0.0% | 0.0% | 0.0% | 0.1% | 0.7% | 2.1% | 4.6% | 8.7% | 12.4% | 13.2% | |||
| 0.0% | 0.0% | 0.0% | 0.0% | 0.4% | 1.1% | 0.9% | 2.4% | 5.1% | 5.3% | |||
| 0.0% | 0.0% | 0.1% | 0.0% | 0.4% | 0.6% | 0.8% | 1.4% | 2.7% | 3.1% | |||
| 0.0% | 0.0% | 0.0% | 0.0% | 0.4% | 0.7% | 0.7% | 2.2% | 4.6% | 4.8% | |||
| 7.1% | 9.9% | 13.8% | 11.5% | 13.3% | 14.8% | 17.7% | 21.0% | 25.5% | 32.0% | 37.6% | 38.2% | |
| 0.0% | 0.3% | 0.8% | 0.5% | 4.1% | 4.1% | 4.9% | 9.0% | 13.0% | 13.3% | |||
| 0.0% | 0.0% | 0.0% | 0.2% | 0.6% | 0.6% | 0.7% | 0.9% | 1.5% | 1.6% | |||
| 0.0% | 0.0% | 0.0% | 0.0% | 1.0% | 1.5% | 2.6% | 4.7% | 7.9% | 8.4% | |||
| 0.0% | 0.0% | 0.0% | 0.1% | 2.1% | 2.9% | 4.4% | 7.5% | 11.2% | 11.7% | |||
| 0.0% | 0.0% | 0.0% | 0.1% | 0.4% | 0.7% | 0.5% | 0.7% | 1.2% | 1.3% | |||
| 0.0% | 0.0% | 0.1% | 0.1% | 0.9% | 1.3% | 1.9% | 3.6% | 5.9% | 6.2% | |||
| 0.2% | 1.1% | 3.2% | 2.4% | 5.6% | 5.2% | 5.7% | 6.4% | 8.9% | 9.5% | |||
| 98.8% | 99.0% | 99.5% |
See also
- Mexican migration
- Demographics of Hispanic and Latino Americans
- Illegal immigrant population of the United States
- Christianity among Hispanic and Latino Americans
Cities and neighborhoods:
- List of U.S. cities with large Hispanic populations
- List of U.S. cities by Spanish-speaking population
- List of Hispanic neighborhoods
- List of California communities with Hispanic majority populations in the 2010 census
Notes
- ↑ Percentage of the state population that identifies itself as Puerto Rican relative to the state/territory" population as a whole.
References
- ↑ US Census Bureau: "Redistricting Data, First Look at Local 2010 Census Results"
- ↑ US Census Bureau: "Population by Race and Hispanic or Latino Origin, for the United States, Regions, Divisions, and States, and for Puerto Rico: 2000"
- ↑ ETHNIC ORIGIN OR RACE ALONE OR IN COMBINATION Universe: Total ethnic origin and race groups tallied more information 2010 American Samoa Summary File
- ↑ ETHNIC ORIGIN OR RACE ALONE OR IN COMBINATION Universe: Total ethnic origin and race groups tallied more information 2010 Guam Summary File
- ↑ ETHNIC ORIGIN OR RACE ALONE OR IN COMBINATION Universe: Total ethnic origin and race groups tallied more information 2010 Northern Mariana Islands Summary File
- ↑ "Census 2010 News | U.S. Census Bureau Releases 2010 Census Ethnic Counts for the U.S. Virgin Islands". 2010.census.gov. Retrieved March 23, 2013.
- 1 2 US Census Bureau: Table QT-P10 Hispanic or Latino by Type: 2010 retrieved January 22, 2012 - select state from drop-down menu
- ↑ "2010 Census". Medgar Evers College. Archived from the original on June 11, 2010. Retrieved 2010-04-13.
- ↑ http://factfinder2.census.gov/faces/tableservices/jsf/pages/productview.xhtml?pid=DEC_10_SF1_QTP10&prodType=table
- ↑ "Historical Census Statistics on Population Totals By Race, 1790 to 1990, and By Hispanic Origin, 1970 to 1990, For The United States, Regions, Divisions, and States". Census.gov. Retrieved 2015-07-30.
- ↑ "U.S. Census of Population: 1960" (PDF). Www2.census.gov. Retrieved 2012-09-30.
- ↑ "The Hispanic Population: 2000" (PDF). US Census Bureau. Retrieved 2015-07-30.
- ↑ "The Hispanic Population: 2010" (PDF). US Census Bureau. Retrieved 2015-07-30.
| Demographics | |
|---|---|
| Economy | |
| Environment | |
| Geography | |
| Government | |
| Health | |
| History | |
| Law | |
| Miscellaneous | |
| |
This article is issued from Wikipedia - version of the 9/16/2016. The text is available under the Creative Commons Attribution/Share Alike but additional terms may apply for the media files.